Cortez neighborhood in Mission Viejo, California (CA), 92692 detailed profile
Settings
X


Business Search - 14 Million verified businesses
Area: 0.090 square miles
Population: 514
Population density:
| Cortez: | 5,701 people per square mile |
| Mission Viejo: | 4,919 people per square mile |

- 35067.8%White
- 6212.0%Asian
- 499.5%Hispanic or Latino
- 407.8%Two or more races
- 122.3%Some other race
- 30.6%Black

Median household income in 2022:
| Cortez: | $166,638 |
| Mission Viejo: | $126,469 |
Distribution of median household income
![Distribution of median household income]()
- 4Less than $10,000
- 9$10,000 to $19,999
- 13$20,000 to $29,999
- 2$30,000 to $39,999
- 12$40,000 to $49,999
- 10$50,000 to $59,999
- 6$60,000 to $74,999
- 19$75,000 to $99,999
- 14$100,000 to $124,999
- 17$125,000 to $149,999
- 29$150,000 to $199,999
- 62$200,000 or more

Distribution of owner-occupied house/condo value
![Distribution of owner-occupied house/condo value]()
- 3Less than $50,000
- 7$100,000 to $149,999
- 62$500,000 to $749,999
- 82$750,000 to $999,999
- 71$1,000,000 or more

Distribution of rent paid by renters
![Distribution of rent paid by renters]()
- 6$1,500 to $1,999
- 48$2,000 or more

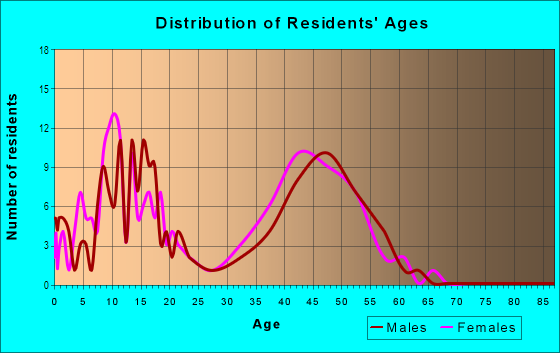
| Males: | 273 |
| Females: | 240 |
Males:
| This neighborhood: | 43.9 years |
| Whole city: | 42.6 years |
| This neighborhood: | 48.8 years |
| Whole city: | 45.6 years |
Average household size:
| Cortez: | 7.6 people |
| Mission Viejo: | 2.8 people |
Percentage of family households:
| Cortez: | 52.5% |
| Mission Viejo: | 50.2% |
| Here: | 72.7% |
| Mission Viejo: | 58.8% |
Percentage of married-couple families with children (among all households):
| Cortez: | 32.7% |
| Mission Viejo: | 29.0% |
Percentage of single-mother households (among all households):
| Cortez: | 5.0% |
| Mission Viejo: | 5.1% |
Percentage of never married males 15 years old and over:
Percentage of never married females 15 years old and over:
| Cortez: | 15.2% |
| Mission Viejo: | 17.0% |
Percentage of never married females 15 years old and over:
| Cortez: | 7.8% |
| city: | 12.1% |
Percentage of people that speak English not well or not at all:
| Cortez: | 1.6% |
| Mission Viejo: | 3.7% |
Percentage of people born in this state:
Percentage of people born in another U.S. state:
Percentage of native residents but born outside the U.S.:
Percentage of foreign born residents:
| Here: | 53.1% |
| Mission Viejo: | 56.8% |
Percentage of people born in another U.S. state:
| Cortez: | 26.0% |
| Mission Viejo: | 21.7% |
Percentage of native residents but born outside the U.S.:
| Here: | 0.8% |
| city: | 2.0% |
Percentage of foreign born residents:
| Here: | 20.1% |
| Mission Viejo: | 19.5% |

Owner-occupied
Renter-occupied


- Rooms in owner-occupied houses and condos in Cortez
- 01 room
- 02 rooms
- 83 rooms
- 64 rooms
- 135 rooms
- 336 rooms
- 247 rooms
- 318 rooms
- 429+ rooms

- Rooms in renter-occupied apartments in Cortez
- 01 room
- 02 rooms
- 63 rooms
- 14 rooms
- 105 rooms
- 76 rooms
- 77 rooms
- 48 rooms
- 19+ rooms
Owner-occupied
Renter-occupied

- Bedrooms in owner-occupied houses and condos in Cortez
- 0no bedroom
- 01 bedroom
- 92 bedrooms
- 483 bedrooms
- 834 bedrooms
- 135+ bedrooms

- Bedrooms in renter-occupied apartments in Cortez
- 0no bedroom
- 61 bedroom
- 92 bedrooms
- 103 bedrooms
- 74 bedrooms
- 65+ bedrooms
Average number of cars or other vehicles available in houses/condos:
Average number of cars or other vehicles available in apartments:
| This neighborhood: | 2.5 |
| Mission Viejo: | 2.3 |
Average number of cars or other vehicles available in apartments:
| Here: | 1.8 |
| city: | 1.7 |
Percentage of units with a mortgage:
| Cortez: | 80.0% |
| Mission Viejo: | 76.4% |
Average estimated value of detached houses in 2022 (93.9% of all units):
| Cortez: | $988,350 |
| California: | $988,808 |

- Year house built in Cortez
- 02020 or later
- 12010 to 2019
- 22000 to 2009
- 381990 to 1999
- 1291980 to 1989
- 101970 to 1979
- 41960 to 1969
- 31950 to 1959
- 51940 to 1949
- 01939 or earlier

City-data.com crime index for city in 2020 (higher means more crime):
| City: | 63.4 |
| U.S. average: | 219.5 |
Travel time to work (commute)
![Travel time to work (commute)]()
- 1Less than 5 minutes
- 35 to 9 minutes
- 3310 to 14 minutes
- 2615 to 19 minutes
- 2820 to 24 minutes
- 1125 to 29 minutes
- 1430 to 34 minutes
- 1235 to 39 minutes
- 340 to 44 minutes
- 2045 to 59 minutes
- 460 to 89 minutes
- 590 or more minutes

Means of transportation to work
![Means of transportation to work]()
- 72.2%175Drove a car alone
- 5.0%12Carpooled
- 4.1%10Motorcycle
- 0.8%2Walked
- 3.3%8Other means
- 18.2%44Worked at home

Time leaving home to go to work
![Time leaving home to go to work]()
- 512:00 a.m. to 4:59 a.m.
- 85:00 a.m. to 5:29 a.m.
- 55:30 a.m. to 5:59 a.m.
- 116:00 a.m. to 6:29 a.m.
- 126:30 a.m. to 6:59 a.m.
- 287:00 a.m. to 7:29 a.m.
- 247:30 a.m. to 7:59 a.m.
- 288:00 a.m. to 8:29 a.m.
- 68:30 a.m. to 8:59 a.m.
- 59:00 a.m. to 9:59 a.m.
- 1110:00 a.m. to 10:59 a.m.
- 211:00 a.m. to 11:59 a.m.
- 812:00 p.m. to 3:59 p.m.
- 34:00 p.m. to 11:59 p.m.

Occupations of males:
- Percentage of males in management occupations (except farmers):
Here: 31.4% city: 21.8%
- Percentage of males in business and financial operations occupations:
Here: 8.4% city: 7.5%
- Percentage of males in computer and mathematical occupations:
Here: 3.4% city: 6.6%
- Percentage of males in architecture and engineering occupations:
Here: 3.6% city: 5.6%
- Percentage of males in education, training, and library occupations:
Here: 4.6% city: 3.1%
- Percentage of males in arts, design, entertainment, sports, and media occupations:
Here: 2.1% city: 2.4%
- Percentage of males in healthcare practitioners and technical occupations:
Here: 4.7% city: 2.6%
- Percentage of males in service occupations:
Here: 6.1% city: 12.3%
- Percentage of males in sales and office occupations:
Here: 17.2% city: 19.1%
- Percentage of males in farming, fishing, and forestry occupations:
Here: 1.9% city: 0.3%
- Percentage of males in construction, extraction, and maintenance occupations:
Here: 2.0% city: 4.4%
- Percentage of males in transportation occupations:
Here: 7.9% city: 2.5%
Occupations of females:
- Percentage of females in management occupations (except farmers):
Here: 8.3% city: 14.1%
- Percentage of females in business and financial operations occupations:
Here: 7.7% city: 9.2%
- Percentage of females in computer and mathematical occupations:
Here: 9.3% city: 2.8%
- Percentage of females in life, physical, and social science occupations:
Here: 2.1% city: 1.4%
- Percentage of females in education, training, and library occupations:
Here: 13.3% city: 9.7%
- Percentage of females in arts, design, entertainment, sports, and media occupations:
Here: 7.2% city: 2.4%
- Percentage of females in healthcare practitioners and technical occupations:
Here: 8.9% city: 8.1%
- Percentage of females in service occupations:
Here: 5.9% city: 15.1%
- Percentage of females in sales and office occupations:
Here: 33.0% city: 28.1%
- Percentage of females in production occupations:
Here: 2.3% city: 1.6%
- Percentage of females in material moving occupations:
Here: 1.6% city: 0.5%
Education in this neighborhood (subdivision or community):
- Percentage of people 3 years and older in K-12 schools:
Cortez: 14.1% Mission Viejo: 15.0%
- Percentage of people 3 years and older in undergraduate colleges:
Cortez: 5.0% Mission Viejo: 5.6%
- Percentage of people 3 years and older in grad. or professional schools:
Cortez: 2.8% Mission Viejo: 1.0%
- Percentage of students K-12 enrolled in private schools:
Cortez: 83.1% Mission Viejo: 22.1%
Percentage of population below poverty level:
| Cortez: | 3.7% |
| Mission Viejo: | 9.3% |
Median year owner moved in (as recorded in 2022):
Median year renter moved in (as recorded in 2022):
| Cortez: | 2002 |
| Mission Viejo: | 2008 |
Median year renter moved in (as recorded in 2022):
| Cortez: | 2017 |
| Mission Viejo: | 2019 |
Percentage of married-couple families with both working:
| Cortez: | 62.8% |
| Mission Viejo: | 78.0% |

- 80.4%Utility gas
- 10.7%Electricity
- 5.8%Bottled, tank, or LP gas
- 1.6%No fuel used
- 1.5%Solar energy
Roads and streets:
Felipe Rd
Length: 0.44 miles
Directions: N-S, SW-NE
Directions: N-S, SW-NE
Buscador
Length: 0.42 miles
Directions: E-W, N-S, SW-NE
Address range: 26100 to 26399
Directions: E-W, N-S, SW-NE
Address range: 26100 to 26399
Golada
Length: 0.34 miles
Directions: E-W, N-S, SW-NE
Address range: 26100 to 26399
Directions: E-W, N-S, SW-NE
Address range: 26100 to 26399
Barbadanes
Length: 0.23 miles
Directions: E-W, SE-NW
Directions: E-W, SE-NW
Capricho
Length: 0.22 miles
Directions: E-W, SE-NW, SW-NE
Address range: 27365 to 27599
Directions: E-W, SE-NW, SW-NE
Address range: 27365 to 27599
Ambia
Length: 0.16 miles
Directions: N-S, SE-NW, SW-NE
Address range: 26300 to 26499
Directions: N-S, SE-NW, SW-NE
Address range: 26300 to 26499
Celanova
Length: 0.08 miles
Directions: E-W, SE-NW, SW-NE
Address range: 27300 to 27399
Directions: E-W, SE-NW, SW-NE
Address range: 27300 to 27399