Cottonwood Village neighborhood in Santa Fe, New Mexico (NM), 87501 detailed profile
Settings
X

Business Search - 14 Million verified businesses
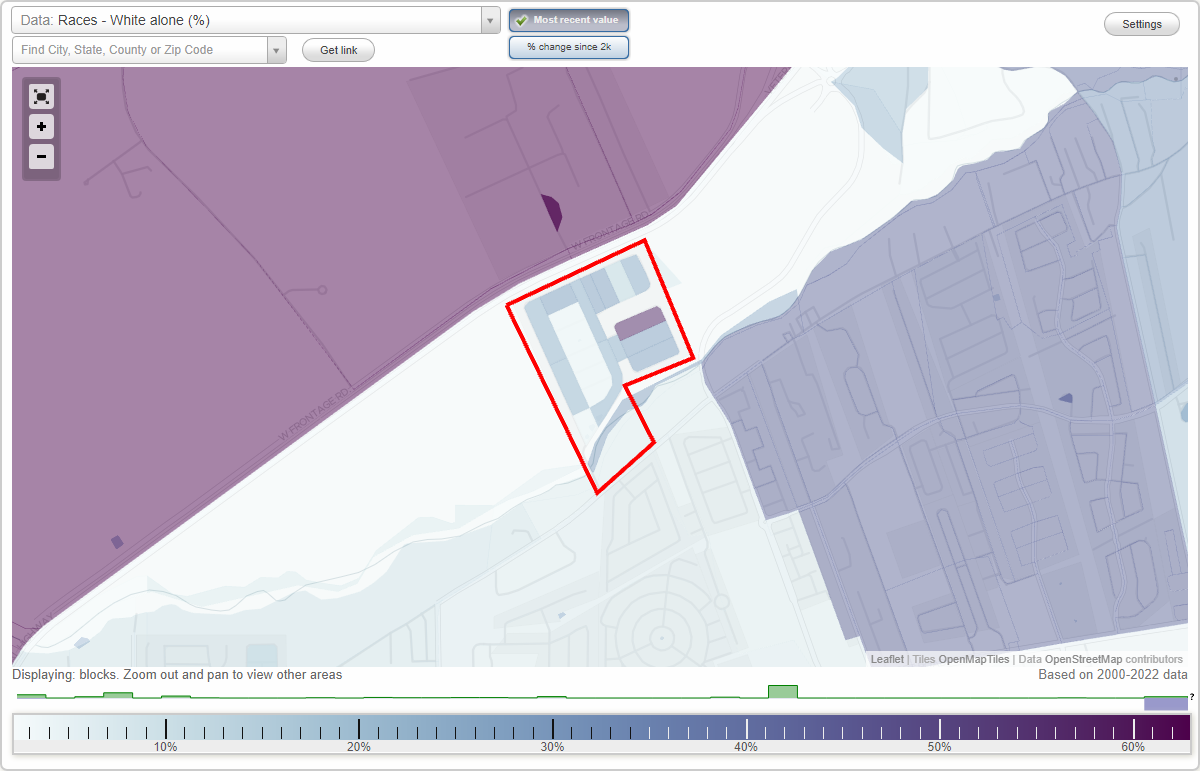
Area: 0.139 square miles
Population: 228
Population density:
| Cottonwood Village: | 1,644 people per square mile |
| Santa Fe: | 2,384 people per square mile |

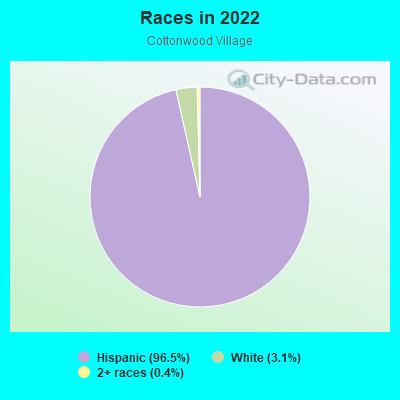
- 22096.5%Hispanic or Latino
- 73.1%White
- 10.4%Two or more races
Median household income in 2022:
| Cottonwood Village: | $43,750 |
| Santa Fe: | $68,793 |
Distribution of median household income
![Distribution of median household income]()
- 4Less than $10,000
- 2$10,000 to $19,999
- 8$20,000 to $29,999
- 14$30,000 to $39,999
- 7$40,000 to $49,999
- 1$50,000 to $59,999
- 2$60,000 to $74,999
- 18$75,000 to $99,999
- 3$100,000 to $124,999
- 5$125,000 to $149,999
- 3$150,000 to $199,999
- 3$200,000 or more

Distribution of owner-occupied house/condo value
![Distribution of owner-occupied house/condo value]()
- 32Less than $50,000
- 5$50,000 to $99,999
- 1$100,000 to $149,999
- 2$150,000 to $199,999
- 2$200,000 to $249,999
- 1$250,000 to $299,999
- 1$300,000 to $399,999
- 4$400,000 to $499,999
- 12$500,000 to $749,999
- 3$750,000 to $999,999

Distribution of rent paid by renters
![Distribution of rent paid by renters]()
- 3$300 to $399
- 1$600 to $699
- 13$700 to $799
- 1$800 to $899
- 6$900 to $999
- 1$1,000 to $1,249
- 1$1,500 to $1,999
- 1$2,000 or more

Median rent in 2022:
| Cottonwood Village: | $761 |
| Santa Fe: | $1,233 |
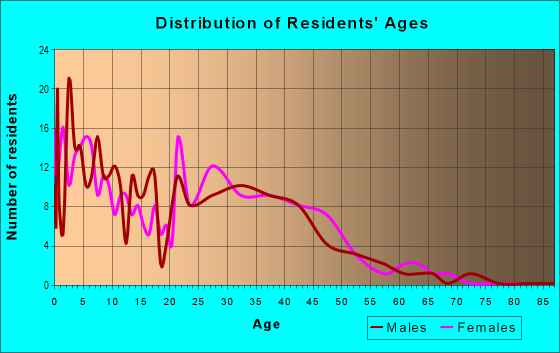
| Males: | 116 |
| Females: | 112 |
Males:
| This neighborhood: | 31.4 years |
| Whole city: | 43.9 years |
| This neighborhood: | 29.0 years |
| Whole city: | 47.5 years |
Average household size:
| Cottonwood Village: | 48.0 people |
| Santa Fe: | 21.0 people |
Percentage of family households:
| Cottonwood Village: | 57.6% |
| Santa Fe: | 34.0% |
| Here: | 53.4% |
| Santa Fe: | 32.0% |
Percentage of married-couple families with children (among all households):
| Cottonwood Village: | 12.8% |
| Santa Fe: | 23.8% |
Percentage of single-mother households (among all households):
| Cottonwood Village: | 10.0% |
| Santa Fe: | 19.5% |
Percentage of never married males 15 years old and over:
Percentage of never married females 15 years old and over:
| Cottonwood Village: | 33.9% |
| Santa Fe: | 17.9% |
Percentage of never married females 15 years old and over:
| Cottonwood Village: | 18.6% |
| city: | 18.9% |
Percentage of people that speak English not well or not at all:
| Cottonwood Village: | 25.9% |
| Santa Fe: | 5.1% |
Percentage of people born in this state:
Percentage of people born in another U.S. state:
Percentage of native residents but born outside the U.S.:
Percentage of foreign born residents:
| Here: | 49.9% |
| Santa Fe: | 45.1% |
Percentage of people born in another U.S. state:
| Cottonwood Village: | 27.2% |
| Santa Fe: | 37.8% |
Percentage of native residents but born outside the U.S.:
| Here: | 1.1% |
| city: | 1.6% |
Percentage of foreign born residents:
| Here: | 21.8% |
| Santa Fe: | 15.6% |
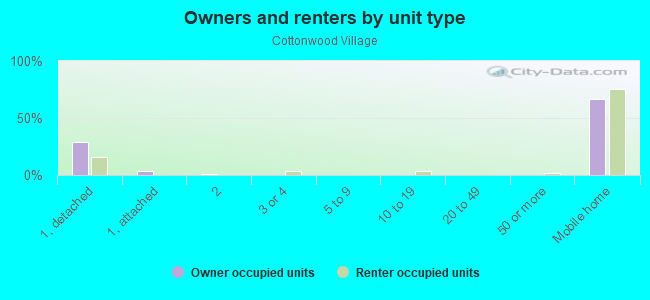
Owner-occupied
Renter-occupied

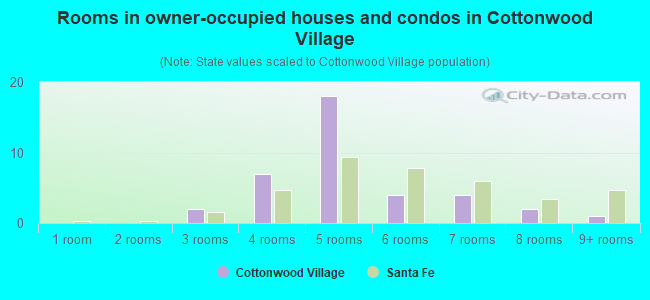
- Rooms in owner-occupied houses and condos in Cottonwood Village
- 01 room
- 02 rooms
- 23 rooms
- 74 rooms
- 185 rooms
- 46 rooms
- 47 rooms
- 28 rooms
- 19+ rooms
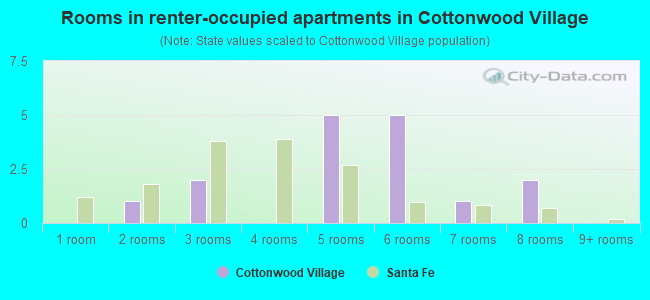
- Rooms in renter-occupied apartments in Cottonwood Village
- 01 room
- 12 rooms
- 23 rooms
- 04 rooms
- 55 rooms
- 56 rooms
- 17 rooms
- 28 rooms
- 09+ rooms
Owner-occupied
Renter-occupied
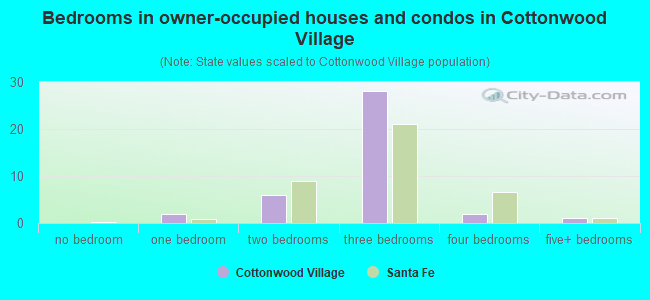
- Bedrooms in owner-occupied houses and condos in Cottonwood Village
- 0no bedroom
- 21 bedroom
- 62 bedrooms
- 283 bedrooms
- 24 bedrooms
- 15+ bedrooms
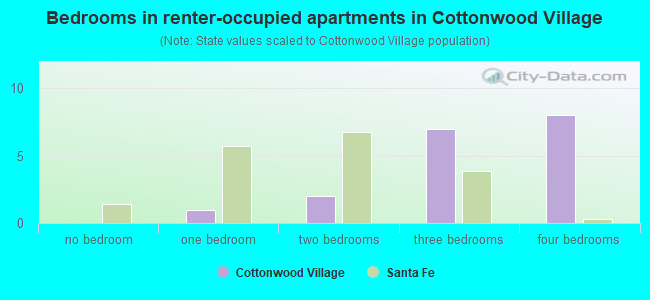
- Bedrooms in renter-occupied apartments in Cottonwood Village
- 0no bedroom
- 11 bedroom
- 22 bedrooms
- 73 bedrooms
- 84 bedrooms
- 05+ bedrooms
Average number of cars or other vehicles available in houses/condos:
Average number of cars or other vehicles available in apartments:
| This neighborhood: | 2.5 |
| Santa Fe: | 1.9 |
Average number of cars or other vehicles available in apartments:
| Here: | 2.1 |
| city: | 1.3 |
Percentage of units with a mortgage:
| Cottonwood Village: | 10.2% |
| Santa Fe: | 60.0% |
Average estimated value of mobile home in 2022 (100.0% of all units):
| Cottonwood Village: | $27,238 |
| Santa Fe: | $100,561 |
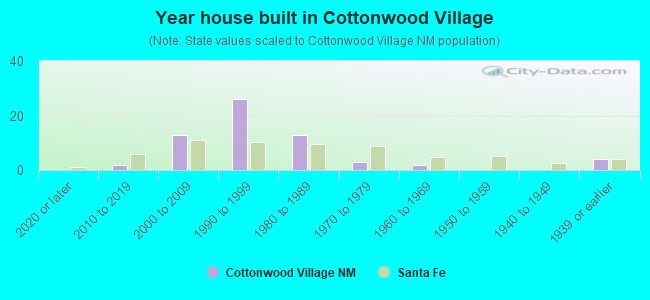
- Year house built in Cottonwood Village
- 02020 or later
- 22010 to 2019
- 132000 to 2009
- 261990 to 1999
- 131980 to 1989
- 31970 to 1979
- 21960 to 1969
- 01950 to 1959
- 01940 to 1949
- 41939 or earlier
City-data.com crime index for city in 2020 (higher means more crime):
| City: | 121.4 |
| U.S. average: | 219.5 |
Travel time to work (commute)
![Travel time to work (commute)]()
- 65 to 9 minutes
- 510 to 14 minutes
- 1415 to 19 minutes
- 1520 to 24 minutes
- 1030 to 34 minutes
- 240 to 44 minutes
- 545 to 59 minutes
- 260 to 89 minutes
- 290 or more minutes

Means of transportation to work
![Means of transportation to work]()
- 75.1%86Drove a car alone
- 21.8%25Carpooled
- 1.7%2Worked at home

Time leaving home to go to work
![Time leaving home to go to work]()
- 412:00 a.m. to 4:59 a.m.
- 46:00 a.m. to 6:29 a.m.
- 26:30 a.m. to 6:59 a.m.
- 177:00 a.m. to 7:29 a.m.
- 167:30 a.m. to 7:59 a.m.
- 108:00 a.m. to 8:29 a.m.
- 28:30 a.m. to 8:59 a.m.
- 39:00 a.m. to 9:59 a.m.
- 212:00 p.m. to 3:59 p.m.

Occupations of males:
- Percentage of males in management occupations (except farmers):
Here: 12.0% city: 11.8%
- Percentage of males in business and financial operations occupations:
Here: 2.6% city: 5.3%
- Percentage of males in computer and mathematical occupations:
Here: 2.9% city: 3.3%
- Percentage of males in architecture and engineering occupations:
Here: 1.5% city: 2.6%
- Percentage of males in life, physical, and social science occupations:
Here: 1.4% city: 4.3%
- Percentage of males in education, training, and library occupations:
Here: 2.2% city: 5.2%
- Percentage of males in arts, design, entertainment, sports, and media occupations:
Here: 2.5% city: 3.2%
- Percentage of males in healthcare practitioners and technical occupations:
Here: 5.5% city: 3.1%
- Percentage of males in service occupations:
Here: 51.7% city: 17.6%
- Percentage of males in sales and office occupations:
Here: 2.4% city: 12.1%
- Percentage of males in construction, extraction, and maintenance occupations:
Here: 11.6% city: 9.6%
- Percentage of males in production occupations:
Here: 1.3% city: 2.6%
- Percentage of males in material moving occupations:
Here: 6.4% city: 5.0%
Occupations of females:
- Percentage of females in management occupations (except farmers):
Here: 24.1% city: 10.4%
- Percentage of females in business and financial operations occupations:
Here: 6.6% city: 6.1%
- Percentage of females in computer and mathematical occupations:
Here: 2.1% city: 1.5%
- Percentage of females in life, physical, and social science occupations:
Here: 1.2% city: 2.3%
- Percentage of females in education, training, and library occupations:
Here: 11.3% city: 9.7%
- Percentage of females in arts, design, entertainment, sports, and media occupations:
Here: 2.9% city: 4.4%
- Percentage of females in healthcare practitioners and technical occupations:
Here: 8.6% city: 7.0%
- Percentage of females in service occupations:
Here: 24.7% city: 24.6%
- Percentage of females in sales and office occupations:
Here: 24.4% city: 24.6%
- Percentage of females in farming, fishing, and forestry occupations:
Here: 5.5% city: 0.0%
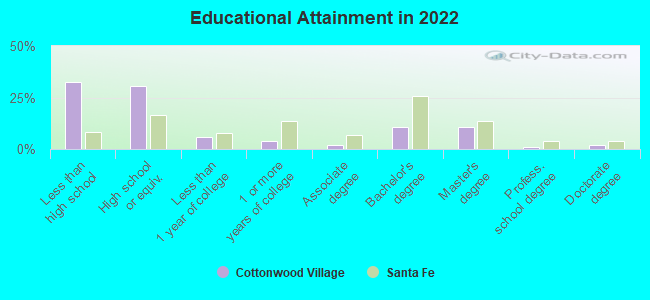
Education in this neighborhood (subdivision or community):
- Percentage of people 3 years and older in K-12 schools:
Cottonwood Village: 17.3% Santa Fe: 12.3%
- Percentage of people 3 years and older in undergraduate colleges:
Cottonwood Village: 0.9% Santa Fe: 4.5%
- Percentage of people 3 years and older in grad. or professional schools:
Cottonwood Village: 0.0% Santa Fe: 1.6%
- Percentage of students K-12 enrolled in private schools:
Cottonwood Village: 0.0% Santa Fe: 11.0%
Percentage of population below poverty level:
| Cottonwood Village: | 25.9% |
| Santa Fe: | 13.5% |
Median year owner moved in (as recorded in 2022):
Median year renter moved in (as recorded in 2022):
| Cottonwood Village: | 2012 |
| Santa Fe: | 2011 |
Median year renter moved in (as recorded in 2022):
| Cottonwood Village: | 2000 |
| Santa Fe: | 2020 |
Percentage of married-couple families with both working:
| Cottonwood Village: | 15.3% |
| Santa Fe: | 75.7% |
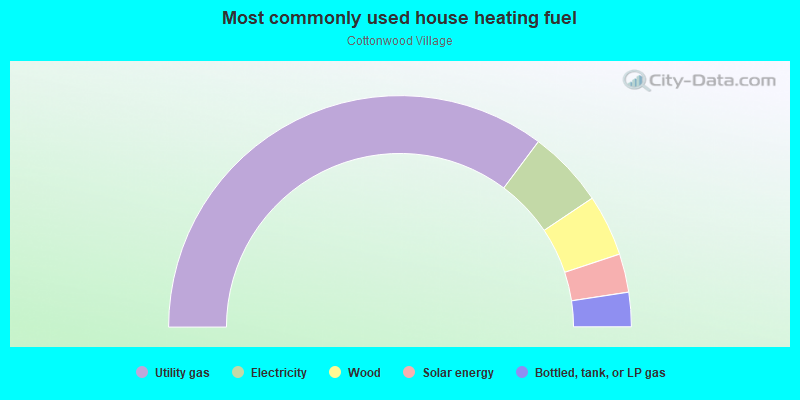
- 70.5%Utility gas
- 10.8%Electricity
- 8.6%Wood
- 5.4%Solar energy
- 4.8%Bottled, tank, or LP gas
Roads and streets:
Sycamore Loop
Length: 1.00 miles
Directions: E-W, N-S, SE-NW, SW-NE
Address range: 2400 to 2899
Directions: E-W, N-S, SE-NW, SW-NE
Address range: 2400 to 2899
Aspen Loop
Length: 0.57 miles
Directions: E-W, N-S, SE-NW, SW-NE
Address range: 2700 to 2899
Directions: E-W, N-S, SE-NW, SW-NE
Address range: 2700 to 2899
Cottonwood Dr
Length: 0.52 miles
Directions: N-S, SE-NW, SW-NE
Directions: N-S, SE-NW, SW-NE
Walnut St
Length: 0.42 miles
Directions: E-W, N-S, SE-NW, SW-NE
Address range: 2500 to 2799
Directions: E-W, N-S, SE-NW, SW-NE
Address range: 2500 to 2799
Ash St
Length: 0.36 miles
Direction: SE-NW
Address range: 2600 to 2899
Direction: SE-NW
Address range: 2600 to 2899
Cypress St
Length: 0.18 miles
Directions: E-W, SW-NE
Address range: 6400 to 6499
Directions: E-W, SW-NE
Address range: 6400 to 6499
Olive St
Length: 0.17 miles
Directions: E-W, SW-NE
Address range: 6300 to 6399
Directions: E-W, SW-NE
Address range: 6300 to 6399
Maple St
Length: 0.14 miles
Direction: E-W
Address range: 6300 to 6399
Direction: E-W
Address range: 6300 to 6399
Birch St
Length: 0.10 miles
Direction: SE-NW
Address range: 2600 to 2699
Direction: SE-NW
Address range: 2600 to 2699
Rosewood St
Length: 0.10 miles
Direction: SE-NW
Address range: 2600 to 2699
Direction: SE-NW
Address range: 2600 to 2699
Redwood St
Length: 0.10 miles
Direction: SE-NW
Address range: 2600 to 2699
Direction: SE-NW
Address range: 2600 to 2699
Locust St
Length: 0.10 miles
Direction: E-W
Address range: 6400 to 6499
Direction: E-W
Address range: 6400 to 6499
Hickory St
Length: 0.10 miles
Direction: E-W
Address range: 6400 to 6499
Direction: E-W
Address range: 6400 to 6499
Poplar St
Length: 0.09 miles
Direction: E-W
Address range: 6400 to 6499
Direction: E-W
Address range: 6400 to 6499
Elm St
Length: 0.09 miles
Direction: E-W
Address range: 6400 to 6499
Direction: E-W
Address range: 6400 to 6499