Countryside neighborhood in Lanexa, Virginia (VA), 23089 detailed profile
Settings
X


Area: 0.089 square miles
Population: 11,639
Population density: 130,610 people per square mile

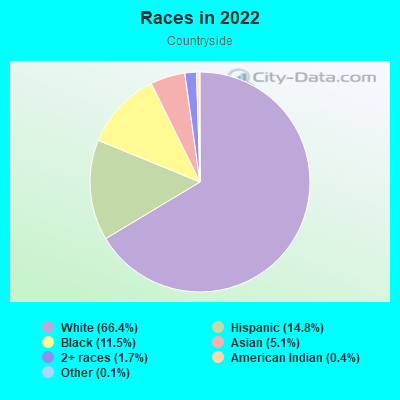
- 7,80466.4%White
- 1,74014.8%Hispanic or Latino
- 1,34811.5%Black
- 5965.1%Asian
- 2031.7%Two or more races
- 450.4%American Indian
- 120.1%Some other race
Median household income in 2022:
| Countryside: | $185,259 |
| Virginia: | $85,873 |
Distribution of median household income
![Distribution of median household income]()
- 36Less than $10,000
- 75$10,000 to $19,999
- 164$20,000 to $29,999
- 40$30,000 to $39,999
- 2,128$40,000 to $49,999
- 55$50,000 to $59,999
- 187$60,000 to $74,999
- 276$75,000 to $99,999
- 601$100,000 to $124,999
- 275$125,000 to $149,999
- 825$150,000 to $199,999
- 1,508$200,000 or more

Distribution of owner-occupied house/condo value
![Distribution of owner-occupied house/condo value]()
- 9Less than $50,000
- 13$50,000 to $99,999
- 149$100,000 to $149,999
- 74$200,000 to $249,999
- 31$250,000 to $299,999
- 554$300,000 to $399,999
- 754$400,000 to $499,999
- 1,617$500,000 to $749,999
- 350$750,000 to $999,999
- 222$1,000,000 or more

Distribution of rent paid by renters
![Distribution of rent paid by renters]()
- 26$500 to $599
- 18$700 to $799
- 21$900 to $999
- 43$1,250 to $1,499
- 377$1,500 to $1,999
- 833$2,000 or more

| Males: | 5,847 |
| Females: | 5,791 |
| Males: | 38.1 years |
| Females: | 36.7 years |
Average household size:
| Countryside: | 3.1 people |
| Virginia: | 2.5 people |
Percentage of family households:
| Countryside: | 64.4% |
| Virginia: | 45.8% |
| Here: | 65.4% |
| Virginia: | 48.6% |
Percentage of married-couple families with children (among all households):
| Countryside: | 27.0% |
| Virginia: | 54.3% |
Percentage of single-mother households (among all households):
| Countryside: | 3.9% |
| Virginia: | 8.2% |
Percentage of never married males 15 years old and over:
Percentage of never married females 15 years old and over:
| Countryside: | 15.5% |
| Virginia: | 17.6% |
Percentage of never married females 15 years old and over:
| Countryside: | 12.1% |
| Virginia: | 15.6% |
Percentage of people that speak English not well or not at all:
| Countryside: | 4.4% |
| Virginia: | 2.6% |
Percentage of people born in this state:
Percentage of people born in another U.S. state:
Percentage of native residents but born outside the U.S.:
Percentage of foreign born residents:
| Here: | 33.0% |
| Virginia: | 48.7% |
Percentage of people born in another U.S. state:
| Countryside: | 44.0% |
| Virginia: | 36.4% |
Percentage of native residents but born outside the U.S.:
| Here: | 1.8% |
| Virginia: | 2.1% |
Percentage of foreign born residents:
| Here: | 21.2% |
| Virginia: | 12.7% |

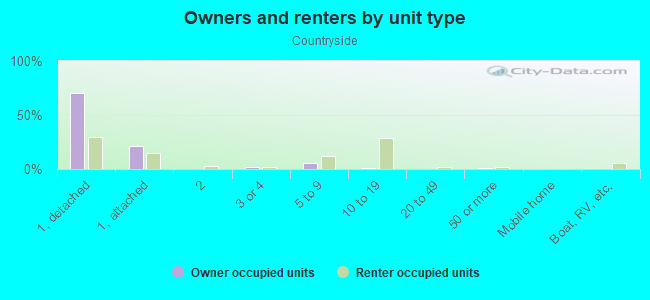
Owner-occupied
Renter-occupied

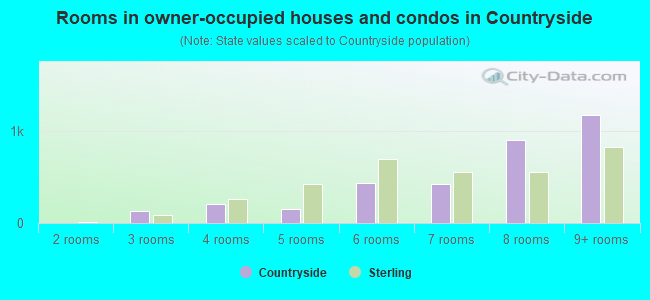
- Rooms in owner-occupied houses and condos in Countryside
- 01 room
- 02 rooms
- 1293 rooms
- 2024 rooms
- 1485 rooms
- 4316 rooms
- 4247 rooms
- 8978 rooms
- 1,1749+ rooms
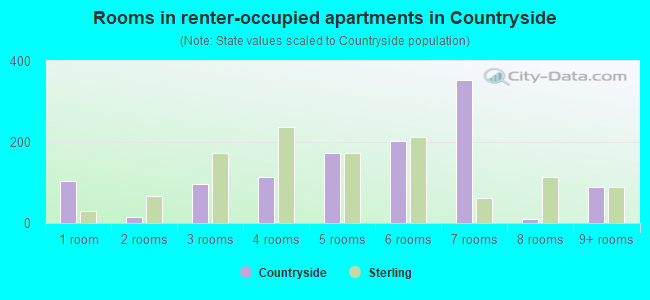
- Rooms in renter-occupied apartments in Countryside
- 1031 room
- 142 rooms
- 973 rooms
- 1144 rooms
- 1745 rooms
- 2026 rooms
- 3537 rooms
- 108 rooms
- 889+ rooms
Owner-occupied
Renter-occupied
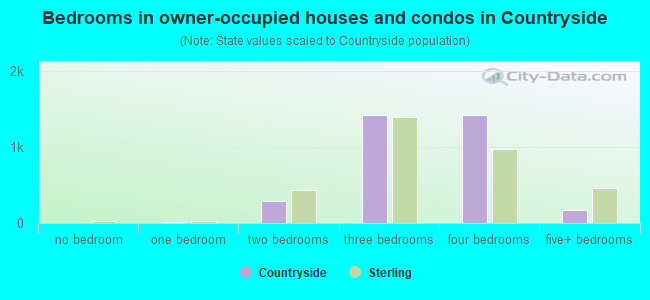
- Bedrooms in owner-occupied houses and condos in Countryside
- 0no bedroom
- 131 bedroom
- 2872 bedrooms
- 1,4193 bedrooms
- 1,4244 bedrooms
- 1755+ bedrooms
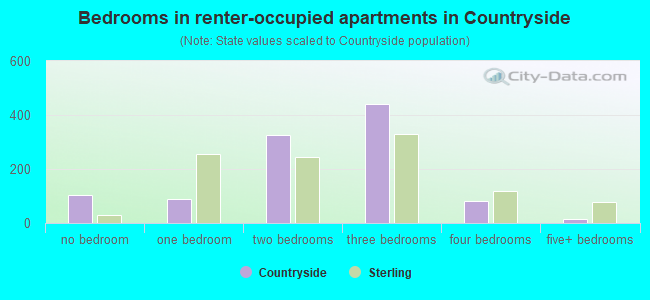
- Bedrooms in renter-occupied apartments in Countryside
- 103no bedroom
- 881 bedroom
- 3262 bedrooms
- 4423 bedrooms
- 814 bedrooms
- 165+ bedrooms
Average number of cars or other vehicles available in houses/condos:
Average number of cars or other vehicles available in apartments:
| This neighborhood: | 2.2 |
| Virginia: | 2.2 |
Average number of cars or other vehicles available in apartments:
| Here: | 1.8 |
| Virginia: | 1.4 |
Percentage of units with a mortgage:
| Countryside: | 79.1% |
| Virginia: | 66.9% |
Housing prices:
- Average estimated value of detached houses in 2022 (70.3% of all units):
Countryside: $707,185 Virginia: $472,865
- Average estimated value of townhouses or other attached units in 2022 (22.4% of all units):
This neighborhood: $398,937 Virginia: $457,437
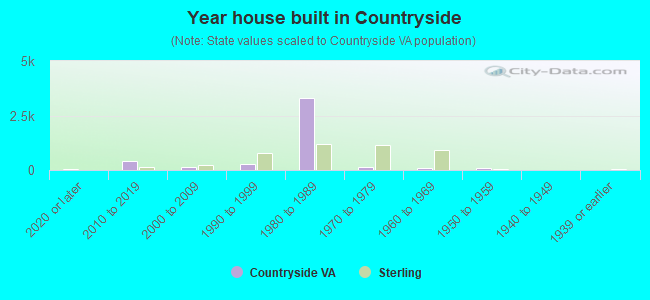
- Year house built in Countryside
- 402020 or later
- 4022010 to 2019
- 1232000 to 2009
- 2921990 to 1999
- 3,3001980 to 1989
- 1571970 to 1979
- 871960 to 1969
- 1001950 to 1959
- 191940 to 1949
- 141939 or earlier
Travel time to work (commute)
![Travel time to work (commute)]()
- 174Less than 5 minutes
- 4365 to 9 minutes
- 74710 to 14 minutes
- 49515 to 19 minutes
- 44420 to 24 minutes
- 38425 to 29 minutes
- 49930 to 34 minutes
- 15735 to 39 minutes
- 22440 to 44 minutes
- 52145 to 59 minutes
- 51260 to 89 minutes
- 6990 or more minutes

Means of transportation to work
![Means of transportation to work]()
- 76.0%4,885Drove a car alone
- 2.7%172Carpooled
- 1.4%87Bus
- 2.8%183Subway or elevated rail
- 0.3%20Taxi
- 1.5%98Motorcycle
- 8.3%532Walked
- 0.2%15Other means
- 18.3%1,178Worked at home

Time leaving home to go to work
![Time leaving home to go to work]()
- 15212:00 a.m. to 4:59 a.m.
- 1795:00 a.m. to 5:29 a.m.
- 2935:30 a.m. to 5:59 a.m.
- 2616:00 a.m. to 6:29 a.m.
- 3036:30 a.m. to 6:59 a.m.
- 4127:00 a.m. to 7:29 a.m.
- 5267:30 a.m. to 7:59 a.m.
- 9698:00 a.m. to 8:29 a.m.
- 6138:30 a.m. to 8:59 a.m.
- 2459:00 a.m. to 9:59 a.m.
- 18110:00 a.m. to 10:59 a.m.
- 6411:00 a.m. to 11:59 a.m.
- 18812:00 p.m. to 3:59 p.m.
- 1774:00 p.m. to 11:59 p.m.

Occupations of males:
- Percentage of males in management occupations (except farmers):
Here: 13.7% Virginia: 13.4%
- Percentage of males in business and financial operations occupations:
Here: 18.6% Virginia: 6.5%
- Percentage of males in computer and mathematical occupations:
Here: 15.4% Virginia: 8.6%
- Percentage of males in architecture and engineering occupations:
Here: 7.9% Virginia: 3.7%
- Percentage of males in life, physical, and social science occupations:
Here: 1.6% Virginia: 1.3%
- Percentage of males in education, training, and library occupations:
Here: 2.7% Virginia: 3.3%
- Percentage of males in healthcare practitioners and technical occupations:
Here: 2.5% Virginia: 2.4%
- Percentage of males in service occupations:
Here: 14.1% Virginia: 13.3%
- Percentage of males in sales and office occupations:
Here: 10.1% Virginia: 13.4%
- Percentage of males in construction, extraction, and maintenance occupations:
Here: 2.5% Virginia: 8.2%
- Percentage of males in production occupations:
Here: 3.2% Virginia: 5.5%
- Percentage of males in transportation occupations:
Here: 4.8% Virginia: 5.5%
Occupations of females:
- Percentage of females in management occupations (except farmers):
Here: 11.7% Virginia: 10.8%
- Percentage of females in business and financial operations occupations:
Here: 11.9% Virginia: 8.3%
- Percentage of females in computer and mathematical occupations:
Here: 9.4% Virginia: 3.6%
- Percentage of females in architecture and engineering occupations:
Here: 1.5% Virginia: 0.8%
- Percentage of females in life, physical, and social science occupations:
Here: 1.5% Virginia: 1.3%
- Percentage of females in legal occupations:
Here: 2.9% Virginia: 1.6%
- Percentage of females in education, training, and library occupations:
Here: 20.3% Virginia: 10.1%
- Percentage of females in arts, design, entertainment, sports, and media occupations:
Here: 3.4% Virginia: 2.2%
- Percentage of females in healthcare practitioners and technical occupations:
Here: 8.7% Virginia: 9.1%
- Percentage of females in service occupations:
Here: 12.4% Virginia: 18.5%
- Percentage of females in sales and office occupations:
Here: 15.5% Virginia: 24.7%
Percentage of people 16-64 in Armed Forces:
| Countryside: | 0.0% |
| Virginia: | 2.5% |
Education in this neighborhood (subdivision or community):
- Percentage of people 3 years and older in K-12 schools:
Countryside: 28.6% Virginia: 16.3%
- Percentage of people 3 years and older in undergraduate colleges:
Countryside: 4.5% Virginia: 5.4%
- Percentage of people 3 years and older in grad. or professional schools:
Countryside: 2.7% Virginia: 1.8%
- Percentage of students K-12 enrolled in private schools:
Countryside: 45.9% Virginia: 12.5%
Percentage of population below poverty level:
| Countryside: | 1.9% |
| Virginia: | 10.6% |
Median year owner moved in (as recorded in 2022):
| Countryside: | 2068 |
| Virginia: | 2011 |
Percentage of married-couple families with both working:
| Countryside: | 96.7% |
| Virginia: | 73.3% |
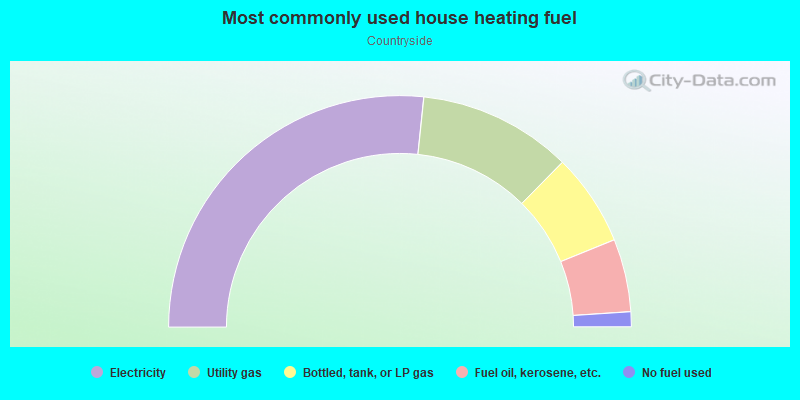
- 53.3%Electricity
- 21.5%Utility gas
- 12.9%Bottled, tank, or LP gas
- 10.2%Fuel oil, kerosene, etc.
- 2.1%No fuel used