Cross Creek neighborhood in Urbandale, Iowa (IA), 50322 detailed profile
Settings
X


Business Search - 14 Million verified businesses
Area: 0.160 square miles
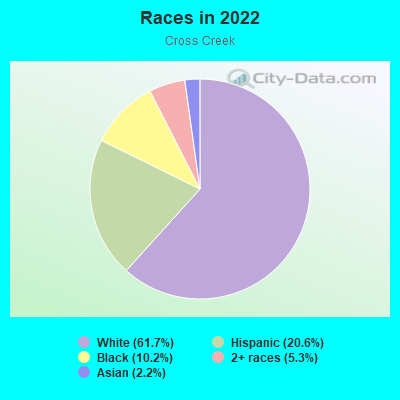
Population: 1,013
Population density:
| Cross Creek: | 6,347 people per square mile |
| Urbandale: | 2,203 people per square mile |

- 62361.7%White
- 20820.6%Hispanic or Latino
- 10310.2%Black
- 535.3%Two or more races
- 222.2%Asian
Median household income in 2022:
| Cross Creek: | $61,429 |
| Urbandale: | $111,888 |
Distribution of median household income
![Distribution of median household income]()
- 33Less than $10,000
- 66$10,000 to $19,999
- 6$20,000 to $29,999
- 15$30,000 to $39,999
- 73$40,000 to $49,999
- 11$50,000 to $59,999
- 67$60,000 to $74,999
- 32$75,000 to $99,999
- 46$100,000 to $124,999
- 36$125,000 to $149,999
- 21$150,000 to $199,999
- 15$200,000 or more

Distribution of owner-occupied house/condo value
![Distribution of owner-occupied house/condo value]()
- 3Less than $50,000
- 27$100,000 to $149,999
- 33$150,000 to $199,999
- 100$200,000 to $249,999
- 7$250,000 to $299,999
- 42$300,000 to $399,999
- 5$400,000 to $499,999
- 3$500,000 to $749,999

Distribution of rent paid by renters
![Distribution of rent paid by renters]()
- 10$200 to $299
- 9$700 to $799
- 69$800 to $899
- 52$900 to $999
- 48$1,000 to $1,249
- 28$1,500 to $1,999
- 6$2,000 or more

Median rent in 2022:
| Cross Creek: | $939 |
| Urbandale: | $971 |
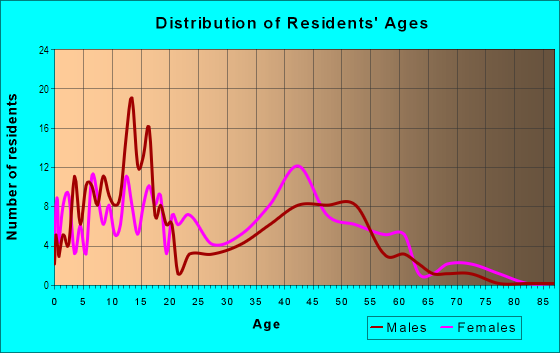
| Males: | 509 |
| Females: | 504 |
Males:
| This neighborhood: | 34.8 years |
| Whole city: | 38.2 years |
| This neighborhood: | 44.2 years |
| Whole city: | 39.6 years |
Average household size:
| Cross Creek: | 2.5 people |
| Urbandale: | 2.6 people |
Percentage of family households:
| Cross Creek: | 48.0% |
| Urbandale: | 57.0% |
| Here: | 33.2% |
| Urbandale: | 60.5% |
Percentage of married-couple families with children (among all households):
| Cross Creek: | 22.9% |
| Urbandale: | 31.4% |
Percentage of single-mother households (among all households):
| Cross Creek: | 11.9% |
| Urbandale: | 4.6% |
Percentage of never married males 15 years old and over:
Percentage of never married females 15 years old and over:
| Cross Creek: | 16.4% |
| Urbandale: | 14.6% |
Percentage of never married females 15 years old and over:
| Cross Creek: | 16.4% |
| city: | 12.0% |
Percentage of people born in this state:
Percentage of people born in another U.S. state:
Percentage of native residents but born outside the U.S.:
Percentage of foreign born residents:
| Here: | 60.4% |
| Urbandale: | 66.9% |
Percentage of people born in another U.S. state:
| Cross Creek: | 27.4% |
| Urbandale: | 23.1% |
Percentage of native residents but born outside the U.S.:
| Here: | 1.0% |
| city: | 0.7% |
Percentage of foreign born residents:
| Here: | 11.2% |
| Urbandale: | 9.3% |

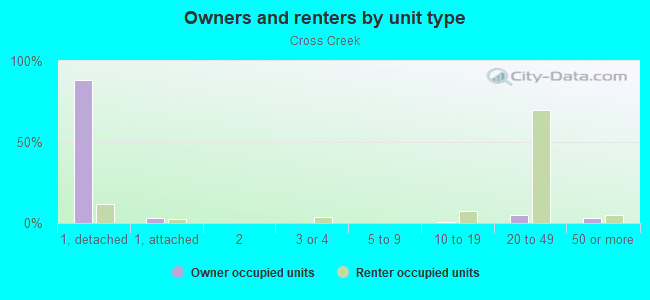
Owner-occupied
Renter-occupied

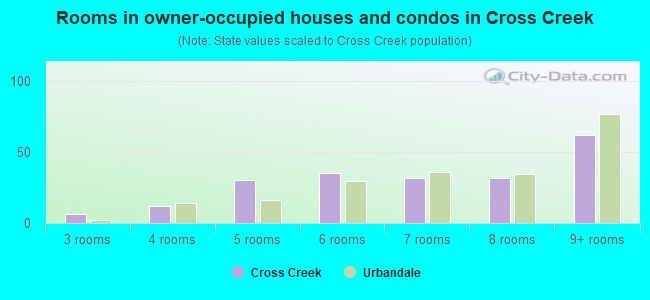
- Rooms in owner-occupied houses and condos in Cross Creek
- 01 room
- 02 rooms
- 63 rooms
- 124 rooms
- 305 rooms
- 356 rooms
- 327 rooms
- 328 rooms
- 629+ rooms
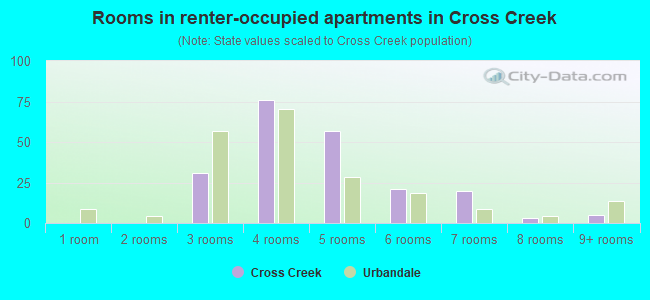
- Rooms in renter-occupied apartments in Cross Creek
- 01 room
- 02 rooms
- 313 rooms
- 764 rooms
- 575 rooms
- 216 rooms
- 207 rooms
- 38 rooms
- 59+ rooms
Owner-occupied
Renter-occupied
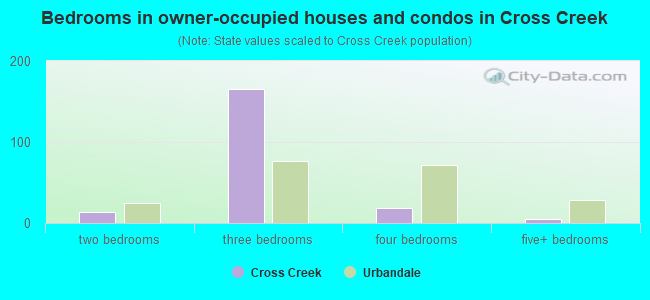
- Bedrooms in owner-occupied houses and condos in Cross Creek
- 0no bedroom
- 01 bedroom
- 132 bedrooms
- 1663 bedrooms
- 194 bedrooms
- 55+ bedrooms
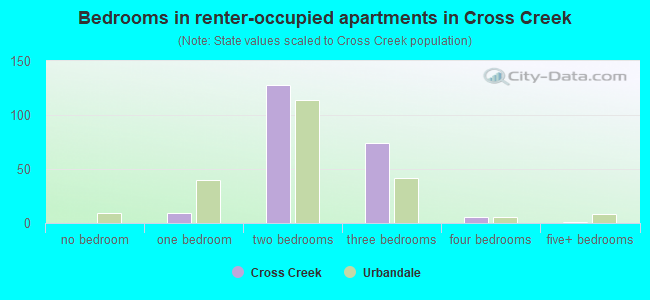
- Bedrooms in renter-occupied apartments in Cross Creek
- 0no bedroom
- 91 bedroom
- 1282 bedrooms
- 743 bedrooms
- 64 bedrooms
- 15+ bedrooms
Average number of cars or other vehicles available in houses/condos:
Average number of cars or other vehicles available in apartments:
| This neighborhood: | 2.0 |
| Urbandale: | 2.2 |
Average number of cars or other vehicles available in apartments:
| Here: | 1.7 |
| city: | 1.6 |
Percentage of units with a mortgage:
| Cross Creek: | 47.5% |
| Urbandale: | 68.3% |
Housing prices:
- Average estimated value of detached houses in 2022 (47.3% of all units):
Cross Creek: $277,599 Urbandale: $370,534
- Average estimated value of townhouses or other attached units in 2022 (1.3% of all units):
This neighborhood: $199,479 city: $219,740
- Average estimated '22 value of housing units in 5-or-more-unit structures (4.0% of all units):
Cross Creek: $181,896 Urbandale: $129,730
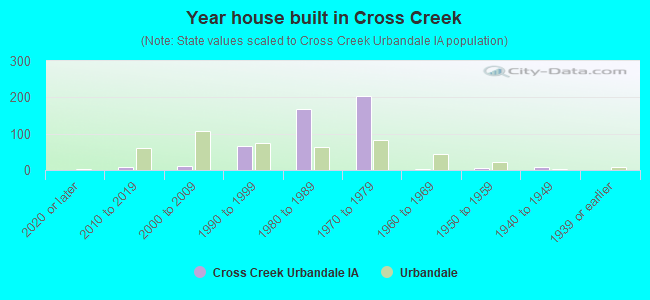
- Year house built in Cross Creek
- 02020 or later
- 72010 to 2019
- 102000 to 2009
- 651990 to 1999
- 1671980 to 1989
- 2041970 to 1979
- 31960 to 1969
- 61950 to 1959
- 81940 to 1949
- 01939 or earlier
City-data.com crime index for city in 2020 (higher means more crime):
| City: | 86.9 |
| U.S. average: | 219.5 |
Travel time to work (commute)
![Travel time to work (commute)]()
- 3Less than 5 minutes
- 445 to 9 minutes
- 4910 to 14 minutes
- 7915 to 19 minutes
- 7620 to 24 minutes
- 1225 to 29 minutes
- 4930 to 34 minutes
- 735 to 39 minutes
- 440 to 44 minutes
- 545 to 59 minutes
- 160 to 89 minutes

Means of transportation to work
![Means of transportation to work]()
- 88.2%428Drove a car alone
- 8.4%41Carpooled
- 0.4%2Bus
- 1.9%9Taxi
- 1.0%5Walked
- 0.2%1Other means
- 6.4%31Worked at home

Time leaving home to go to work
![Time leaving home to go to work]()
- 2512:00 a.m. to 4:59 a.m.
- 25:00 a.m. to 5:29 a.m.
- 75:30 a.m. to 5:59 a.m.
- 126:00 a.m. to 6:29 a.m.
- 426:30 a.m. to 6:59 a.m.
- 417:00 a.m. to 7:29 a.m.
- 667:30 a.m. to 7:59 a.m.
- 538:00 a.m. to 8:29 a.m.
- 158:30 a.m. to 8:59 a.m.
- 209:00 a.m. to 9:59 a.m.
- 610:00 a.m. to 10:59 a.m.
- 111:00 a.m. to 11:59 a.m.
- 2412:00 p.m. to 3:59 p.m.
- 144:00 p.m. to 11:59 p.m.

Occupations of males:
- Percentage of males in management occupations (except farmers):
Here: 5.5% city: 15.7%
- Percentage of males in business and financial operations occupations:
Here: 3.3% city: 11.2%
- Percentage of males in computer and mathematical occupations:
Here: 8.8% city: 8.8%
- Percentage of males in architecture and engineering occupations:
Here: 2.7% city: 2.6%
- Percentage of males in life, physical, and social science occupations:
Here: 12.1% city: 2.1%
- Percentage of males in legal occupations:
Here: 1.0% city: 2.3%
- Percentage of males in education, training, and library occupations:
Here: 3.8% city: 3.1%
- Percentage of males in healthcare practitioners and technical occupations:
Here: 5.1% city: 2.7%
- Percentage of males in service occupations:
Here: 19.9% city: 7.9%
- Percentage of males in sales and office occupations:
Here: 13.6% city: 18.5%
- Percentage of males in construction, extraction, and maintenance occupations:
Here: 9.6% city: 3.6%
- Percentage of males in production occupations:
Here: 3.3% city: 4.3%
- Percentage of males in transportation occupations:
Here: 14.7% city: 6.5%
- Percentage of males in material moving occupations:
Here: 4.8% city: 4.1%
Occupations of females:
- Percentage of females in management occupations (except farmers):
Here: 10.0% city: 11.9%
- Percentage of females in business and financial operations occupations:
Here: 2.3% city: 11.8%
- Percentage of females in computer and mathematical occupations:
Here: 1.2% city: 2.3%
- Percentage of females in community and social services occupations:
Here: 1.6% city: 2.7%
- Percentage of females in legal occupations:
Here: 1.8% city: 3.0%
- Percentage of females in education, training, and library occupations:
Here: 19.2% city: 9.7%
- Percentage of females in healthcare practitioners and technical occupations:
Here: 3.1% city: 10.0%
- Percentage of females in service occupations:
Here: 30.4% city: 15.1%
- Percentage of females in sales and office occupations:
Here: 32.3% city: 26.7%
- Percentage of females in production occupations:
Here: 2.7% city: 1.0%
Education in this neighborhood (subdivision or community):
- Percentage of people 3 years and older in K-12 schools:
Cross Creek: 16.1% Urbandale: 20.1%
- Percentage of people 3 years and older in undergraduate colleges:
Cross Creek: 1.7% Urbandale: 3.1%
- Percentage of people 3 years and older in grad. or professional schools:
Cross Creek: 2.6% Urbandale: 1.2%
- Percentage of students K-12 enrolled in private schools:
Cross Creek: 8.0% Urbandale: 11.6%
Percentage of population below poverty level:
| Cross Creek: | 8.0% |
| Urbandale: | 5.5% |
Median year owner moved in (as recorded in 2022):
Median year renter moved in (as recorded in 2022):
| Cross Creek: | 1998 |
| Urbandale: | 2010 |
Median year renter moved in (as recorded in 2022):
| Cross Creek: | 2019 |
| Urbandale: | 2018 |
Percentage of married-couple families with both working:
| Cross Creek: | 77.7% |
| Urbandale: | 83.2% |
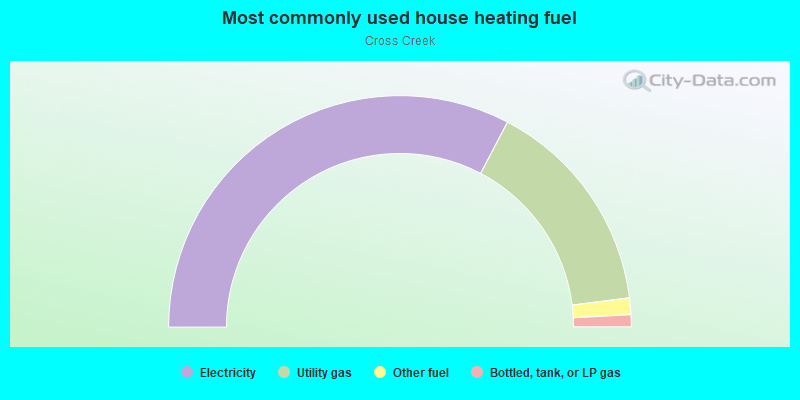
- 65.4%Electricity
- 30.6%Utility gas
- 2.3%Other fuel
- 1.7%Bottled, tank, or LP gas
Roads and streets:
Iltis Dr
Length: 0.62 miles
Directions: E-W, N-S, SW-NE
Address range: 8600 to 9199
Directions: E-W, N-S, SW-NE
Address range: 8600 to 9199
91st St
Length: 0.28 miles
Directions: E-W, N-S, SE-NW
Address range: 4400 to 4561
Directions: E-W, N-S, SE-NW
Address range: 4400 to 4561
Tanglewood Dr
Length: 0.22 miles
Directions: E-W, SW-NE
Address range: 9100 to 9199
Directions: E-W, SW-NE
Address range: 9100 to 9199
92nd St
Length: 0.20 miles
Directions: E-W, N-S, SE-NW
Address range: 4300 to 4439
Directions: E-W, N-S, SE-NW
Address range: 4300 to 4439
Alpine Dr
Length: 0.19 miles
Directions: E-W, SW-NE
Address range: 9100 to 9199
Directions: E-W, SW-NE
Address range: 9100 to 9199
Hammontree Dr
Length: 0.19 miles
Directions: E-W, N-S, SW-NE
Address range: 9000 to 9125
Directions: E-W, N-S, SW-NE
Address range: 9000 to 9125
Townsend Ave
Length: 0.17 miles
Directions: E-W, SW-NE
Address range: 8800 to 9079
Directions: E-W, SW-NE
Address range: 8800 to 9079
92nd Ct
Length: 0.12 miles
Direction: N-S
Address range: 4200 to 4599
Direction: N-S
Address range: 4200 to 4599
88th St
Length: 0.10 miles
Direction: N-S
Address range: 4468 to 4499
Direction: N-S
Address range: 4468 to 4499
89th St
Length: 0.09 miles
Direction: SE-NW
Address range: 4400 to 4499
Direction: SE-NW
Address range: 4400 to 4499
Aurora Ave
Length: 0.09 miles
Direction: E-W
Address range: 9230 to 9245
Direction: E-W
Address range: 9230 to 9245
Greenbelt Dr
Length: 0.09 miles
Direction: E-W
Address range: 9100 to 9199
Direction: E-W
Address range: 9100 to 9199
90th St
Length: 0.04 miles
Directions: N-S, SE-NW
Address range: 4400 to 4499
Directions: N-S, SE-NW
Address range: 4400 to 4499
88th Ct
Length: 0.03 miles
Directions: N-S, SE-NW
Address range: 4500 to 4599
Directions: N-S, SE-NW
Address range: 4500 to 4599