Daley Park neighborhood in Tempe, Arizona (AZ), 85281 detailed profile
Settings
X


Business Search - 14 Million verified businesses
Area: 0.120 square miles
Population: 510
Population density:
| Daley Park: | 4,236 people per square mile |
| Tempe: | 4,641 people per square mile |

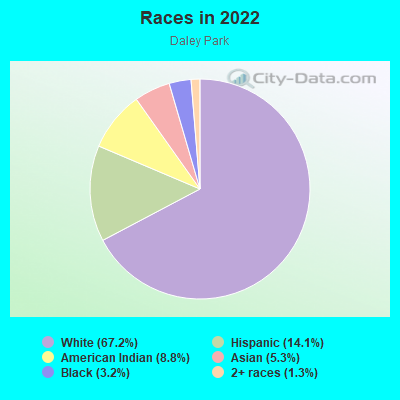
- 35267.2%White
- 7414.1%Hispanic or Latino
- 468.8%American Indian
- 285.3%Asian
- 173.2%Black
- 71.3%Two or more races
Median household income in 2022:
| Daley Park: | $141,278 |
| Tempe: | $76,007 |
Distribution of median household income
![Distribution of median household income]()
- 17Less than $10,000
- 10$10,000 to $19,999
- 10$20,000 to $29,999
- 12$30,000 to $39,999
- 13$40,000 to $49,999
- 12$50,000 to $59,999
- 6$60,000 to $74,999
- 6$75,000 to $99,999
- 15$100,000 to $124,999
- 38$125,000 to $149,999
- 47$150,000 to $199,999
- 30$200,000 or more

Distribution of owner-occupied house/condo value
![Distribution of owner-occupied house/condo value]()
- 4$50,000 to $99,999
- 2$100,000 to $149,999
- 2$150,000 to $199,999
- 6$200,000 to $249,999
- 2$250,000 to $299,999
- 29$300,000 to $399,999
- 30$400,000 to $499,999
- 51$500,000 to $749,999
- 20$750,000 to $999,999

Distribution of rent paid by renters
![Distribution of rent paid by renters]()
- 3$300 to $399
- 5$500 to $599
- 2$600 to $699
- 3$700 to $799
- 6$800 to $899
- 2$900 to $999
- 5$1,000 to $1,249
- 20$1,250 to $1,499
- 17$1,500 to $1,999
- 4$2,000 or more

Median rent in 2022:
| Daley Park: | $1,412 |
| Tempe: | $1,566 |
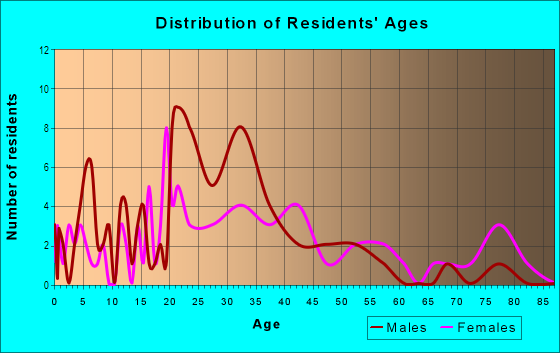
| Males: | 229 |
| Females: | 280 |
Males:
| This neighborhood: | 39.6 years |
| Whole city: | 28.9 years |
| This neighborhood: | 35.1 years |
| Whole city: | 30.5 years |
Average household size:
| Daley Park: | 2.9 people |
| Tempe: | 2.3 people |
Percentage of family households:
| Daley Park: | 54.4% |
| Tempe: | 36.3% |
| Here: | 61.5% |
| Tempe: | 32.6% |
Percentage of married-couple families with children (among all households):
| Daley Park: | 34.2% |
| Tempe: | 26.9% |
Percentage of single-mother households (among all households):
| Daley Park: | 4.4% |
| Tempe: | 8.3% |
Percentage of never married males 15 years old and over:
Percentage of never married females 15 years old and over:
| Daley Park: | 12.0% |
| Tempe: | 32.9% |
Percentage of never married females 15 years old and over:
| Daley Park: | 27.4% |
| city: | 21.7% |
Percentage of people that speak English not well or not at all:
| Daley Park: | 0.0% |
| Tempe: | 2.0% |
Percentage of people born in this state:
Percentage of people born in another U.S. state:
Percentage of native residents but born outside the U.S.:
Percentage of foreign born residents:
| Here: | 41.8% |
| Tempe: | 39.3% |
Percentage of people born in another U.S. state:
| Daley Park: | 47.8% |
| Tempe: | 46.0% |
Percentage of native residents but born outside the U.S.:
| Here: | 2.8% |
| city: | 1.8% |
Percentage of foreign born residents:
| Here: | 7.6% |
| Tempe: | 12.9% |
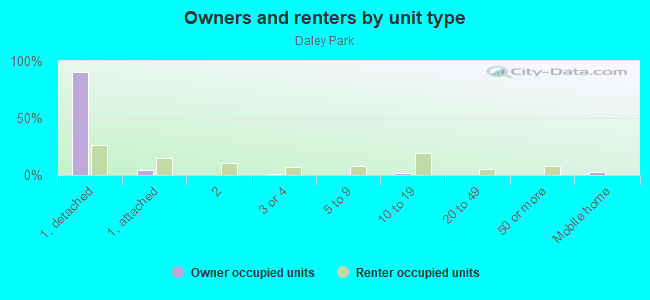
Owner-occupied
Renter-occupied

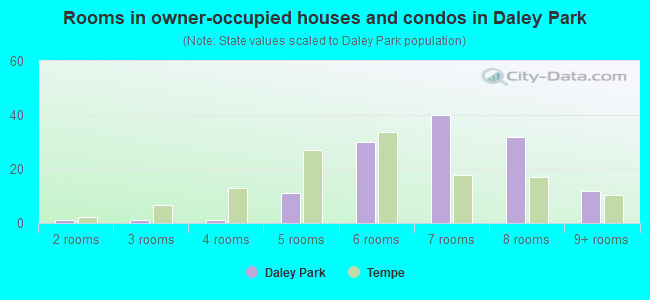
- Rooms in owner-occupied houses and condos in Daley Park
- 01 room
- 12 rooms
- 13 rooms
- 14 rooms
- 115 rooms
- 306 rooms
- 407 rooms
- 328 rooms
- 129+ rooms
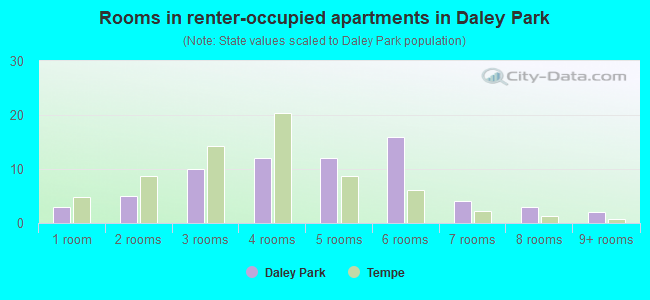
- Rooms in renter-occupied apartments in Daley Park
- 31 room
- 52 rooms
- 103 rooms
- 124 rooms
- 125 rooms
- 166 rooms
- 47 rooms
- 38 rooms
- 29+ rooms
Owner-occupied
Renter-occupied
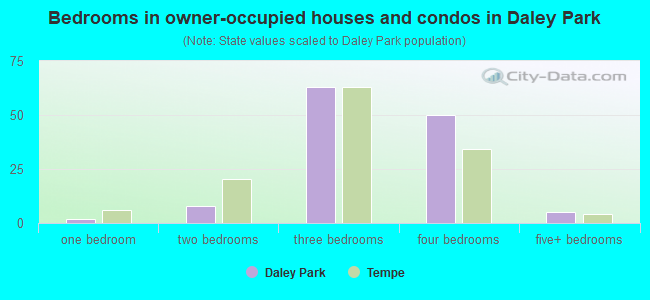
- Bedrooms in owner-occupied houses and condos in Daley Park
- 0no bedroom
- 21 bedroom
- 82 bedrooms
- 633 bedrooms
- 504 bedrooms
- 55+ bedrooms
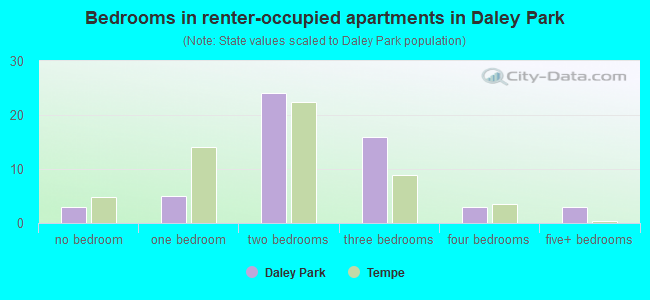
- Bedrooms in renter-occupied apartments in Daley Park
- 3no bedroom
- 51 bedroom
- 242 bedrooms
- 163 bedrooms
- 34 bedrooms
- 35+ bedrooms
Average number of cars or other vehicles available in houses/condos:
Average number of cars or other vehicles available in apartments:
| This neighborhood: | 2.3 |
| Tempe: | 2.0 |
Average number of cars or other vehicles available in apartments:
| Here: | 1.3 |
| city: | 1.6 |
Percentage of units with a mortgage:
| Daley Park: | 61.8% |
| Tempe: | 69.2% |
Average estimated value of detached houses in 2022 (76.7% of all units):
| Daley Park: | $522,524 |
| Tempe: | $535,475 |
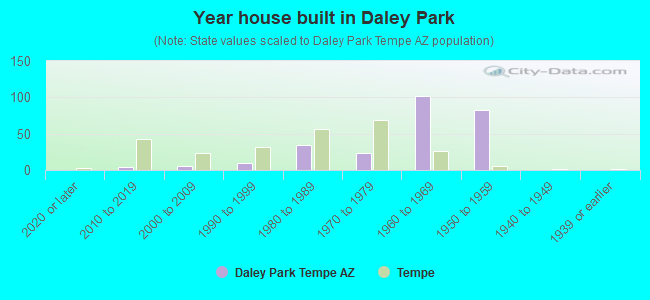
- Year house built in Daley Park
- 02020 or later
- 42010 to 2019
- 62000 to 2009
- 101990 to 1999
- 351980 to 1989
- 241970 to 1979
- 1021960 to 1969
- 821950 to 1959
- 01940 to 1949
- 01939 or earlier
City-data.com crime index for city in 2020 (higher means more crime):
| City: | 347.1 |
| U.S. average: | 219.5 |
Travel time to work (commute)
![Travel time to work (commute)]()
- 5Less than 5 minutes
- 335 to 9 minutes
- 3210 to 14 minutes
- 4715 to 19 minutes
- 2120 to 24 minutes
- 2925 to 29 minutes
- 930 to 34 minutes
- 135 to 39 minutes
- 1145 to 59 minutes
- 160 to 89 minutes
- 190 or more minutes

Means of transportation to work
![Means of transportation to work]()
- 48.1%139Drove a car alone
- 3.5%10Carpooled
- 1.0%3Bus
- 1.7%5Subway or elevated rail
- 15.9%46Bicycle
- 5.2%15Walked
- 2.8%8Other means
- 24.2%70Worked at home

Time leaving home to go to work
![Time leaving home to go to work]()
- 1212:00 a.m. to 4:59 a.m.
- 75:00 a.m. to 5:29 a.m.
- 15:30 a.m. to 5:59 a.m.
- 66:00 a.m. to 6:29 a.m.
- 226:30 a.m. to 6:59 a.m.
- 177:00 a.m. to 7:29 a.m.
- 137:30 a.m. to 7:59 a.m.
- 258:00 a.m. to 8:29 a.m.
- 298:30 a.m. to 8:59 a.m.
- 219:00 a.m. to 9:59 a.m.
- 210:00 a.m. to 10:59 a.m.
- 1812:00 p.m. to 3:59 p.m.
- 144:00 p.m. to 11:59 p.m.

Occupations of males:
- Percentage of males in management occupations (except farmers):
Here: 14.8% city: 10.2%
- Percentage of males in business and financial operations occupations:
Here: 9.1% city: 6.5%
- Percentage of males in computer and mathematical occupations:
Here: 9.1% city: 8.4%
- Percentage of males in architecture and engineering occupations:
Here: 6.4% city: 5.0%
- Percentage of males in education, training, and library occupations:
Here: 17.0% city: 6.1%
- Percentage of males in arts, design, entertainment, sports, and media occupations:
Here: 15.1% city: 2.8%
- Percentage of males in healthcare practitioners and technical occupations:
Here: 1.6% city: 2.8%
- Percentage of males in service occupations:
Here: 9.5% city: 14.4%
- Percentage of males in sales and office occupations:
Here: 18.2% city: 19.0%
- Percentage of males in construction, extraction, and maintenance occupations:
Here: 15.9% city: 5.1%
- Percentage of males in production occupations:
Here: 1.6% city: 4.4%
- Percentage of males in transportation occupations:
Here: 1.1% city: 3.9%
- Percentage of males in material moving occupations:
Here: 1.8% city: 3.5%
Occupations of females:
- Percentage of females in management occupations (except farmers):
Here: 4.2% city: 7.5%
- Percentage of females in business and financial operations occupations:
Here: 1.8% city: 9.3%
- Percentage of females in computer and mathematical occupations:
Here: 2.5% city: 3.3%
- Percentage of females in life, physical, and social science occupations:
Here: 5.3% city: 1.5%
- Percentage of females in community and social services occupations:
Here: 1.8% city: 3.4%
- Percentage of females in legal occupations:
Here: 3.4% city: 1.4%
- Percentage of females in education, training, and library occupations:
Here: 36.4% city: 12.0%
- Percentage of females in arts, design, entertainment, sports, and media occupations:
Here: 4.2% city: 3.1%
- Percentage of females in healthcare practitioners and technical occupations:
Here: 4.8% city: 7.4%
- Percentage of females in service occupations:
Here: 20.2% city: 18.9%
- Percentage of females in sales and office occupations:
Here: 12.3% city: 26.9%
- Percentage of females in transportation occupations:
Here: 1.5% city: 0.9%
- Percentage of females in material moving occupations:
Here: 6.7% city: 1.4%
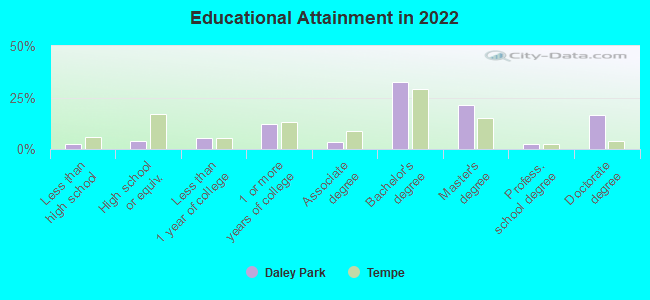
Education in this neighborhood (subdivision or community):
- Percentage of people 3 years and older in K-12 schools:
Daley Park: 19.3% Tempe: 12.5%
- Percentage of people 3 years and older in undergraduate colleges:
Daley Park: 14.1% Tempe: 15.4%
- Percentage of people 3 years and older in grad. or professional schools:
Daley Park: 4.2% Tempe: 6.3%
- Percentage of students K-12 enrolled in private schools:
Daley Park: 0.0% Tempe: 9.2%
Percentage of population below poverty level:
| Daley Park: | 20.7% |
| Tempe: | 15.0% |
Median year owner moved in (as recorded in 2022):
Median year renter moved in (as recorded in 2022):
| Daley Park: | 2003 |
| Tempe: | 2013 |
Median year renter moved in (as recorded in 2022):
| Daley Park: | 2020 |
| Tempe: | 2022 |
Percentage of married-couple families with both working:
| Daley Park: | 90.3% |
| Tempe: | 77.6% |
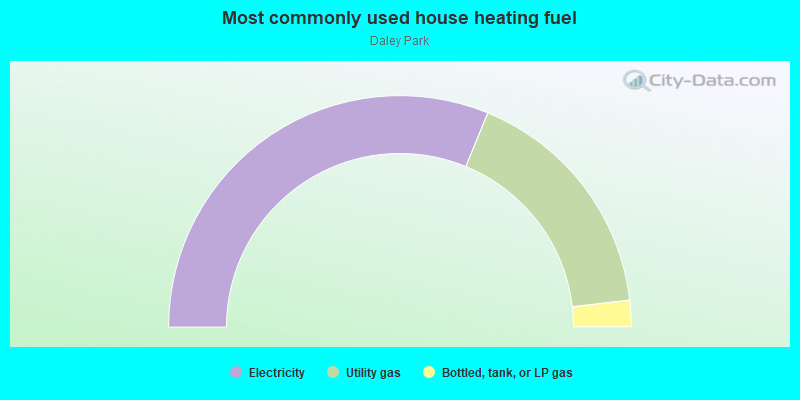
- 62.4%Electricity
- 33.9%Utility gas
- 3.7%Bottled, tank, or LP gas
Roads and streets:
E Broadway Ln
Length: 0.52 miles
Direction: E-W
Address range: 300 to 612
Direction: E-W
Address range: 300 to 612
E Encanto Dr
Length: 0.52 miles
Direction: E-W
Address range: 300 to 899
Direction: E-W
Address range: 300 to 899
E Broadway Rd
Length: 0.52 miles
Direction: E-W
Address range: 300 to 899
Direction: E-W
Address range: 300 to 899
E Solana Dr
Length: 0.41 miles
Direction: E-W
Address range: 300 to 799
Direction: E-W
Address range: 300 to 799
E Vista del Cerro Dr
Length: 0.27 miles
Directions: E-W, N-S, SW-NE
Address range: 500 to 899
Directions: E-W, N-S, SW-NE
Address range: 500 to 899
S Rural Rd
Length: 0.24 miles
Direction: N-S
Address range: 1700 to 1799
Direction: N-S
Address range: 1700 to 1799
S Ventura Dr
Length: 0.20 miles
Direction: N-S
Address range: 1600 to 1799
Direction: N-S
Address range: 1600 to 1799
S el Camino Dr
Length: 0.17 miles
Directions: E-W, N-S, SE-NW, SW-NE
Address range: 1701 to 1799
Directions: E-W, N-S, SE-NW, SW-NE
Address range: 1701 to 1799
S Sierra Vista Dr
Length: 0.15 miles
Directions: E-W, N-S, SE-NW, SW-NE
Address range: 1700 to 1799
Directions: E-W, N-S, SE-NW, SW-NE
Address range: 1700 to 1799
Univ Heights Acc Rd
Length: 0.15 miles
Directions: E-W, N-S, SE-NW, SW-NE
Directions: E-W, N-S, SE-NW, SW-NE
E Granada Dr
Length: 0.13 miles
Directions: E-W, SE-NW
Address range: 700 to 899
Directions: E-W, SE-NW
Address range: 700 to 899
S la Rosa Dr
Length: 0.10 miles
Direction: N-S
Address range: 1700 to 1799
Direction: N-S
Address range: 1700 to 1799
S Granada Dr
Length: 0.05 miles
Directions: N-S, SE-NW
Address range: 1700 to 1799
Directions: N-S, SE-NW
Address range: 1700 to 1799