De Marietta (Southwest) neighborhood in San Jose, California (CA), 95125, 95126 detailed profile
Settings
X


Business Search - 14 Million verified businesses
Area: 0.113 square miles
Population: 768
Population density:
| De Marietta (Southwest): | 6,771 people per square mile |
| San Jose: | 5,554 people per square mile |

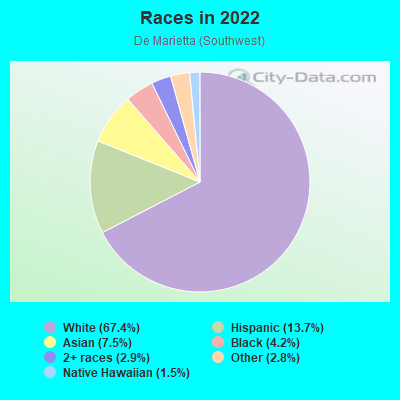
- 53167.4%White
- 10813.7%Hispanic or Latino
- 597.5%Asian
- 334.2%Black
- 232.9%Two or more races
- 222.8%Some other race
- 121.5%Native Hawaiian and Other
Pacific Islander
Median household income in 2022:
| De Marietta (Southwest): | $96,691 |
| San Jose: | $133,835 |
Distribution of median household income
![Distribution of median household income]()
- 28Less than $10,000
- 23$10,000 to $19,999
- 35$20,000 to $29,999
- 33$30,000 to $39,999
- 54$40,000 to $49,999
- 29$50,000 to $59,999
- 8$60,000 to $74,999
- 55$75,000 to $99,999
- 61$100,000 to $124,999
- 10$125,000 to $149,999
- 59$150,000 to $199,999
- 96$200,000 or more

Distribution of owner-occupied house/condo value
![Distribution of owner-occupied house/condo value]()
- 5Less than $50,000
- 14$50,000 to $99,999
- 4$200,000 to $249,999
- 14$500,000 to $749,999
- 159$750,000 to $999,999
- 153$1,000,000 or more

Distribution of rent paid by renters
![Distribution of rent paid by renters]()
- 23$200 to $299
- 8$300 to $399
- 8$500 to $599
- 16$1,000 to $1,249
- 9$1,250 to $1,499
- 31$1,500 to $1,999
- 161$2,000 or more

Median rent in 2022:
| De Marietta (Southwest): | $2,550 |
| San Jose: | $2,001 |
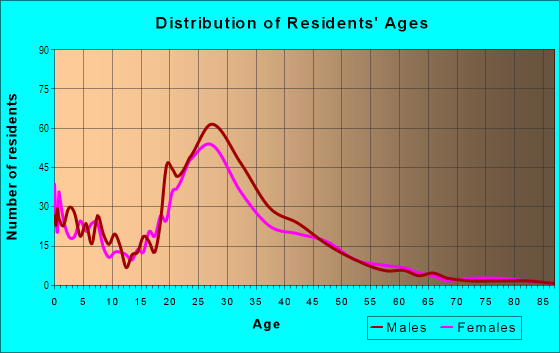
| Males: | 231 |
| Females: | 537 |
Males:
| This neighborhood: | 47.8 years |
| Whole city: | 37.6 years |
| This neighborhood: | 48.6 years |
| Whole city: | 39.1 years |
Average household size:
| De Marietta (Southwest): | 1.6 people |
| San Jose: | 2.9 people |
Percentage of family households:
| De Marietta (Southwest): | 31.4% |
| San Jose: | 49.9% |
| Here: | 21.3% |
| San Jose: | 53.0% |
Percentage of married-couple families with children (among all households):
| De Marietta (Southwest): | 13.3% |
| San Jose: | 25.8% |
Percentage of single-mother households (among all households):
| De Marietta (Southwest): | 27.5% |
| San Jose: | 5.2% |
Percentage of never married males 15 years old and over:
Percentage of never married females 15 years old and over:
| De Marietta (Southwest): | 12.8% |
| San Jose: | 20.9% |
Percentage of never married females 15 years old and over:
| De Marietta (Southwest): | 22.2% |
| city: | 16.7% |
Percentage of people that speak English not well or not at all:
| De Marietta (Southwest): | 10.4% |
| San Jose: | 11.4% |
Percentage of people born in this state:
Percentage of people born in another U.S. state:
Percentage of native residents but born outside the U.S.:
Percentage of foreign born residents:
| Here: | 56.2% |
| San Jose: | 46.1% |
Percentage of people born in another U.S. state:
| De Marietta (Southwest): | 18.0% |
| San Jose: | 10.4% |
Percentage of native residents but born outside the U.S.:
| Here: | 0.2% |
| city: | 1.7% |
Percentage of foreign born residents:
| Here: | 25.7% |
| San Jose: | 41.8% |

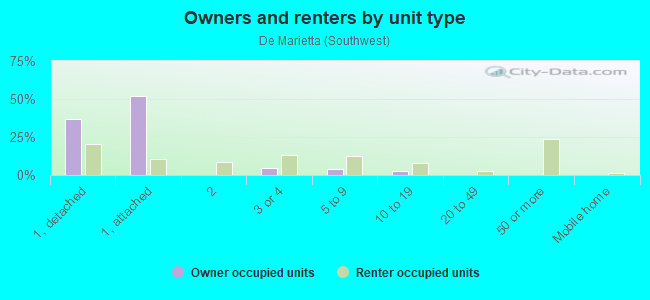
Owner-occupied
Renter-occupied

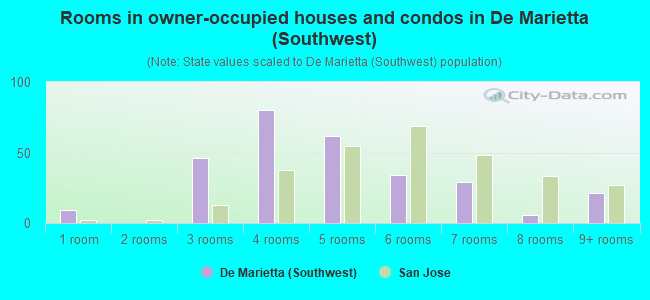
- Rooms in owner-occupied houses and condos in De Marietta <
> - 91 room
- 02 rooms
- 463 rooms
- 804 rooms
- 625 rooms
- 346 rooms
- 297 rooms
- 68 rooms
- 219+ rooms
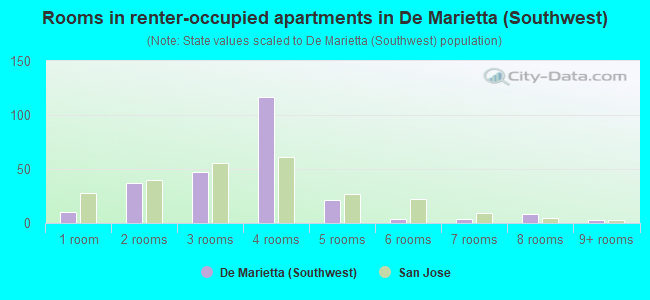
- Rooms in renter-occupied apartments in De Marietta <
> - 101 room
- 372 rooms
- 473 rooms
- 1174 rooms
- 215 rooms
- 46 rooms
- 47 rooms
- 88 rooms
- 39+ rooms
Owner-occupied
Renter-occupied
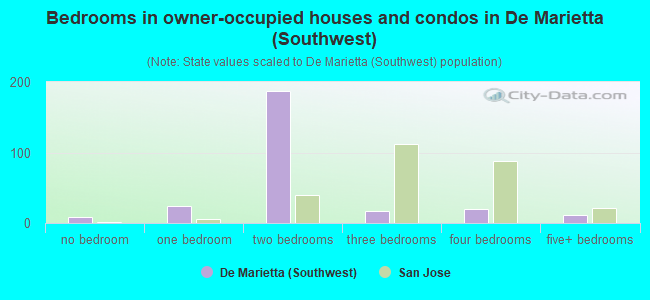
- Bedrooms in owner-occupied houses and condos in De Marietta <
> - 9no bedroom
- 241 bedroom
- 1872 bedrooms
- 173 bedrooms
- 204 bedrooms
- 115+ bedrooms

- Bedrooms in renter-occupied apartments in De Marietta <
> - 6no bedroom
- 591 bedroom
- 1602 bedrooms
- 23 bedrooms
- 44 bedrooms
- 35+ bedrooms
Average number of cars or other vehicles available in houses/condos:
Average number of cars or other vehicles available in apartments:
| This neighborhood: | 1.3 |
| San Jose: | 2.3 |
Average number of cars or other vehicles available in apartments:
| Here: | 1.2 |
| city: | 1.6 |
Percentage of units with a mortgage:
| De Marietta (Southwest): | 77.6% |
| San Jose: | 66.9% |
Housing prices:
- Average estimated value of townhouses or other attached units in 2022 (46.7% of all units):
This neighborhood: $871,692 city: $1,024,857
- Average estimated '22 value of housing units in 3-to-4-unit structures (11.4% of all units):
De Marietta (Southwest): $1,035,900 city: $781,695
- Average estimated '22 value of housing units in 5-or-more-unit structures (14.3% of all units):
De Marietta (Southwest): $810,059 San Jose: $791,954

- Year house built in De Marietta <
> - 02020 or later
- 362010 to 2019
- 22000 to 2009
- 01990 to 1999
- 3221980 to 1989
- 801970 to 1979
- 321960 to 1969
- 91950 to 1959
- 381940 to 1949
- 231939 or earlier
City-data.com crime index for city in 2020 (higher means more crime):
| City: | 268.4 |
| U.S. average: | 219.5 |
Travel time to work (commute)
![Travel time to work (commute)]()
- 3Less than 5 minutes
- 255 to 9 minutes
- 9710 to 14 minutes
- 7315 to 19 minutes
- 6020 to 24 minutes
- 6725 to 29 minutes
- 7830 to 34 minutes
- 1435 to 39 minutes
- 2840 to 44 minutes
- 1045 to 59 minutes
- 660 to 89 minutes
- 3190 or more minutes

Means of transportation to work
![Means of transportation to work]()
- 66.7%268Drove a car alone
- 1.7%7Carpooled
- 6.5%26Bus
- 7.7%31Light rail, streetcar or trolley
- 1.0%4Bicycle
- 2.7%11Walked
- 20.4%82Worked at home

Time leaving home to go to work
![Time leaving home to go to work]()
- 325:30 a.m. to 5:59 a.m.
- 176:00 a.m. to 6:29 a.m.
- 436:30 a.m. to 6:59 a.m.
- 707:00 a.m. to 7:29 a.m.
- 887:30 a.m. to 7:59 a.m.
- 788:00 a.m. to 8:29 a.m.
- 308:30 a.m. to 8:59 a.m.
- 789:00 a.m. to 9:59 a.m.
- 310:00 a.m. to 10:59 a.m.
- 2211:00 a.m. to 11:59 a.m.
- 6412:00 p.m. to 3:59 p.m.
- 24:00 p.m. to 11:59 p.m.

Occupations of males:
- Percentage of males in management occupations (except farmers):
Here: 19.8% city: 13.0%
- Percentage of males in business and financial operations occupations:
Here: 8.9% city: 4.6%
- Percentage of males in computer and mathematical occupations:
Here: 21.3% city: 13.6%
- Percentage of males in architecture and engineering occupations:
Here: 13.4% city: 10.2%
- Percentage of males in life, physical, and social science occupations:
Here: 5.4% city: 1.1%
- Percentage of males in community and social services occupations:
Here: 1.8% city: 0.8%
- Percentage of males in education, training, and library occupations:
Here: 5.9% city: 2.8%
- Percentage of males in healthcare practitioners and technical occupations:
Here: 8.4% city: 2.0%
- Percentage of males in service occupations:
Here: 12.1% city: 12.7%
- Percentage of males in sales and office occupations:
Here: 1.5% city: 12.8%
- Percentage of males in farming, fishing, and forestry occupations:
Here: 5.3% city: 0.4%
- Percentage of males in construction, extraction, and maintenance occupations:
Here: 3.7% city: 7.8%
- Percentage of males in transportation occupations:
Here: 5.5% city: 3.6%
Occupations of females:
- Percentage of females in management occupations (except farmers):
Here: 6.2% city: 11.0%
- Percentage of females in business and financial operations occupations:
Here: 9.0% city: 8.6%
- Percentage of females in computer and mathematical occupations:
Here: 5.0% city: 5.4%
- Percentage of females in architecture and engineering occupations:
Here: 6.2% city: 2.8%
- Percentage of females in life, physical, and social science occupations:
Here: 2.6% city: 1.7%
- Percentage of females in legal occupations:
Here: 11.5% city: 1.3%
- Percentage of females in education, training, and library occupations:
Here: 20.5% city: 8.1%
- Percentage of females in arts, design, entertainment, sports, and media occupations:
Here: 14.3% city: 2.0%
- Percentage of females in healthcare practitioners and technical occupations:
Here: 7.8% city: 6.8%
- Percentage of females in service occupations:
Here: 4.7% city: 21.7%
- Percentage of females in sales and office occupations:
Here: 14.9% city: 22.0%
- Percentage of females in material moving occupations:
Here: 1.3% city: 1.5%
Education in this neighborhood (subdivision or community):
- Percentage of people 3 years and older in K-12 schools:
De Marietta (Southwest): 16.1% San Jose: 16.1%
- Percentage of people 3 years and older in undergraduate colleges:
De Marietta (Southwest): 5.3% San Jose: 6.5%
- Percentage of people 3 years and older in grad. or professional schools:
De Marietta (Southwest): 0.8% San Jose: 2.0%
- Percentage of students K-12 enrolled in private schools:
De Marietta (Southwest): 16.8% San Jose: 14.9%
Percentage of population below poverty level:
| De Marietta (Southwest): | 9.5% |
| San Jose: | 9.0% |
Median year owner moved in (as recorded in 2022):
Median year renter moved in (as recorded in 2022):
| De Marietta (Southwest): | 2008 |
| San Jose: | 2008 |
Median year renter moved in (as recorded in 2022):
| De Marietta (Southwest): | 2017 |
| San Jose: | 2020 |
Percentage of married-couple families with both working:
| De Marietta (Southwest): | 100.0% |
| San Jose: | 72.5% |
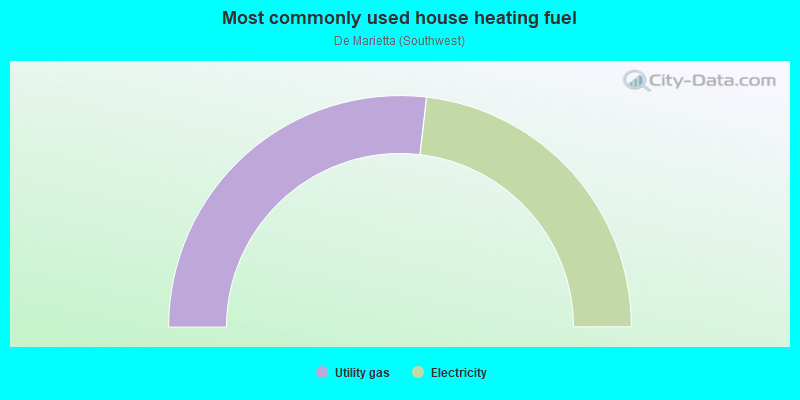
- 53.7%Utility gas
- 46.3%Electricity
Roads and streets:
Stokes St
Length: 0.33 miles
Direction: E-W
Address range: 1746 to 2242
Direction: E-W
Address range: 1746 to 2242
de Marietta Ave
Length: 0.28 miles
Directions: E-W, N-S, SE-NW, SW-NE
Address range: 1600 to 1975
Directions: E-W, N-S, SE-NW, SW-NE
Address range: 1600 to 1975
Leigh Ave
Length: 0.17 miles
Directions: N-S, SW-NE
Address range: 1110 to 1249
Directions: N-S, SW-NE
Address range: 1110 to 1249
de Marietta Ct
Length: 0.08 miles
Directions: E-W, SE-NW
Address range: 1700 to 1799
Directions: E-W, SE-NW
Address range: 1700 to 1799
Other features:
Los Gatos Crk
Length: 0.43 miles
Directions: E-W, SE-NW, SW-NE
Directions: E-W, SE-NW, SW-NE