Dexter neighborhood in Evansville, Indiana (IN), 47714 detailed profile
Settings
X


Business Search - 14 Million verified businesses
Area: 0.126 square miles
Population: 524
Population density:
| Dexter: | 4,170 people per square mile |
| Evansville: | 2,912 people per square mile |

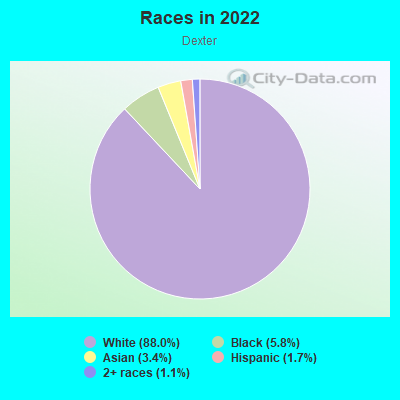
- 46988.0%White
- 315.8%Black
- 183.4%Asian
- 91.7%Hispanic or Latino
- 61.1%Two or more races
Distribution of median household income
![Distribution of median household income]()
- 6Less than $10,000
- 12$10,000 to $19,999
- 13$20,000 to $29,999
- 15$30,000 to $39,999
- 27$40,000 to $49,999
- 18$50,000 to $59,999
- 49$60,000 to $74,999
- 32$75,000 to $99,999
- 23$100,000 to $124,999
- 15$125,000 to $149,999
- 23$150,000 to $199,999
- 14$200,000 or more

Distribution of owner-occupied house/condo value
![Distribution of owner-occupied house/condo value]()
- 18Less than $50,000
- 62$50,000 to $99,999
- 66$100,000 to $149,999
- 65$150,000 to $199,999
- 48$200,000 to $249,999
- 13$250,000 to $299,999
- 10$300,000 to $399,999
- 3$400,000 to $499,999
- 4$500,000 to $749,999
- 5$750,000 to $999,999
- 1$1,000,000 or more

Distribution of rent paid by renters
![Distribution of rent paid by renters]()
- 1Less than $100
- 21$400 to $499
- 49$500 to $599
- 87$600 to $699
- 10$700 to $799
- 13$800 to $899
- 4$900 to $999
- 7$1,500 to $1,999

| Males: | 252 |
| Females: | 272 |
Males:
| This neighborhood: | 36.5 years |
| Whole city: | 36.6 years |
| This neighborhood: | 41.2 years |
| Whole city: | 38.9 years |
Average household size:
| Dexter: | 7.4 people |
| Evansville: | 2.1 people |
Percentage of family households:
| Dexter: | 55.3% |
| Evansville: | 38.3% |
| Here: | 54.6% |
| Evansville: | 33.7% |
Percentage of married-couple families with children (among all households):
| Dexter: | 30.2% |
| Evansville: | 25.3% |
Percentage of single-mother households (among all households):
| Dexter: | 13.8% |
| Evansville: | 15.6% |
Percentage of never married males 15 years old and over:
Percentage of never married females 15 years old and over:
| Dexter: | 13.2% |
| Evansville: | 19.5% |
Percentage of never married females 15 years old and over:
| Dexter: | 9.7% |
| city: | 17.0% |
Percentage of people that speak English not well or not at all:
| Dexter: | 0.2% |
| Evansville: | 0.7% |
Percentage of people born in this state:
Percentage of people born in another U.S. state:
Percentage of native residents but born outside the U.S.:
Percentage of foreign born residents:
| Here: | 72.5% |
| Evansville: | 70.5% |
Percentage of people born in another U.S. state:
| Dexter: | 22.8% |
| Evansville: | 25.5% |
Percentage of native residents but born outside the U.S.:
| Here: | 0.2% |
| city: | 0.8% |
Percentage of foreign born residents:
| Here: | 4.7% |
| Evansville: | 3.2% |
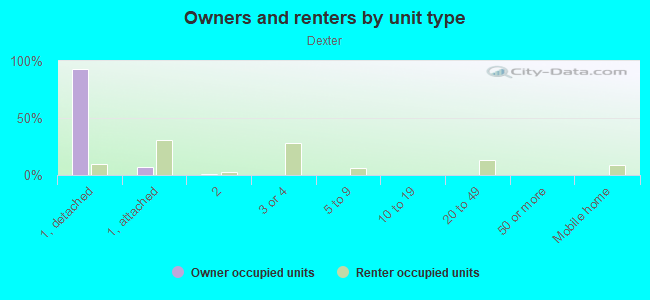
Owner-occupied
Renter-occupied

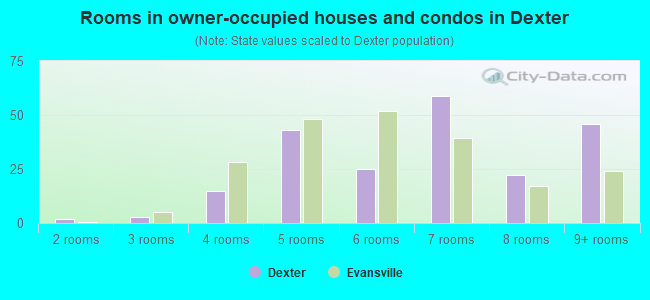
- Rooms in owner-occupied houses and condos in Dexter
- 01 room
- 22 rooms
- 33 rooms
- 154 rooms
- 435 rooms
- 256 rooms
- 597 rooms
- 228 rooms
- 469+ rooms
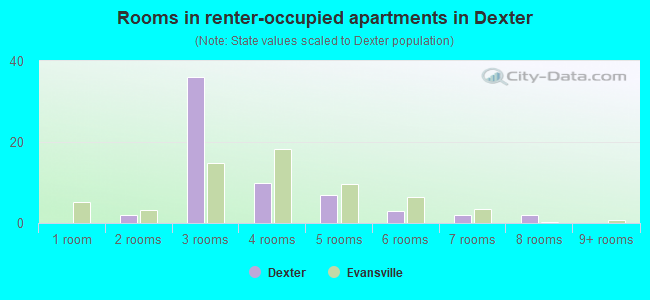
- Rooms in renter-occupied apartments in Dexter
- 01 room
- 22 rooms
- 363 rooms
- 104 rooms
- 75 rooms
- 36 rooms
- 27 rooms
- 28 rooms
- 09+ rooms
Owner-occupied
Renter-occupied
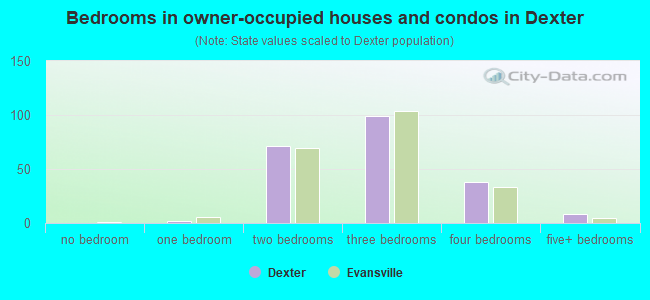
- Bedrooms in owner-occupied houses and condos in Dexter
- 0no bedroom
- 21 bedroom
- 712 bedrooms
- 993 bedrooms
- 384 bedrooms
- 85+ bedrooms
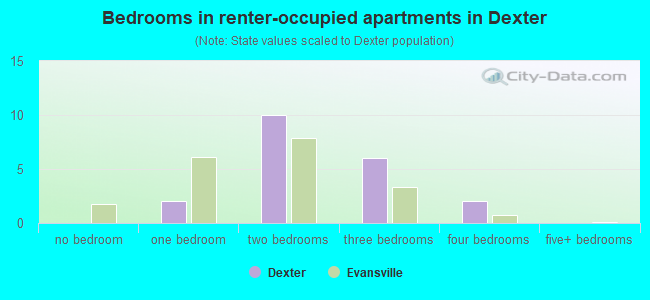
- Bedrooms in renter-occupied apartments in Dexter
- 0no bedroom
- 21 bedroom
- 102 bedrooms
- 63 bedrooms
- 24 bedrooms
- 05+ bedrooms
Average number of cars or other vehicles available in houses/condos:
Average number of cars or other vehicles available in apartments:
| This neighborhood: | 2.1 |
| Evansville: | 1.8 |
Average number of cars or other vehicles available in apartments:
| Here: | 1.6 |
| city: | 1.1 |
Percentage of units with a mortgage:
| Dexter: | 75.7% |
| Evansville: | 58.5% |
Average estimated value of detached houses in 2022 (97.1% of all units):
| Dexter: | $183,976 |
| Indiana: | $257,916 |
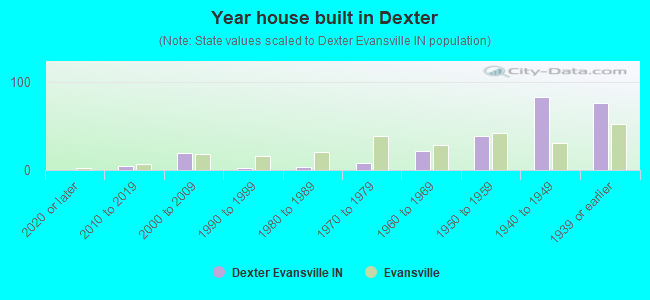
- Year house built in Dexter
- 02020 or later
- 52010 to 2019
- 192000 to 2009
- 21990 to 1999
- 31980 to 1989
- 81970 to 1979
- 221960 to 1969
- 391950 to 1959
- 831940 to 1949
- 771939 or earlier
City-data.com crime index for city in 2020 (higher means more crime):
| City: | 440.8 |
| U.S. average: | 219.5 |
Travel time to work (commute)
![Travel time to work (commute)]()
- 7Less than 5 minutes
- 635 to 9 minutes
- 6710 to 14 minutes
- 4515 to 19 minutes
- 1220 to 24 minutes
- 1325 to 29 minutes
- 430 to 34 minutes
- 135 to 39 minutes
- 2840 to 44 minutes
- 945 to 59 minutes
- 160 to 89 minutes
- 590 or more minutes

Means of transportation to work
![Means of transportation to work]()
- 88.5%259Drove a car alone
- 4.1%12Carpooled
- 22.2%65Bus
- 22.5%66Taxi
- 14.3%42Motorcycle
- 2.7%8Bicycle
- 1.0%3Walked
- 7.2%21Other means
- 5.8%17Worked at home

Time leaving home to go to work
![Time leaving home to go to work]()
- 1012:00 a.m. to 4:59 a.m.
- 75:00 a.m. to 5:29 a.m.
- 85:30 a.m. to 5:59 a.m.
- 166:00 a.m. to 6:29 a.m.
- 136:30 a.m. to 6:59 a.m.
- 467:00 a.m. to 7:29 a.m.
- 627:30 a.m. to 7:59 a.m.
- 198:00 a.m. to 8:29 a.m.
- 178:30 a.m. to 8:59 a.m.
- 189:00 a.m. to 9:59 a.m.
- 610:00 a.m. to 10:59 a.m.
- 1112:00 p.m. to 3:59 p.m.
- 194:00 p.m. to 11:59 p.m.

Occupations of males:
- Percentage of males in management occupations (except farmers):
Here: 8.4% city: 8.4%
- Percentage of males in business and financial operations occupations:
Here: 16.4% city: 3.1%
- Percentage of males in computer and mathematical occupations:
Here: 4.1% city: 3.0%
- Percentage of males in architecture and engineering occupations:
Here: 1.2% city: 3.0%
- Percentage of males in community and social services occupations:
Here: 4.6% city: 0.9%
- Percentage of males in education, training, and library occupations:
Here: 2.6% city: 2.7%
- Percentage of males in service occupations:
Here: 5.5% city: 15.9%
- Percentage of males in sales and office occupations:
Here: 16.9% city: 14.7%
- Percentage of males in construction, extraction, and maintenance occupations:
Here: 19.6% city: 7.3%
- Percentage of males in production occupations:
Here: 9.7% city: 14.9%
- Percentage of males in transportation occupations:
Here: 3.1% city: 7.3%
- Percentage of males in material moving occupations:
Here: 4.7% city: 8.2%
Occupations of females:
- Percentage of females in management occupations (except farmers):
Here: 12.6% city: 6.4%
- Percentage of females in business and financial operations occupations:
Here: 1.5% city: 4.6%
- Percentage of females in computer and mathematical occupations:
Here: 1.5% city: 1.4%
- Percentage of females in community and social services occupations:
Here: 3.6% city: 2.7%
- Percentage of females in legal occupations:
Here: 2.7% city: 0.5%
- Percentage of females in education, training, and library occupations:
Here: 5.9% city: 5.7%
- Percentage of females in arts, design, entertainment, sports, and media occupations:
Here: 1.0% city: 1.3%
- Percentage of females in healthcare practitioners and technical occupations:
Here: 13.7% city: 8.9%
- Percentage of females in service occupations:
Here: 13.8% city: 26.1%
- Percentage of females in sales and office occupations:
Here: 41.1% city: 30.9%
- Percentage of females in construction, extraction, and maintenance occupations:
Here: 1.9% city: 0.3%
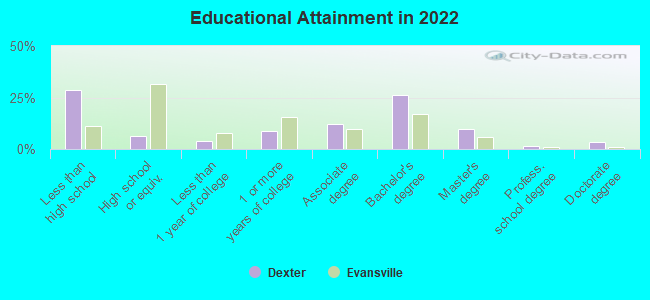
Education in this neighborhood (subdivision or community):
- Percentage of people 3 years and older in K-12 schools:
Dexter: 19.0% Evansville: 15.5%
- Percentage of people 3 years and older in undergraduate colleges:
Dexter: 4.2% Evansville: 5.1%
- Percentage of people 3 years and older in grad. or professional schools:
Dexter: 1.6% Evansville: 0.8%
- Percentage of students K-12 enrolled in private schools:
Dexter: 29.5% Evansville: 15.2%
Percentage of population below poverty level:
| Dexter: | 4.7% |
| Evansville: | 19.3% |
Median year owner moved in (as recorded in 2022):
Median year renter moved in (as recorded in 2022):
| Dexter: | 2009 |
| Evansville: | 2011 |
Median year renter moved in (as recorded in 2022):
| Dexter: | 2018 |
| Evansville: | 2020 |
Percentage of married-couple families with both working:
| Dexter: | 80.2% |
| Evansville: | 71.5% |
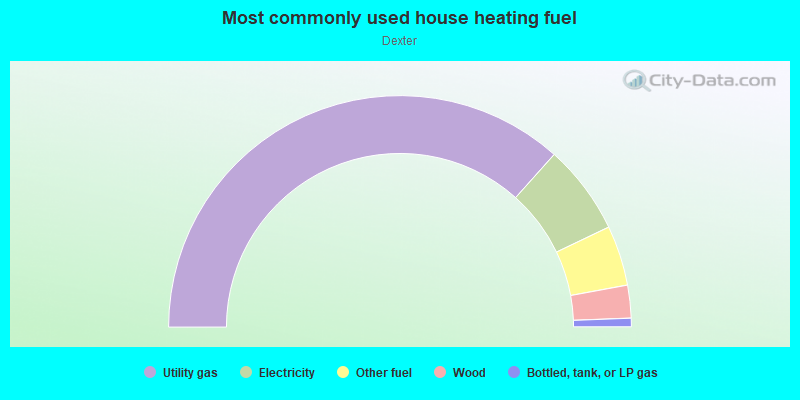
- 73.3%Utility gas
- 12.6%Electricity
- 8.4%Other fuel
- 4.6%Wood
- 1.2%Bottled, tank, or LP gas
Roads and streets:
E Chandler Ave
Length: 0.43 miles
Direction: E-W
Address range: 2600 to 3199
Direction: E-W
Address range: 2600 to 3199
S Dexter Ave
Length: 0.31 miles
Direction: N-S
Address range: 750 to 999
Direction: N-S
Address range: 750 to 999
E Powell Ave
Length: 0.31 miles
Direction: E-W
Address range: 2600 to 3199
Direction: E-W
Address range: 2600 to 3199
E Blackford Ave
Length: 0.31 miles
Direction: E-W
Address range: 2600 to 3199
Direction: E-W
Address range: 2600 to 3199
S Villa Dr
Length: 0.31 miles
Direction: N-S
Address range: 718 to 999
Direction: N-S
Address range: 718 to 999
Bayard Park Dr
Length: 0.29 miles
Direction: E-W
Address range: 2800 to 3199
Direction: E-W
Address range: 2800 to 3199
E Gum St
Length: 0.29 miles
Direction: E-W
Address range: 2800 to 3199
Direction: E-W
Address range: 2800 to 3199
Washington Ave
Length: 0.27 miles
Direction: E-W
Address range: 2600 to 2999
Direction: E-W
Address range: 2600 to 2999
S Saint James Blvd
Length: 0.18 miles
Direction: N-S
Address range: 814 to 998
Direction: N-S
Address range: 814 to 998
Vann Ave
Length: 0.06 miles
Direction: N-S
Address range: 720 to 799
Direction: N-S
Address range: 720 to 799