Dover-parkside neighborhood in Ann Arbor, Michigan (MI), 48103 detailed profile
Settings
X


Business Search - 14 Million verified businesses
Area: 0.050 square miles
Population: 523
Population density:
| Dover-parkside: | 10,528 people per square mile |
| Ann Arbor: | 4,438 people per square mile |

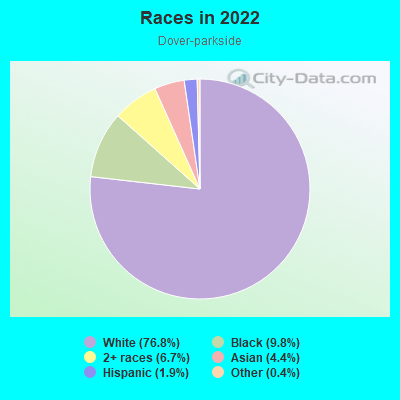
- 40076.8%White
- 519.8%Black
- 356.7%Two or more races
- 234.4%Asian
- 101.9%Hispanic or Latino
- 20.4%Some other race
Median household income in 2022:
| Dover-parkside: | $138,882 |
| Ann Arbor: | $78,740 |
Distribution of median household income
![Distribution of median household income]()
- 26Less than $10,000
- 2$10,000 to $19,999
- 8$20,000 to $29,999
- 3$30,000 to $39,999
- 12$40,000 to $49,999
- 13$50,000 to $59,999
- 7$60,000 to $74,999
- 19$75,000 to $99,999
- 18$100,000 to $124,999
- 13$125,000 to $149,999
- 24$150,000 to $199,999
- 79$200,000 or more

Distribution of owner-occupied house/condo value
![Distribution of owner-occupied house/condo value]()
- 1$50,000 to $99,999
- 2$150,000 to $199,999
- 12$200,000 to $249,999
- 18$250,000 to $299,999
- 18$300,000 to $399,999
- 47$400,000 to $499,999
- 49$500,000 to $749,999
- 15$750,000 to $999,999
- 9$1,000,000 or more

Distribution of rent paid by renters
![Distribution of rent paid by renters]()
- 2Less than $100
- 1$200 to $299
- 4$600 to $699
- 3$700 to $799
- 2$800 to $899
- 8$1,000 to $1,249
- 5$1,250 to $1,499
- 27$1,500 to $1,999
- 4$2,000 or more

Median rent in 2022:
| Dover-parkside: | $1,588 |
| Ann Arbor: | $1,381 |
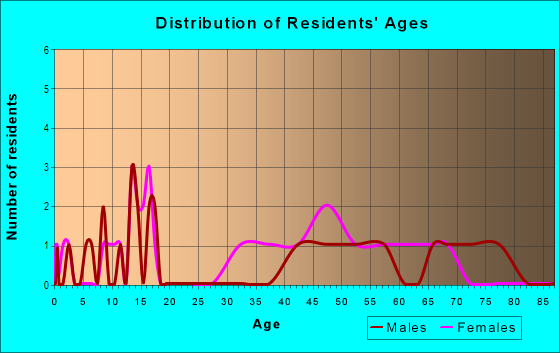
| Males: | 248 |
| Females: | 274 |
Males:
| This neighborhood: | 41.3 years |
| Whole city: | 25.8 years |
| This neighborhood: | 42.2 years |
| Whole city: | 26.4 years |
Average household size:
| Dover-parkside: | 2.4 people |
| Ann Arbor: | 2.2 people |
Percentage of family households:
| Dover-parkside: | 49.6% |
| Ann Arbor: | 30.6% |
| Here: | 52.5% |
| Ann Arbor: | 33.8% |
Percentage of married-couple families with children (among all households):
| Dover-parkside: | 31.7% |
| Ann Arbor: | 33.4% |
Percentage of single-mother households (among all households):
| Dover-parkside: | 6.8% |
| Ann Arbor: | 5.6% |
Percentage of never married males 15 years old and over:
Percentage of never married females 15 years old and over:
| Dover-parkside: | 17.6% |
| Ann Arbor: | 30.5% |
Percentage of never married females 15 years old and over:
| Dover-parkside: | 13.9% |
| city: | 27.5% |
Percentage of people that speak English not well or not at all:
| Dover-parkside: | 0.0% |
| Ann Arbor: | 1.5% |
Percentage of people born in this state:
Percentage of people born in another U.S. state:
Percentage of native residents but born outside the U.S.:
Percentage of foreign born residents:
| Here: | 49.5% |
| Ann Arbor: | 45.8% |
Percentage of people born in another U.S. state:
| Dover-parkside: | 37.8% |
| Ann Arbor: | 34.9% |
Percentage of native residents but born outside the U.S.:
| Here: | 0.5% |
| city: | 1.6% |
Percentage of foreign born residents:
| Here: | 12.2% |
| Ann Arbor: | 17.7% |
Owner-occupied
Renter-occupied

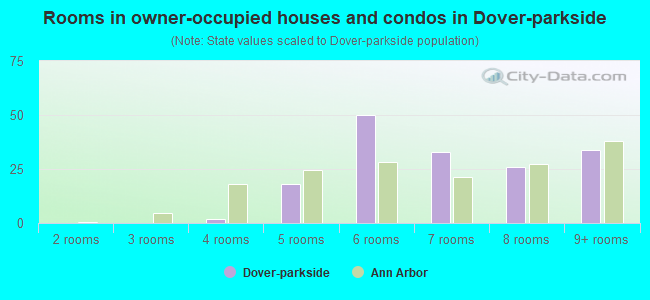
- Rooms in owner-occupied houses and condos in Dover-parkside
- 01 room
- 02 rooms
- 03 rooms
- 24 rooms
- 185 rooms
- 506 rooms
- 337 rooms
- 268 rooms
- 349+ rooms
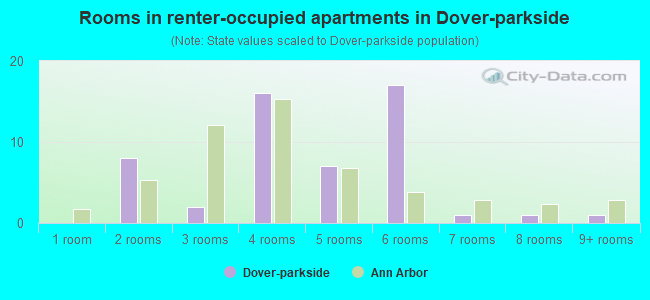
- Rooms in renter-occupied apartments in Dover-parkside
- 01 room
- 82 rooms
- 23 rooms
- 164 rooms
- 75 rooms
- 176 rooms
- 17 rooms
- 18 rooms
- 19+ rooms
Owner-occupied
Renter-occupied
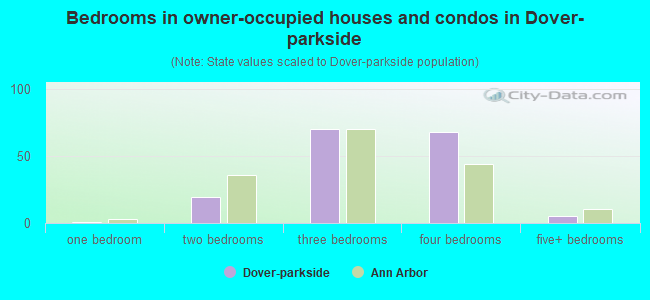
- Bedrooms in owner-occupied houses and condos in Dover-parkside
- 0no bedroom
- 11 bedroom
- 192 bedrooms
- 703 bedrooms
- 684 bedrooms
- 55+ bedrooms
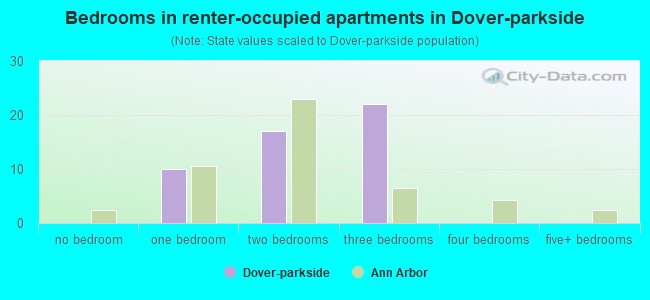
- Bedrooms in renter-occupied apartments in Dover-parkside
- 0no bedroom
- 101 bedroom
- 172 bedrooms
- 223 bedrooms
- 04 bedrooms
- 05+ bedrooms
Average number of cars or other vehicles available in houses/condos:
Average number of cars or other vehicles available in apartments:
| This neighborhood: | 1.8 |
| Ann Arbor: | 1.7 |
Average number of cars or other vehicles available in apartments:
| Here: | 1.2 |
| city: | 1.3 |
Percentage of units with a mortgage:
| Dover-parkside: | 65.8% |
| Ann Arbor: | 62.6% |
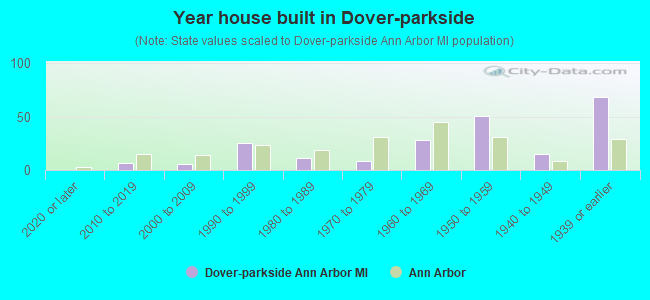
- Year house built in Dover-parkside
- 02020 or later
- 72010 to 2019
- 62000 to 2009
- 251990 to 1999
- 111980 to 1989
- 81970 to 1979
- 281960 to 1969
- 511950 to 1959
- 151940 to 1949
- 681939 or earlier
City-data.com crime index for city in 2020 (higher means more crime):
| City: | 137.0 |
| U.S. average: | 219.5 |
Travel time to work (commute)
![Travel time to work (commute)]()
- 1Less than 5 minutes
- 75 to 9 minutes
- 3010 to 14 minutes
- 2415 to 19 minutes
- 2520 to 24 minutes
- 325 to 29 minutes
- 530 to 34 minutes
- 335 to 39 minutes
- 340 to 44 minutes
- 2145 to 59 minutes
- 460 to 89 minutes

Means of transportation to work
![Means of transportation to work]()
- 61.0%177Drove a car alone
- 1.7%5Carpooled
- 5.5%16Bus
- 4.1%12Bicycle
- 9.7%28Walked
- 17.2%50Worked at home

Time leaving home to go to work
![Time leaving home to go to work]()
- 25:00 a.m. to 5:29 a.m.
- 15:30 a.m. to 5:59 a.m.
- 66:00 a.m. to 6:29 a.m.
- 36:30 a.m. to 6:59 a.m.
- 147:00 a.m. to 7:29 a.m.
- 247:30 a.m. to 7:59 a.m.
- 178:00 a.m. to 8:29 a.m.
- 168:30 a.m. to 8:59 a.m.
- 199:00 a.m. to 9:59 a.m.
- 110:00 a.m. to 10:59 a.m.
- 612:00 p.m. to 3:59 p.m.
- 44:00 p.m. to 11:59 p.m.

Occupations of males:
- Percentage of males in management occupations (except farmers):
Here: 5.8% city: 10.3%
- Percentage of males in business and financial operations occupations:
Here: 8.5% city: 4.5%
- Percentage of males in computer and mathematical occupations:
Here: 5.7% city: 9.0%
- Percentage of males in architecture and engineering occupations:
Here: 6.8% city: 7.8%
- Percentage of males in life, physical, and social science occupations:
Here: 1.3% city: 5.8%
- Percentage of males in legal occupations:
Here: 8.8% city: 2.2%
- Percentage of males in education, training, and library occupations:
Here: 23.0% city: 19.2%
- Percentage of males in arts, design, entertainment, sports, and media occupations:
Here: 4.8% city: 2.4%
- Percentage of males in healthcare practitioners and technical occupations:
Here: 8.0% city: 6.9%
- Percentage of males in service occupations:
Here: 11.1% city: 8.2%
- Percentage of males in sales and office occupations:
Here: 9.5% city: 10.4%
- Percentage of males in transportation occupations:
Here: 2.7% city: 1.7%
- Percentage of males in material moving occupations:
Here: 10.0% city: 1.5%
Occupations of females:
- Percentage of females in management occupations (except farmers):
Here: 13.7% city: 8.5%
- Percentage of females in business and financial operations occupations:
Here: 1.6% city: 5.3%
- Percentage of females in architecture and engineering occupations:
Here: 1.8% city: 1.7%
- Percentage of females in life, physical, and social science occupations:
Here: 3.4% city: 4.8%
- Percentage of females in community and social services occupations:
Here: 2.6% city: 3.5%
- Percentage of females in legal occupations:
Here: 2.9% city: 0.7%
- Percentage of females in education, training, and library occupations:
Here: 39.1% city: 20.2%
- Percentage of females in arts, design, entertainment, sports, and media occupations:
Here: 10.8% city: 4.6%
- Percentage of females in healthcare practitioners and technical occupations:
Here: 11.9% city: 11.9%
- Percentage of females in service occupations:
Here: 4.9% city: 15.5%
- Percentage of females in sales and office occupations:
Here: 10.1% city: 17.0%
- Percentage of females in material moving occupations:
Here: 1.2% city: 1.0%
Percentage of people 16-64 in Armed Forces:
| Dover-parkside: | 0.6% |
| Ann Arbor: | 0.2% |
Education in this neighborhood (subdivision or community):
- Percentage of people 3 years and older in K-12 schools:
Dover-parkside: 13.1% Ann Arbor: 8.7%
- Percentage of people 3 years and older in undergraduate colleges:
Dover-parkside: 0.4% Ann Arbor: 25.6%
- Percentage of people 3 years and older in grad. or professional schools:
Dover-parkside: 1.8% Ann Arbor: 10.8%
- Percentage of students K-12 enrolled in private schools:
Dover-parkside: 0.0% Ann Arbor: 12.9%
Percentage of population below poverty level:
| Dover-parkside: | 7.0% |
| Ann Arbor: | 23.1% |
Median year owner moved in (as recorded in 2022):
Median year renter moved in (as recorded in 2022):
| Dover-parkside: | 1998 |
| Ann Arbor: | 2010 |
Median year renter moved in (as recorded in 2022):
| Dover-parkside: | 2014 |
| Ann Arbor: | 2022 |
Percentage of married-couple families with both working:
| Dover-parkside: | 96.8% |
| Ann Arbor: | 72.2% |
- 93.0%Utility gas
- 5.1%Electricity
- 1.0%Fuel oil, kerosene, etc.
- 0.7%Bottled, tank, or LP gas
Roads and streets:
Ivywood Dr
Length: 0.36 miles
Directions: E-W, N-S, SE-NW, SW-NE
Address range: 1700 to 1999
Directions: E-W, N-S, SE-NW, SW-NE
Address range: 1700 to 1999
Dartmoor Rd
Length: 0.34 miles
Directions: E-W, N-S, SW-NE
Address range: 547 to 899
Directions: E-W, N-S, SW-NE
Address range: 547 to 899
Peppermill Way
Length: 0.09 miles
Directions: E-W, N-S, SW-NE
Address range: 1900 to 1999
Directions: E-W, N-S, SW-NE
Address range: 1900 to 1999
Hampton Ct
Length: 0.04 miles
Direction: SE-NW
Address range: 1900 to 1949
Direction: SE-NW
Address range: 1900 to 1949
Dover Ct
Length: 0.04 miles
Directions: N-S, SE-NW
Address range: 1 to 99
Directions: N-S, SE-NW
Address range: 1 to 99