Downing Park neighborhood in Denver, Colorado (CO), 80229 detailed profile
Settings
X


Business Search - 14 Million verified businesses
Area: 0.046 square miles
Population: 322
Population density:
| Downing Park: | 6,989 people per square mile |
| Denver: | 4,651 people per square mile |

- 16649.8%White
- 14142.3%Hispanic or Latino
- 103.0%Asian
- 92.7%Black
- 41.2%Two or more races
- 30.9%Some other race

Median household income in 2022:
| Downing Park: | $76,175 |
| Denver: | $88,213 |
Distribution of median household income
![Distribution of median household income]()
- 2Less than $10,000
- 2$10,000 to $19,999
- 3$20,000 to $29,999
- 17$30,000 to $39,999
- 19$40,000 to $49,999
- 17$50,000 to $59,999
- 10$60,000 to $74,999
- 11$75,000 to $99,999
- 3$100,000 to $124,999
- 24$125,000 to $149,999
- 8$150,000 to $199,999
- 9$200,000 or more

Distribution of owner-occupied house/condo value
![Distribution of owner-occupied house/condo value]()
- 15Less than $50,000
- 3$200,000 to $249,999
- 4$250,000 to $299,999
- 32$300,000 to $399,999
- 28$400,000 to $499,999
- 29$500,000 to $749,999

Distribution of rent paid by renters
![Distribution of rent paid by renters]()
- 1Less than $100
- 7$700 to $799
- 1$800 to $899
- 1$900 to $999
- 2$1,000 to $1,249
- 14$1,250 to $1,499
- 14$1,500 to $1,999
- 13$2,000 or more

Median rent in 2022:
| Downing Park: | $2,466 |
| Denver: | $1,623 |
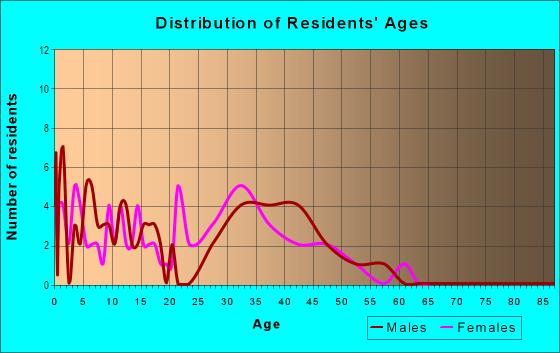
| Males: | 162 |
| Females: | 160 |
Males:
| This neighborhood: | 35.6 years |
| Whole city: | 35.2 years |
| This neighborhood: | 28.2 years |
| Whole city: | 35.1 years |
Average household size:
| Downing Park: | 3.3 people |
| Denver: | 28.0 people |
Percentage of family households:
| Downing Park: | 74.1% |
| Denver: | 35.1% |
| Here: | 62.0% |
| Denver: | 32.5% |
Percentage of married-couple families with children (among all households):
| Downing Park: | 17.9% |
| Denver: | 32.4% |
Percentage of single-mother households (among all households):
| Downing Park: | 2.2% |
| Denver: | 10.3% |
Percentage of never married males 15 years old and over:
Percentage of never married females 15 years old and over:
| Downing Park: | 19.3% |
| Denver: | 25.0% |
Percentage of never married females 15 years old and over:
| Downing Park: | 15.7% |
| city: | 20.8% |
Percentage of people that speak English not well or not at all:
| Downing Park: | 6.4% |
| Denver: | 3.9% |
Percentage of people born in this state:
Percentage of people born in another U.S. state:
Percentage of native residents but born outside the U.S.:
Percentage of foreign born residents:
| Here: | 42.2% |
| Denver: | 38.5% |
Percentage of people born in another U.S. state:
| Downing Park: | 40.5% |
| Denver: | 46.1% |
Percentage of native residents but born outside the U.S.:
| Here: | 2.1% |
| city: | 1.7% |
Percentage of foreign born residents:
| Here: | 15.2% |
| Denver: | 13.8% |

Owner-occupied
Renter-occupied


- Rooms in owner-occupied houses and condos in Downing Park
- 01 room
- 02 rooms
- 63 rooms
- 44 rooms
- 165 rooms
- 176 rooms
- 237 rooms
- 158 rooms
- 99+ rooms

- Rooms in renter-occupied apartments in Downing Park
- 11 room
- 12 rooms
- 33 rooms
- 74 rooms
- 35 rooms
- 116 rooms
- 127 rooms
- 18 rooms
- 69+ rooms
Owner-occupied
Renter-occupied

- Bedrooms in owner-occupied houses and condos in Downing Park
- 2no bedroom
- 01 bedroom
- 102 bedrooms
- 483 bedrooms
- 154 bedrooms
- 165+ bedrooms

- Bedrooms in renter-occupied apartments in Downing Park
- 1no bedroom
- 131 bedroom
- 72 bedrooms
- 123 bedrooms
- 34 bedrooms
- 05+ bedrooms
Average number of cars or other vehicles available in houses/condos:
Average number of cars or other vehicles available in apartments:
| This neighborhood: | 2.5 |
| Denver: | 1.9 |
Average number of cars or other vehicles available in apartments:
| Here: | 3.0 |
| city: | 1.3 |
Percentage of units with a mortgage:
| Downing Park: | 88.6% |
| Denver: | 75.6% |
Average estimated value of detached houses in 2022 (85.2% of all units):
| Downing Park: | $308,056 |
| Colorado: | $676,667 |

- Year house built in Downing Park
- 62020 or later
- 42010 to 2019
- 362000 to 2009
- 311990 to 1999
- 91980 to 1989
- 181970 to 1979
- 101960 to 1969
- 841950 to 1959
- 01940 to 1949
- 21939 or earlier

City-data.com crime index for city in 2020 (higher means more crime):
| City: | 519.0 |
| U.S. average: | 219.5 |
Travel time to work (commute)
![Travel time to work (commute)]()
- 75 to 9 minutes
- 610 to 14 minutes
- 715 to 19 minutes
- 1120 to 24 minutes
- 1825 to 29 minutes
- 2330 to 34 minutes
- 1135 to 39 minutes
- 340 to 44 minutes
- 1745 to 59 minutes
- 1060 to 89 minutes
- 490 or more minutes

Means of transportation to work
![Means of transportation to work]()
- 72.4%134Drove a car alone
- 13.0%24Carpooled
- 4.3%8Bus
- 2.2%4Light rail, streetcar or trolley
- 4.3%8Walked
- 2.2%4Other means
- 8.6%16Worked at home

Time leaving home to go to work
![Time leaving home to go to work]()
- 812:00 a.m. to 4:59 a.m.
- 45:00 a.m. to 5:29 a.m.
- 85:30 a.m. to 5:59 a.m.
- 146:00 a.m. to 6:29 a.m.
- 166:30 a.m. to 6:59 a.m.
- 127:00 a.m. to 7:29 a.m.
- 77:30 a.m. to 7:59 a.m.
- 118:00 a.m. to 8:29 a.m.
- 58:30 a.m. to 8:59 a.m.
- 139:00 a.m. to 9:59 a.m.
- 110:00 a.m. to 10:59 a.m.
- 111:00 a.m. to 11:59 a.m.
- 512:00 p.m. to 3:59 p.m.
- 54:00 p.m. to 11:59 p.m.

Occupations of males:
- Percentage of males in management occupations (except farmers):
Here: 8.6% city: 15.4%
- Percentage of males in architecture and engineering occupations:
Here: 6.4% city: 4.5%
- Percentage of males in community and social services occupations:
Here: 3.3% city: 0.9%
- Percentage of males in arts, design, entertainment, sports, and media occupations:
Here: 2.2% city: 3.1%
- Percentage of males in healthcare practitioners and technical occupations:
Here: 3.2% city: 3.5%
- Percentage of males in service occupations:
Here: 4.3% city: 11.9%
- Percentage of males in sales and office occupations:
Here: 38.0% city: 15.4%
- Percentage of males in construction, extraction, and maintenance occupations:
Here: 20.6% city: 8.0%
- Percentage of males in transportation occupations:
Here: 9.0% city: 4.2%
Occupations of females:
- Percentage of females in management occupations (except farmers):
Here: 13.3% city: 14.0%
- Percentage of females in business and financial operations occupations:
Here: 2.7% city: 10.0%
- Percentage of females in education, training, and library occupations:
Here: 11.7% city: 7.9%
- Percentage of females in arts, design, entertainment, sports, and media occupations:
Here: 11.4% city: 3.8%
- Percentage of females in healthcare practitioners and technical occupations:
Here: 13.4% city: 10.2%
- Percentage of females in service occupations:
Here: 32.3% city: 16.2%
- Percentage of females in sales and office occupations:
Here: 16.8% city: 21.4%
Education in this neighborhood (subdivision or community):
- Percentage of people 3 years and older in K-12 schools:
Downing Park: 22.9% Denver: 12.7%
- Percentage of people 3 years and older in undergraduate colleges:
Downing Park: 3.0% Denver: 4.1%
- Percentage of people 3 years and older in grad. or professional schools:
Downing Park: 2.0% Denver: 2.2%
- Percentage of students K-12 enrolled in private schools:
Downing Park: 5.8% Denver: 11.0%
Percentage of population below poverty level:
| Downing Park: | 12.9% |
| Denver: | 11.8% |
Median year owner moved in (as recorded in 2022):
| Downing Park: | 2007 |
| Denver: | 2014 |
Percentage of married-couple families with both working:
| Downing Park: | 70.9% |
| Denver: | 74.1% |

- 56.1%Utility gas
- 29.9%Electricity
- 7.2%Other fuel
- 2.9%No fuel used
- 2.5%Bottled, tank, or LP gas
- 1.5%Solar energy
Roads and streets:
E 96th Pl
Length: 0.28 miles
Directions: E-W, SE-NW
Address range: 1200 to 1599
Directions: E-W, SE-NW
Address range: 1200 to 1599
E 96th Dr
Length: 0.17 miles
Directions: E-W, SE-NW, SW-NE
Address range: 1300 to 1599
Directions: E-W, SE-NW, SW-NE
Address range: 1300 to 1599
Downing St
Length: 0.16 miles
Directions: N-S, SE-NW
Address range: 9600 to 9699
Directions: N-S, SE-NW
Address range: 9600 to 9699
Humboldt St
Length: 0.16 miles
Direction: N-S
Address range: 9600 to 9699
Direction: N-S
Address range: 9600 to 9699
E 96th Ave (Thornton Pkwy)
Length: 0.14 miles
Directions: E-W, SE-NW
Directions: E-W, SE-NW
Lafayette St
Length: 0.13 miles
Directions: N-S, SE-NW, SW-NE
Address range: 9617 to 9698
Directions: N-S, SE-NW, SW-NE
Address range: 9617 to 9698
Franklin St
Length: 0.13 miles
Directions: N-S, SE-NW, SW-NE
Address range: 9600 to 9699
Directions: N-S, SE-NW, SW-NE
Address range: 9600 to 9699
Marion Way
Length: 0.13 miles
Directions: N-S, SE-NW
Address range: 9601 to 9699
Directions: N-S, SE-NW
Address range: 9601 to 9699
Thornton Pkwy
Length: 0.09 miles
Directions: E-W, SE-NW
Directions: E-W, SE-NW
96th Ln
Length: 0.08 miles
Directions: E-W, SE-NW
Address range: 1400 to 1499
Directions: E-W, SE-NW
Address range: 1400 to 1499