Downtown neighborhood in Aberdeen, Washington (WA), 98520, 98550 detailed profile
Settings
X


Business Search - 14 Million verified businesses
Area: 0.466 square miles
Population: 1,658
Population density:
| Downtown: | 3,557 people per square mile |
| Aberdeen: | 1,597 people per square mile |

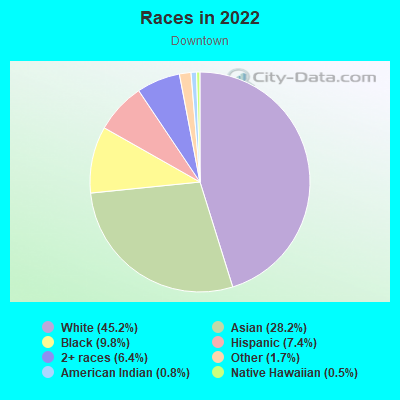
- 1,14965.1%White
- 33619.0%Hispanic or Latino
- 1086.1%Two or more races
- 704.0%Black
- 452.6%Native Hawaiian and Other
Pacific Islander - 331.9%Asian
- 231.3%American Indian
Median household income in 2022:
| Downtown: | $53,802 |
| Aberdeen: | $50,008 |
Distribution of median household income
![Distribution of median household income]()
- 94Less than $10,000
- 137$10,000 to $19,999
- 139$20,000 to $29,999
- 81$30,000 to $39,999
- 85$40,000 to $49,999
- 40$50,000 to $59,999
- 35$60,000 to $74,999
- 91$75,000 to $99,999
- 55$100,000 to $124,999
- 28$125,000 to $149,999
- 73$150,000 to $199,999
- 8$200,000 or more

Distribution of owner-occupied house/condo value
![Distribution of owner-occupied house/condo value]()
- 51Less than $50,000
- 88$50,000 to $99,999
- 103$100,000 to $149,999
- 60$150,000 to $199,999
- 53$200,000 to $249,999
- 43$250,000 to $299,999
- 65$300,000 to $399,999
- 5$400,000 to $499,999
- 12$500,000 to $749,999
- 6$750,000 to $999,999

Distribution of rent paid by renters
![Distribution of rent paid by renters]()
- 34Less than $100
- 76$100 to $199
- 19$200 to $299
- 124$300 to $399
- 94$400 to $499
- 129$500 to $599
- 164$600 to $699
- 110$700 to $799
- 40$800 to $899
- 57$900 to $999
- 42$1,000 to $1,249
- 17$1,250 to $1,499
- 8$1,500 to $1,999
- 25$2,000 or more

Median rent in 2022:
| Downtown: | $650 |
| Aberdeen: | $740 |
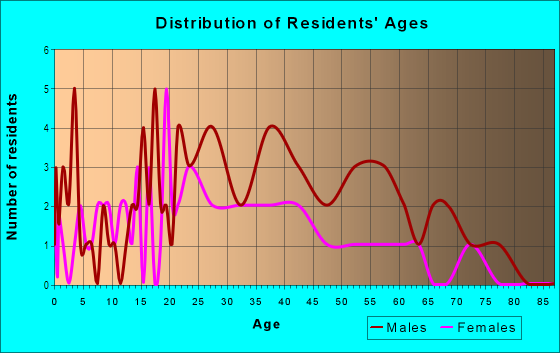
| Males: | 840 |
| Females: | 817 |
Males:
| This neighborhood: | 30.1 years |
| Whole city: | 35.7 years |
| This neighborhood: | 42.5 years |
| Whole city: | 38.3 years |
Average household size:
| Downtown: | 2.9 people |
| Aberdeen: | 2.6 people |
Percentage of family households:
| Downtown: | 35.6% |
| Aberdeen: | 40.4% |
| Here: | 24.3% |
| Aberdeen: | 35.7% |
Percentage of married-couple families with children (among all households):
| Downtown: | 28.8% |
| Aberdeen: | 20.6% |
Percentage of single-mother households (among all households):
| Downtown: | 7.7% |
| Aberdeen: | 9.3% |
Percentage of never married males 15 years old and over:
Percentage of never married females 15 years old and over:
| Downtown: | 25.3% |
| Aberdeen: | 22.1% |
Percentage of never married females 15 years old and over:
| Downtown: | 19.4% |
| city: | 17.9% |
Percentage of people that speak English not well or not at all:
| Downtown: | 7.5% |
| Aberdeen: | 3.7% |
Percentage of people born in this state:
Percentage of people born in another U.S. state:
Percentage of native residents but born outside the U.S.:
Percentage of foreign born residents:
| Here: | 59.1% |
| Aberdeen: | 60.8% |
Percentage of people born in another U.S. state:
| Downtown: | 28.4% |
| Aberdeen: | 29.8% |
Percentage of native residents but born outside the U.S.:
| Here: | 1.0% |
| city: | 1.4% |
Percentage of foreign born residents:
| Here: | 11.6% |
| Aberdeen: | 7.9% |
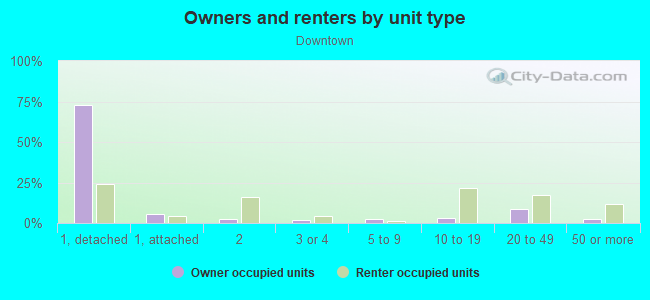
Owner-occupied
Renter-occupied

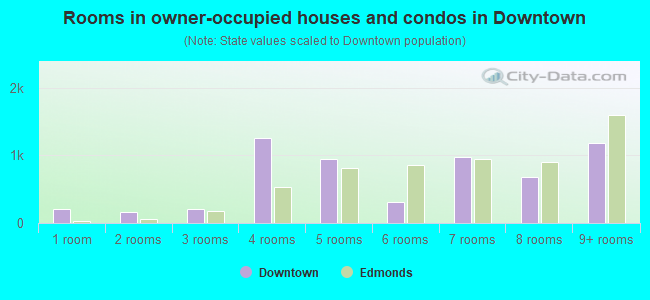
- Rooms in owner-occupied houses and condos in Downtown
- 01 room
- 02 rooms
- 153 rooms
- 64 rooms
- 165 rooms
- 586 rooms
- 987 rooms
- 928 rooms
- 419+ rooms
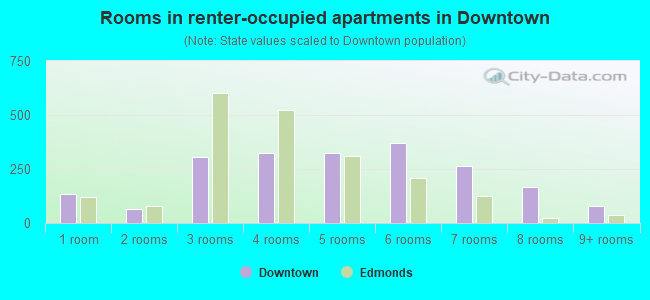
- Rooms in renter-occupied apartments in Downtown
- 741 room
- 342 rooms
- 1093 rooms
- 1514 rooms
- 735 rooms
- 1366 rooms
- 217 rooms
- 108 rooms
- 09+ rooms
Owner-occupied
Renter-occupied
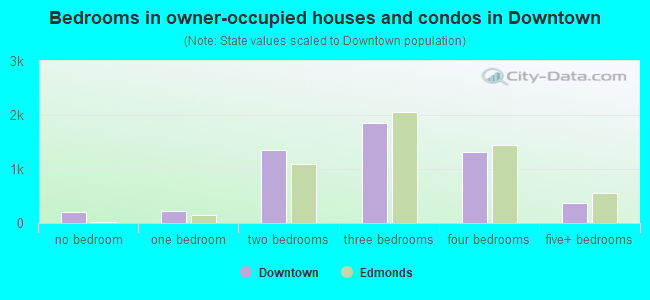
- Bedrooms in owner-occupied houses and condos in Downtown
- 0no bedroom
- 181 bedroom
- 502 bedrooms
- 823 bedrooms
- 924 bedrooms
- 525+ bedrooms
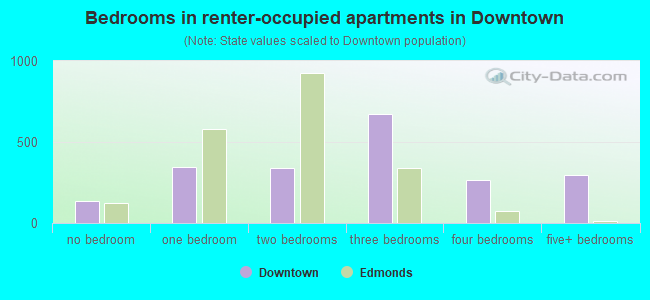
- Bedrooms in renter-occupied apartments in Downtown
- 84no bedroom
- 1391 bedroom
- 1312 bedrooms
- 913 bedrooms
- 214 bedrooms
- 05+ bedrooms
Average number of cars or other vehicles available in houses/condos:
Average number of cars or other vehicles available in apartments:
| This neighborhood: | 2.3 |
| Aberdeen: | 2.2 |
Average number of cars or other vehicles available in apartments:
| Here: | 1.1 |
| city: | 1.4 |
Percentage of units with a mortgage:
| Downtown: | 60.4% |
| Aberdeen: | 56.6% |
Average estimated value of detached houses in 2022 (47.3% of all units):
| Downtown: | $218,809 |
| Washington: | $734,307 |
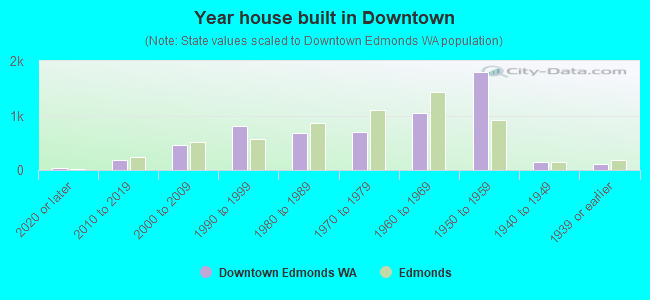
- Year house built in Downtown
- 02020 or later
- 222010 to 2019
- 232000 to 2009
- 311990 to 1999
- 961980 to 1989
- 1441970 to 1979
- 671960 to 1969
- 491950 to 1959
- 741940 to 1949
- 4571939 or earlier
City-data.com crime index for city in 2020 (higher means more crime):
| City: | 304.2 |
| U.S. average: | 219.5 |
Travel time to work (commute)
![Travel time to work (commute)]()
- 53Less than 5 minutes
- 2245 to 9 minutes
- 9010 to 14 minutes
- 9615 to 19 minutes
- 1120 to 24 minutes
- 1825 to 29 minutes
- 4130 to 34 minutes
- 1635 to 39 minutes
- 3440 to 44 minutes
- 8645 to 59 minutes
- 7460 to 89 minutes
- 3190 or more minutes

Means of transportation to work
![Means of transportation to work]()
- 79.2%561Drove a car alone
- 10.6%75Carpooled
- 3.4%24Bus
- 25.5%181Bicycle
- 6.1%43Walked
- 4.5%32Other means
- 8.2%58Worked at home

Time leaving home to go to work
![Time leaving home to go to work]()
- 3212:00 a.m. to 4:59 a.m.
- 435:00 a.m. to 5:29 a.m.
- 155:30 a.m. to 5:59 a.m.
- 466:00 a.m. to 6:29 a.m.
- 806:30 a.m. to 6:59 a.m.
- 847:00 a.m. to 7:29 a.m.
- 1187:30 a.m. to 7:59 a.m.
- 598:00 a.m. to 8:29 a.m.
- 458:30 a.m. to 8:59 a.m.
- 119:00 a.m. to 9:59 a.m.
- 2710:00 a.m. to 10:59 a.m.
- 3811:00 a.m. to 11:59 a.m.
- 5812:00 p.m. to 3:59 p.m.
- 464:00 p.m. to 11:59 p.m.

Occupations of males:
- Percentage of males in management occupations (except farmers):
Here: 15.3% city: 6.1%
- Percentage of males in architecture and engineering occupations:
Here: 2.1% city: 2.0%
- Percentage of males in life, physical, and social science occupations:
Here: 2.3% city: 2.2%
- Percentage of males in service occupations:
Here: 15.3% city: 23.3%
- Percentage of males in sales and office occupations:
Here: 7.6% city: 17.1%
- Percentage of males in farming, fishing, and forestry occupations:
Here: 8.6% city: 2.9%
- Percentage of males in construction, extraction, and maintenance occupations:
Here: 15.6% city: 9.6%
- Percentage of males in production occupations:
Here: 6.0% city: 8.6%
- Percentage of males in transportation occupations:
Here: 2.9% city: 5.6%
- Percentage of males in material moving occupations:
Here: 15.5% city: 10.5%
Occupations of females:
- Percentage of females in management occupations (except farmers):
Here: 6.1% city: 8.0%
- Percentage of females in community and social services occupations:
Here: 2.8% city: 1.4%
- Percentage of females in education, training, and library occupations:
Here: 9.0% city: 8.6%
- Percentage of females in healthcare practitioners and technical occupations:
Here: 1.4% city: 5.8%
- Percentage of females in service occupations:
Here: 55.1% city: 35.0%
- Percentage of females in sales and office occupations:
Here: 10.6% city: 23.8%
- Percentage of females in farming, fishing, and forestry occupations:
Here: 4.9% city: 3.0%
- Percentage of females in production occupations:
Here: 2.0% city: 1.5%
- Percentage of females in material moving occupations:
Here: 10.1% city: 2.6%
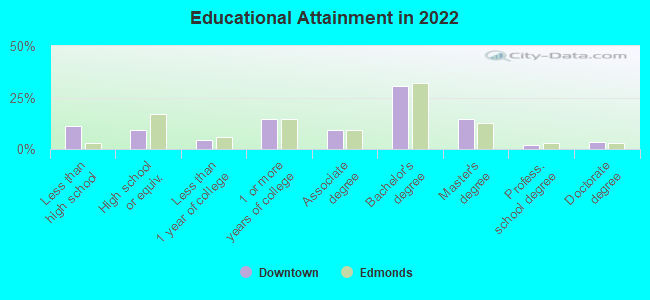
Education in this neighborhood (subdivision or community):
- Percentage of people 3 years and older in K-12 schools:
Downtown: 27.2% Aberdeen: 20.6%
- Percentage of people 3 years and older in undergraduate colleges:
Downtown: 6.6% Aberdeen: 2.8%
- Percentage of people 3 years and older in grad. or professional schools:
Downtown: 0.0% Aberdeen: 0.4%
- Percentage of students K-12 enrolled in private schools:
Downtown: 30.5% Aberdeen: 5.2%
Percentage of population below poverty level:
| Downtown: | 29.6% |
| Aberdeen: | 21.0% |
Median year owner moved in (as recorded in 2022):
Median year renter moved in (as recorded in 2022):
| Downtown: | 2006 |
| Aberdeen: | 2007 |
Median year renter moved in (as recorded in 2022):
| Downtown: | 2016 |
| Aberdeen: | 2016 |
Percentage of married-couple families with both working:
| Downtown: | 150.7% |
| Aberdeen: | 76.5% |
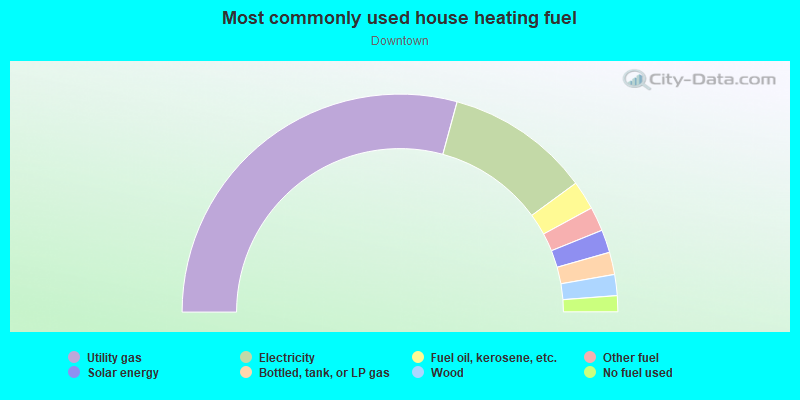
- 50.2%Electricity
- 17.7%Utility gas
- 11.9%Other fuel
- 9.6%Wood
- 4.9%Bottled, tank, or LP gas
- 3.4%No fuel used
- 2.3%Fuel oil, kerosene, etc.
Highways in this neighborhood:
US Hwy 101 (W Wishkah St)
Length: 0.96 miles
Direction: SW-NE
Address range: 100 to 1199
Direction: SW-NE
Address range: 100 to 1199
US Hwy 12 (E Wishkah St)
Length: 0.50 miles
Directions: E-W, SW-NE
Address range: 100 to 574
Directions: E-W, SW-NE
Address range: 100 to 574
US Hwy 101 (E Heron St)
Length: 0.45 miles
Directions: E-W, SW-NE
Address range: 100 to 599
Directions: E-W, SW-NE
Address range: 100 to 599
US Hwy 101
Length: 0.28 miles
Directions: E-W, SE-NW
Directions: E-W, SE-NW
S H St (US Hwy 101)
Length: 0.24 miles
Direction: SE-NW
Address range: 200 to 499
Direction: SE-NW
Address range: 200 to 499
S Alder St (US Hwy 101)
Length: 0.23 miles
Direction: SE-NW
Direction: SE-NW
Roads and streets:
W State St
Length: 1.34 miles
Directions: E-W, N-S, SE-NW, SW-NE
Address range: 100 to 1099
Directions: E-W, N-S, SE-NW, SW-NE
Address range: 100 to 1099
W Heron St
Length: 1.07 miles
Direction: SW-NE
Address range: 100 to 1299
Direction: SW-NE
Address range: 100 to 1299
River St
Length: 0.38 miles
Directions: SE-NW, SW-NE
Directions: SE-NW, SW-NE
E State St
Length: 0.36 miles
Direction: SW-NE
Address range: 300 to 499
Direction: SW-NE
Address range: 300 to 499
S G St
Length: 0.33 miles
Direction: SE-NW
Address range: 200 to 299
Direction: SE-NW
Address range: 200 to 299
S Broadway St
Length: 0.29 miles
Directions: E-W, SE-NW
Address range: 200 to 499
Directions: E-W, SE-NW
Address range: 200 to 499
S Washington St
Length: 0.25 miles
Direction: SE-NW
Address range: 200 to 399
Direction: SE-NW
Address range: 200 to 399
S F St
Length: 0.25 miles
Direction: SE-NW
Address range: 200 to 599
Direction: SE-NW
Address range: 200 to 599
S K St
Length: 0.24 miles
Direction: SE-NW
Address range: 200 to 299
Direction: SE-NW
Address range: 200 to 299
S M St
Length: 0.24 miles
Direction: SE-NW
Address range: 200 to 299
Direction: SE-NW
Address range: 200 to 299
S Park St
Length: 0.23 miles
Direction: SE-NW
Address range: 201 to 499
Direction: SE-NW
Address range: 201 to 499
S Michigan St
Length: 0.23 miles
Direction: SE-NW
Address range: 200 to 499
Direction: SE-NW
Address range: 200 to 499
S I St
Length: 0.22 miles
Direction: SE-NW
Address range: 200 to 399
Direction: SE-NW
Address range: 200 to 399
S Monroe St
Length: 0.21 miles
Direction: SE-NW
Address range: 200 to 499
Direction: SE-NW
Address range: 200 to 499
S Lincoln St
Length: 0.21 miles
Direction: SE-NW
Address range: 300 to 399
Direction: SE-NW
Address range: 300 to 399
S Jefferson St
Length: 0.20 miles
Direction: SE-NW
Address range: 200 to 499
Direction: SE-NW
Address range: 200 to 499
S L St
Length: 0.20 miles
Direction: SE-NW
Address range: 200 to 499
Direction: SE-NW
Address range: 200 to 499
S Garfield St
Length: 0.06 miles
Direction: SE-NW
Direction: SE-NW
S Division St
Length: 0.05 miles
Direction: N-S
Direction: N-S
Railroad features:
Puget Sound and Pacific RR
Length: 3.34 miles
Directions: E-W, N-S, SW-NE
Directions: E-W, N-S, SW-NE
Abandoned RR
Length: 0.17 miles
Direction: E-W
Direction: E-W
Other features:
Wishkah Riv
Length: 0.17 miles
Direction: SE-NW
Direction: SE-NW