Downtown neighborhood in Albany, California (CA), 94706 detailed profile
Settings
X


Business Search - 14 Million verified businesses
Area: 0.329 square miles
Population: 5,438
Population density:
| Downtown: | 16,513 people per square mile |
| Albany: | 11,771 people per square mile |

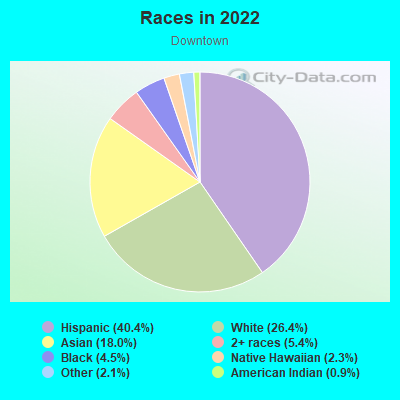
- 2,14837.3%White
- 1,96634.2%Asian
- 66911.6%Two or more races
- 3636.3%Black
- 3405.9%Hispanic or Latino
- 1152.0%Native Hawaiian and Other
Pacific Islander - 921.6%Some other race
- 611.1%American Indian
Median household income in 2022:
| Downtown: | $127,578 |
| Albany: | $124,469 |
Distribution of median household income
![Distribution of median household income]()
- 131Less than $10,000
- 122$10,000 to $19,999
- 142$20,000 to $29,999
- 175$30,000 to $39,999
- 96$40,000 to $49,999
- 76$50,000 to $59,999
- 108$60,000 to $74,999
- 278$75,000 to $99,999
- 230$100,000 to $124,999
- 167$125,000 to $149,999
- 360$150,000 to $199,999
- 638$200,000 or more

Distribution of owner-occupied house/condo value
![Distribution of owner-occupied house/condo value]()
- 299Less than $50,000
- 51$100,000 to $149,999
- 87$300,000 to $399,999
- 38$400,000 to $499,999
- 132$500,000 to $749,999
- 160$750,000 to $999,999
- 543$1,000,000 or more

Distribution of rent paid by renters
![Distribution of rent paid by renters]()
- 19$300 to $399
- 28$800 to $899
- 73$1,000 to $1,249
- 64$1,250 to $1,499
- 217$1,500 to $1,999
- 950$2,000 or more

Median rent in 2022:
| Downtown: | $2,247 |
| Albany: | $2,001 |
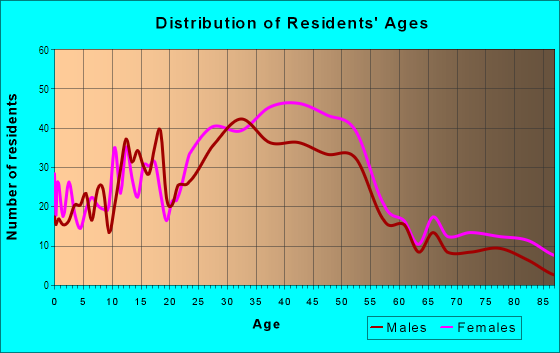
| Males: | 2,530 |
| Females: | 2,907 |
Males:
| This neighborhood: | 37.5 years |
| Whole city: | 36.7 years |
| This neighborhood: | 41.9 years |
| Whole city: | 37.8 years |
Average household size:
| Downtown: | 2.5 people |
| Albany: | 2.5 people |
Percentage of family households:
| Downtown: | 53.4% |
| Albany: | 53.9% |
| Here: | 44.9% |
| Albany: | 52.7% |
Percentage of married-couple families with children (among all households):
| Downtown: | 30.3% |
| Albany: | 30.7% |
Percentage of single-mother households (among all households):
| Downtown: | 8.0% |
| Albany: | 6.2% |
Percentage of never married males 15 years old and over:
Percentage of never married females 15 years old and over:
| Downtown: | 17.9% |
| Albany: | 15.4% |
Percentage of never married females 15 years old and over:
| Downtown: | 17.6% |
| city: | 16.2% |
Percentage of people that speak English not well or not at all:
| Downtown: | 3.8% |
| Albany: | 3.4% |
Percentage of people born in this state:
Percentage of people born in another U.S. state:
Percentage of native residents but born outside the U.S.:
Percentage of foreign born residents:
| Here: | 38.3% |
| Albany: | 46.0% |
Percentage of people born in another U.S. state:
| Downtown: | 26.2% |
| Albany: | 25.0% |
Percentage of native residents but born outside the U.S.:
| Here: | 2.1% |
| city: | 2.0% |
Percentage of foreign born residents:
| Here: | 33.4% |
| Albany: | 27.0% |
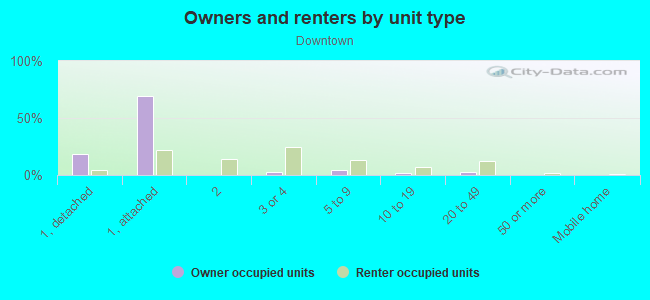
Owner-occupied
Renter-occupied

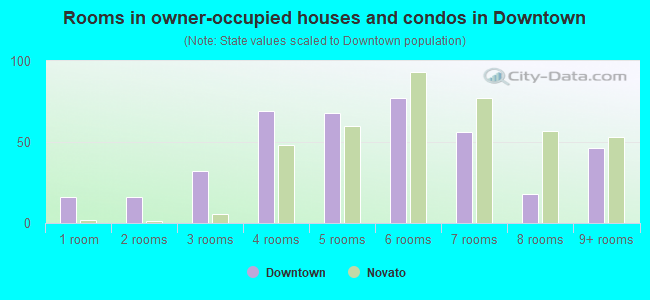
- Rooms in owner-occupied houses and condos in Downtown
- 211 room
- 152 rooms
- 1203 rooms
- 1594 rooms
- 2415 rooms
- 1406 rooms
- 837 rooms
- 1168 rooms
- 949+ rooms
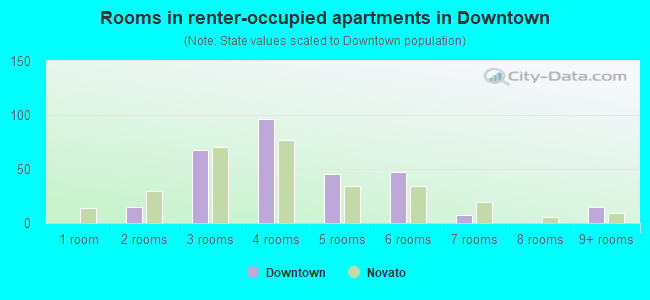
- Rooms in renter-occupied apartments in Downtown
- 351 room
- 1232 rooms
- 2643 rooms
- 6154 rooms
- 2425 rooms
- 456 rooms
- 757 rooms
- 248 rooms
- 19+ rooms
Owner-occupied
Renter-occupied
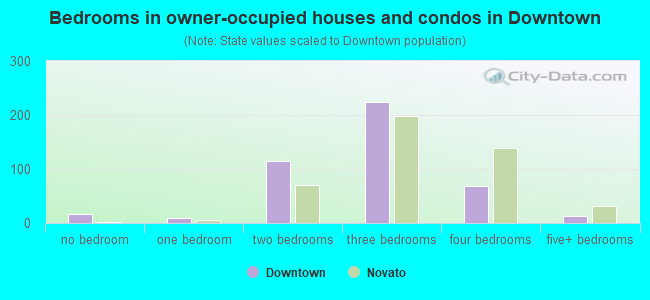
- Bedrooms in owner-occupied houses and condos in Downtown
- 35no bedroom
- 1151 bedroom
- 4192 bedrooms
- 2433 bedrooms
- 894 bedrooms
- 815+ bedrooms
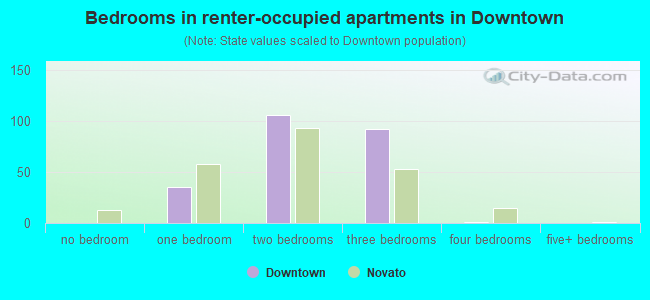
- Bedrooms in renter-occupied apartments in Downtown
- 36no bedroom
- 2971 bedroom
- 8162 bedrooms
- 1203 bedrooms
- 514 bedrooms
- 15+ bedrooms
Average number of cars or other vehicles available in houses/condos:
Average number of cars or other vehicles available in apartments:
| This neighborhood: | 1.6 |
| Albany: | 1.7 |
Average number of cars or other vehicles available in apartments:
| Here: | 1.2 |
| city: | 1.2 |
Percentage of units with a mortgage:
| Downtown: | 70.3% |
| Albany: | 63.1% |
Housing prices:
- Average estimated value of detached houses in 2022 (42.1% of all units):
Downtown: $1,158,738 Albany: $1,319,775
- Average estimated value of townhouses or other attached units in 2022 (6.3% of all units):
This neighborhood: $256,916 city: $961,729
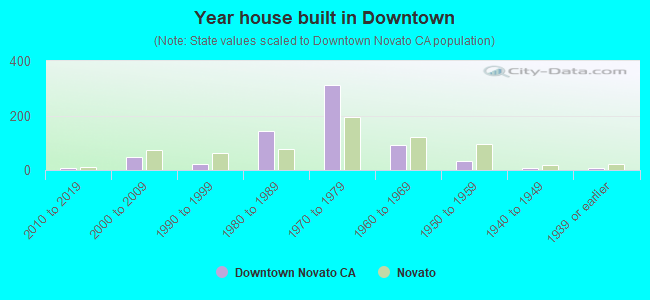
- Year house built in Downtown
- 02020 or later
- 772010 to 2019
- 1442000 to 2009
- 411990 to 1999
- 1381980 to 1989
- 2461970 to 1979
- 3241960 to 1969
- 3731950 to 1959
- 2821940 to 1949
- 8171939 or earlier
City-data.com crime index for city in 2020 (higher means more crime):
| City: | 155.8 |
| U.S. average: | 219.5 |
Travel time to work (commute)
![Travel time to work (commute)]()
- 213Less than 5 minutes
- 2965 to 9 minutes
- 29510 to 14 minutes
- 30315 to 19 minutes
- 45120 to 24 minutes
- 9825 to 29 minutes
- 40630 to 34 minutes
- 8435 to 39 minutes
- 19740 to 44 minutes
- 25445 to 59 minutes
- 44560 to 89 minutes
- 10490 or more minutes

Means of transportation to work
![Means of transportation to work]()
- 44.2%1,380Drove a car alone
- 3.4%106Carpooled
- 6.6%205Bus
- 10.0%311Subway or elevated rail
- 3.2%99Long-distance train or commuter rail
- 5.5%171Light rail, streetcar or trolley
- 0.6%18Ferryboat
- 1.5%46Taxi
- 1.1%35Motorcycle
- 2.0%61Bicycle
- 6.4%200Walked
- 0.6%19Other means
- 26.7%835Worked at home

Time leaving home to go to work
![Time leaving home to go to work]()
- 8012:00 a.m. to 4:59 a.m.
- 745:00 a.m. to 5:29 a.m.
- 1225:30 a.m. to 5:59 a.m.
- 2066:00 a.m. to 6:29 a.m.
- 2756:30 a.m. to 6:59 a.m.
- 3637:00 a.m. to 7:29 a.m.
- 2567:30 a.m. to 7:59 a.m.
- 5788:00 a.m. to 8:29 a.m.
- 2808:30 a.m. to 8:59 a.m.
- 3209:00 a.m. to 9:59 a.m.
- 12710:00 a.m. to 10:59 a.m.
- 25011:00 a.m. to 11:59 a.m.
- 24212:00 p.m. to 3:59 p.m.
- 1384:00 p.m. to 11:59 p.m.

Occupations of males:
- Percentage of males in management occupations (except farmers):
Here: 12.5% city: 14.2%
- Percentage of males in business and financial operations occupations:
Here: 5.9% city: 5.6%
- Percentage of males in computer and mathematical occupations:
Here: 6.7% city: 9.7%
- Percentage of males in architecture and engineering occupations:
Here: 9.1% city: 7.5%
- Percentage of males in life, physical, and social science occupations:
Here: 6.8% city: 7.6%
- Percentage of males in legal occupations:
Here: 4.0% city: 2.8%
- Percentage of males in education, training, and library occupations:
Here: 5.8% city: 12.0%
- Percentage of males in arts, design, entertainment, sports, and media occupations:
Here: 5.0% city: 6.3%
- Percentage of males in healthcare practitioners and technical occupations:
Here: 3.7% city: 2.3%
- Percentage of males in service occupations:
Here: 11.4% city: 6.5%
- Percentage of males in sales and office occupations:
Here: 19.4% city: 14.4%
- Percentage of males in construction, extraction, and maintenance occupations:
Here: 1.4% city: 3.3%
- Percentage of males in production occupations:
Here: 3.2% city: 2.1%
- Percentage of males in transportation occupations:
Here: 1.9% city: 1.5%
- Percentage of males in material moving occupations:
Here: 1.7% city: 2.0%
Occupations of females:
- Percentage of females in management occupations (except farmers):
Here: 11.7% city: 10.5%
- Percentage of females in business and financial operations occupations:
Here: 13.2% city: 13.0%
- Percentage of females in computer and mathematical occupations:
Here: 4.6% city: 4.3%
- Percentage of females in architecture and engineering occupations:
Here: 2.1% city: 3.7%
- Percentage of females in life, physical, and social science occupations:
Here: 1.8% city: 5.6%
- Percentage of females in community and social services occupations:
Here: 3.4% city: 2.5%
- Percentage of females in legal occupations:
Here: 2.4% city: 4.1%
- Percentage of females in education, training, and library occupations:
Here: 10.1% city: 15.8%
- Percentage of females in arts, design, entertainment, sports, and media occupations:
Here: 9.2% city: 5.8%
- Percentage of females in healthcare practitioners and technical occupations:
Here: 8.3% city: 7.9%
- Percentage of females in service occupations:
Here: 19.1% city: 12.1%
- Percentage of females in sales and office occupations:
Here: 14.1% city: 13.8%
Percentage of people 16-64 in Armed Forces:
| Downtown: | 0.0% |
| Albany: | 0.1% |
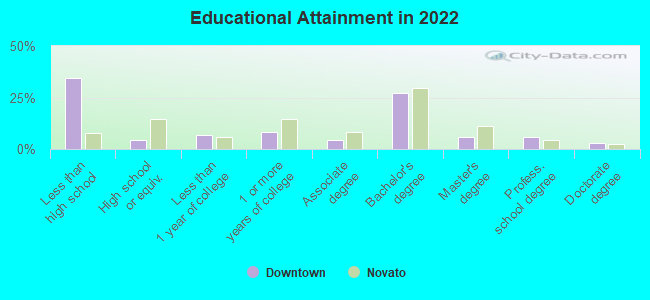
Education in this neighborhood (subdivision or community):
- Percentage of people 3 years and older in K-12 schools:
Downtown: 25.3% Albany: 18.5%
- Percentage of people 3 years and older in undergraduate colleges:
Downtown: 7.1% Albany: 6.9%
- Percentage of people 3 years and older in grad. or professional schools:
Downtown: 1.9% Albany: 5.0%
- Percentage of students K-12 enrolled in private schools:
Downtown: 17.4% Albany: 7.7%
Percentage of population below poverty level:
| Downtown: | 6.1% |
| Albany: | 9.1% |
Median year owner moved in (as recorded in 2022):
Median year renter moved in (as recorded in 2022):
| Downtown: | 2004 |
| Albany: | 2002 |
Median year renter moved in (as recorded in 2022):
| Downtown: | 2016 |
| Albany: | 2018 |
Percentage of married-couple families with both working:
| Downtown: | 78.2% |
| Albany: | 74.0% |

- 65.4%Utility gas
- 27.0%Electricity
- 3.9%No fuel used
- 2.0%Solar energy
- 1.6%Bottled, tank, or LP gas
Roads and streets:
San Pablo Ave
Length: 1.33 miles
Direction: N-S
Address range: 501 to 1049
Direction: N-S
Address range: 501 to 1049
Solano Ave
Length: 0.85 miles
Direction: E-W
Address range: 1022 to 1299
Direction: E-W
Address range: 1022 to 1299
Kains Ave
Length: 0.83 miles
Direction: N-S
Address range: 400 to 999
Direction: N-S
Address range: 400 to 999
Cornell Ave
Length: 0.82 miles
Direction: N-S
Address range: 400 to 999
Direction: N-S
Address range: 400 to 999
Adams St
Length: 0.76 miles
Directions: N-S, SE-NW
Address range: 400 to 999
Directions: N-S, SE-NW
Address range: 400 to 999
Talbot Ave
Length: 0.73 miles
Direction: N-S
Address range: 500 to 999
Direction: N-S
Address range: 500 to 999
Stannage Ave
Length: 0.73 miles
Direction: N-S
Address range: 500 to 999
Direction: N-S
Address range: 500 to 999
Masonic Ave
Length: 0.73 miles
Direction: N-S
Address range: 500 to 999
Direction: N-S
Address range: 500 to 999
Evelyn Ave
Length: 0.73 miles
Direction: N-S
Address range: 500 to 999
Direction: N-S
Address range: 500 to 999
Marin Ave
Length: 0.69 miles
Directions: E-W, N-S, SE-NW
Address range: 1100 to 1279
Directions: E-W, N-S, SE-NW
Address range: 1100 to 1279
Washington Ave
Length: 0.46 miles
Direction: E-W
Address range: 1019 to 1266
Direction: E-W
Address range: 1019 to 1266
Portland Ave
Length: 0.38 miles
Direction: E-W
Address range: 1100 to 1252
Direction: E-W
Address range: 1100 to 1252
Garfield Ave
Length: 0.37 miles
Direction: E-W
Address range: 1101 to 1299
Direction: E-W
Address range: 1101 to 1299
Brighton Ave
Length: 0.37 miles
Direction: E-W
Address range: 1100 to 1253
Direction: E-W
Address range: 1100 to 1253
Buchanan St
Length: 0.07 miles
Direction: E-W
Address range: 1030 to 1099
Direction: E-W
Address range: 1030 to 1099
Clay St
Length: 0.06 miles
Direction: E-W
Address range: 1036 to 1099
Direction: E-W
Address range: 1036 to 1099
Castro St
Length: 0.06 miles
Direction: E-W
Address range: 1029 to 1099
Direction: E-W
Address range: 1029 to 1099
Railroad features:
Bay Area Rapid Transit RR
Length: 0.56 miles
Directions: N-S, SE-NW
Directions: N-S, SE-NW