Downtown neighborhood in Billings, Montana (MT), 59101 detailed profile
Settings
X


Business Search - 14 Million verified businesses
Area: 0.262 square miles
Population: 975
Population density:
| Downtown: | 3,720 people per square mile |
| Billings: | 3,559 people per square mile |

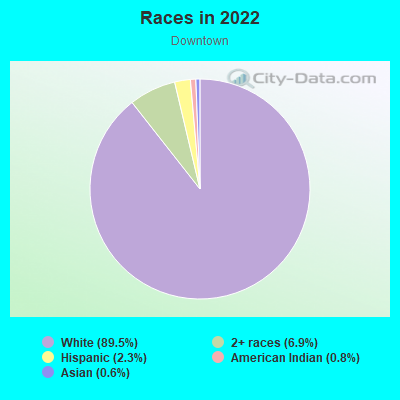
- 66268.0%White
- 17217.7%Two or more races
- 10010.3%American Indian
- 353.6%Hispanic or Latino
- 40.4%Black
Median household income in 2022:
| Downtown: | $25,978 |
| Billings: | $77,711 |
Distribution of median household income
![Distribution of median household income]()
- 110Less than $10,000
- 67$10,000 to $19,999
- 92$20,000 to $29,999
- 98$30,000 to $39,999
- 19$40,000 to $49,999
- 11$50,000 to $59,999
- 16$60,000 to $74,999
- 22$75,000 to $99,999
- 11$100,000 to $124,999
- 50$200,000 or more

Distribution of owner-occupied house/condo value
![Distribution of owner-occupied house/condo value]()
- 13Less than $50,000
- 2$50,000 to $99,999
- 76$100,000 to $149,999
- 16$150,000 to $199,999
- 14$200,000 to $249,999
- 50$250,000 to $299,999

Distribution of rent paid by renters
![Distribution of rent paid by renters]()
- 14$100 to $199
- 38$300 to $399
- 95$400 to $499
- 81$500 to $599
- 21$600 to $699
- 59$700 to $799
- 19$800 to $899

Median rent in 2022:
| Downtown: | $513 |
| Billings: | $981 |
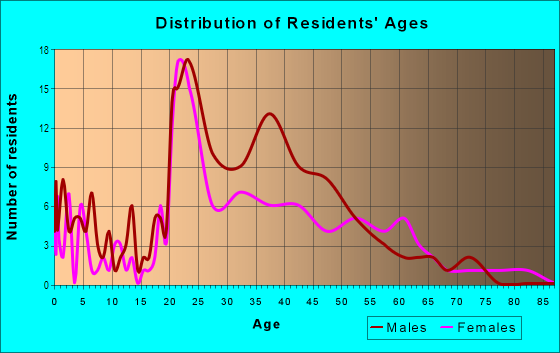
| Males: | 537 |
| Females: | 438 |
Males:
| This neighborhood: | 43.2 years |
| Whole city: | 36.4 years |
| This neighborhood: | 54.5 years |
| Whole city: | 40.9 years |
Average household size:
| Downtown: | 1.9 people |
| Billings: | 2.3 people |
Percentage of family households:
| Downtown: | 20.4% |
| Billings: | 39.9% |
| Here: | 6.6% |
| Billings: | 43.8% |
Percentage of married-couple families with children (among all households):
| Downtown: | 0.0% |
| Billings: | 31.1% |
Percentage of single-mother households (among all households):
| Downtown: | 0.0% |
| Billings: | 6.3% |
Percentage of never married males 15 years old and over:
Percentage of never married females 15 years old and over:
| Downtown: | 25.0% |
| Billings: | 18.1% |
Percentage of never married females 15 years old and over:
| Downtown: | 6.0% |
| city: | 14.0% |
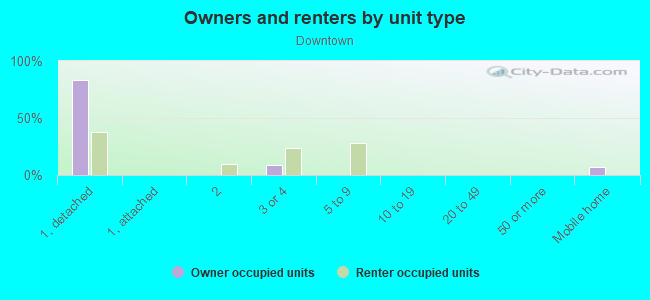
Owner-occupied
Renter-occupied

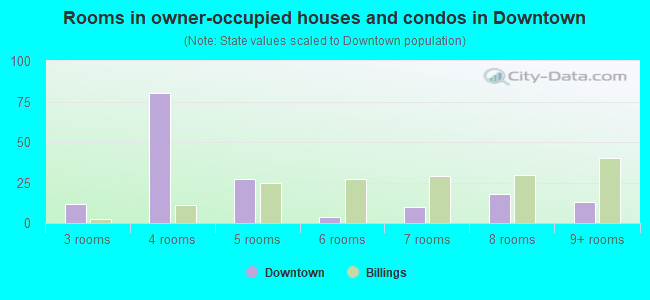
- Rooms in owner-occupied houses and condos in Downtown
- 01 room
- 02 rooms
- 123 rooms
- 804 rooms
- 275 rooms
- 46 rooms
- 107 rooms
- 188 rooms
- 139+ rooms
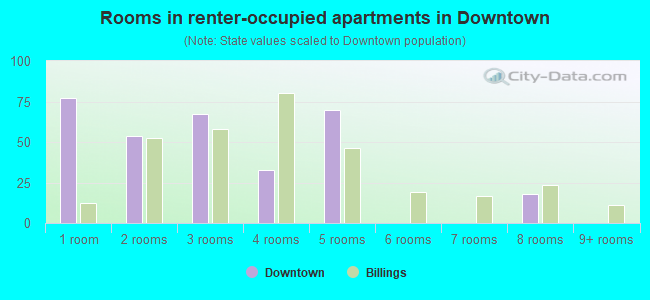
- Rooms in renter-occupied apartments in Downtown
- 771 room
- 542 rooms
- 673 rooms
- 334 rooms
- 705 rooms
- 06 rooms
- 07 rooms
- 188 rooms
- 09+ rooms
Owner-occupied
Renter-occupied
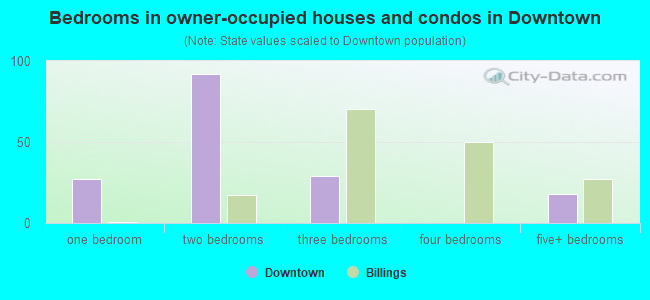
- Bedrooms in owner-occupied houses and condos in Downtown
- 0no bedroom
- 271 bedroom
- 922 bedrooms
- 293 bedrooms
- 04 bedrooms
- 185+ bedrooms
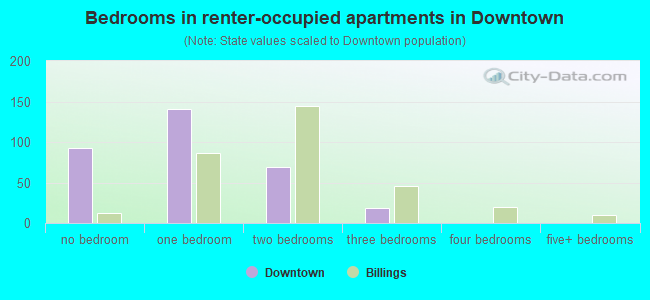
- Bedrooms in renter-occupied apartments in Downtown
- 92no bedroom
- 1411 bedroom
- 692 bedrooms
- 183 bedrooms
- 04 bedrooms
- 05+ bedrooms
Average number of cars or other vehicles available in houses/condos:
Average number of cars or other vehicles available in apartments:
| This neighborhood: | 2.2 |
| Billings: | 2.2 |
Average number of cars or other vehicles available in apartments:
| Here: | 0.7 |
| city: | 1.4 |
Percentage of units with a mortgage:
| Downtown: | 53.2% |
| Billings: | 56.8% |
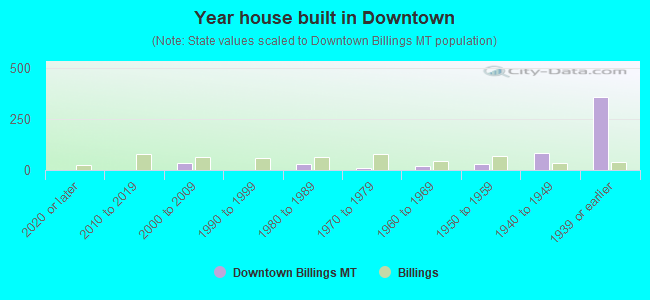
- Year house built in Downtown
- 02020 or later
- 02010 to 2019
- 322000 to 2009
- 01990 to 1999
- 271980 to 1989
- 121970 to 1979
- 181960 to 1969
- 271950 to 1959
- 811940 to 1949
- 3561939 or earlier
City-data.com crime index for city in 2020 (higher means more crime):
| City: | 490.8 |
| U.S. average: | 219.5 |
Means of transportation to work
![Means of transportation to work]()
- 35.8%152Drove a car alone
- 14.4%61Carpooled
- 6.1%26Bicycle
- 33.2%141Walked
- 5.4%23Other means
- 4.2%18Worked at home

Occupations of males:
- Percentage of males in management occupations (except farmers):
Here: 9.3% city: 11.5%
- Percentage of males in service occupations:
Here: 6.7% city: 13.6%
- Percentage of males in sales and office occupations:
Here: 4.7% city: 18.1%
- Percentage of males in construction, extraction, and maintenance occupations:
Here: 14.0% city: 10.7%
- Percentage of males in production occupations:
Here: 48.7% city: 4.9%
- Percentage of males in transportation occupations:
Here: 6.7% city: 6.5%
- Percentage of males in material moving occupations:
Here: 10.0% city: 5.0%
Occupations of females:
- Percentage of females in healthcare practitioners and technical occupations:
Here: 9.6% city: 14.3%
- Percentage of females in service occupations:
Here: 68.8% city: 20.7%
- Percentage of females in sales and office occupations:
Here: 17.6% city: 27.7%
- Percentage of females in production occupations:
Here: 4.0% city: 2.0%
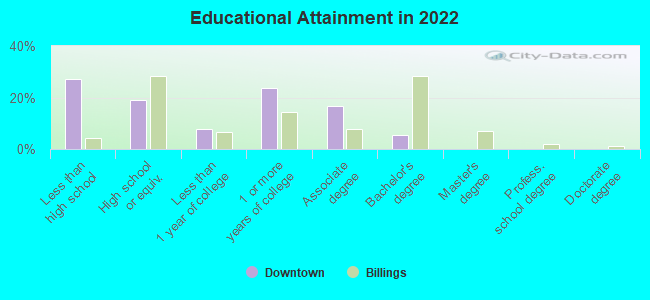
Education in this neighborhood (subdivision or community):
- Percentage of people 3 years and older in K-12 schools:
Downtown: 15.0% Billings: 16.2%
- Percentage of people 3 years and older in undergraduate colleges:
Downtown: 2.2% Billings: 3.6%
- Percentage of people 3 years and older in grad. or professional schools:
Downtown: 0.0% Billings: 1.5%
- Percentage of students K-12 enrolled in private schools:
Downtown: 0.0% Billings: 15.5%
Median year owner moved in (as recorded in 2022):
Median year renter moved in (as recorded in 2022):
| Downtown: | 2008 |
| Billings: | 2013 |
Median year renter moved in (as recorded in 2022):
| Downtown: | 2018 |
| Billings: | 2020 |
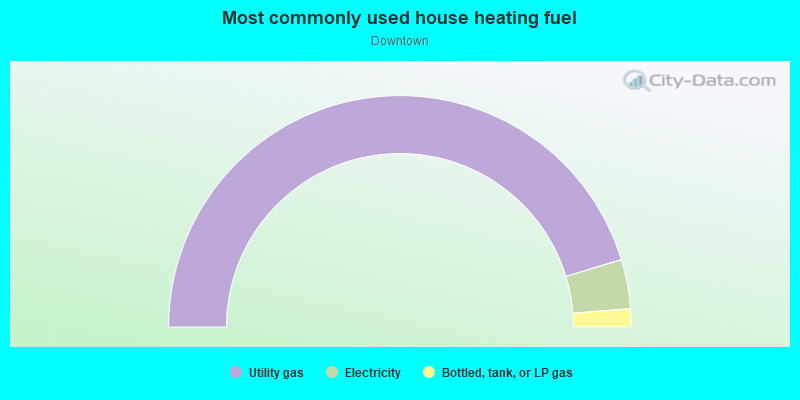
- 90.6%Utility gas
- 6.9%Electricity
- 2.5%Bottled, tank, or LP gas
Highways in this neighborhood:
1st Ave N (I- 90 Bus)
Length: 0.56 miles
Direction: SW-NE
Address range: 2900 to 3499
Direction: SW-NE
Address range: 2900 to 3499
Roads and streets:
N 29th St
Length: 0.88 miles
Direction: SE-NW
Address range: 1 to 963
Direction: SE-NW
Address range: 1 to 963
N 30th St
Length: 0.85 miles
Direction: SE-NW
Address range: 1 to 963
Direction: SE-NW
Address range: 1 to 963
N 31st St
Length: 0.75 miles
Direction: SE-NW
Address range: 1 to 899
Direction: SE-NW
Address range: 1 to 899
Montana Ave
Length: 0.67 miles
Directions: E-W, SW-NE
Address range: 2900 to 3598
Directions: E-W, SW-NE
Address range: 2900 to 3598
N 32nd St
Length: 0.59 miles
Direction: SE-NW
Address range: 1 to 649
Direction: SE-NW
Address range: 1 to 649
2nd Ave N
Length: 0.57 miles
Direction: SW-NE
Address range: 2900 to 3499
Direction: SW-NE
Address range: 2900 to 3499
3rd Ave N
Length: 0.50 miles
Directions: E-W, SW-NE
Address range: 2900 to 3499
Directions: E-W, SW-NE
Address range: 2900 to 3499
4th Ave N
Length: 0.44 miles
Directions: E-W, SW-NE
Address range: 2900 to 3399
Directions: E-W, SW-NE
Address range: 2900 to 3399
N 33rd St
Length: 0.42 miles
Direction: SE-NW
Address range: 1 to 499
Direction: SE-NW
Address range: 1 to 499
Division St
Length: 0.38 miles
Directions: N-S, SW-NE
Address range: 800 to 1399
Directions: N-S, SW-NE
Address range: 800 to 1399
6th Ave N
Length: 0.31 miles
Directions: E-W, SW-NE
Address range: 2900 to 3299
Directions: E-W, SW-NE
Address range: 2900 to 3299
N 34th St
Length: 0.30 miles
Direction: SE-NW
Address range: 1 to 399
Direction: SE-NW
Address range: 1 to 399
7th Ave N
Length: 0.28 miles
Directions: E-W, SW-NE
Address range: 2900 to 3199
Directions: E-W, SW-NE
Address range: 2900 to 3199
9th Ave N
Length: 0.19 miles
Direction: SW-NE
Address range: 2900 to 3099
Direction: SW-NE
Address range: 2900 to 3099
8th Ave N
Length: 0.19 miles
Direction: SW-NE
Address range: 2800 to 3099
Direction: SW-NE
Address range: 2800 to 3099
N 35th St
Length: 0.17 miles
Direction: SE-NW
Address range: 1 to 199
Direction: SE-NW
Address range: 1 to 199
Internal
Length: 0.09 miles
Direction: SW-NE
Direction: SW-NE
U-1004
Length: 0.03 miles
Direction: E-W
Direction: E-W
Burlington Ave
Length: 0.03 miles
Direction: SW-NE
Direction: SW-NE
Railroad features:
Montana Rail Link RR
Length: 0.87 miles
Directions: E-W, SW-NE
Directions: E-W, SW-NE