Downtown Burien (Downtown) neighborhood in Burien, Washington (WA), 98148, 98166, 98168 detailed profile
Settings
X


Business Search - 14 Million verified businesses
Area: 0.689 square miles
Population: 4,281
Population density:
| Downtown Burien (Downtown): | 6,218 people per square mile |
| Burien: | 6,926 people per square mile |

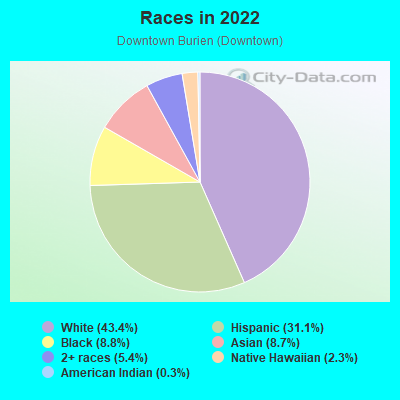
- 1,89043.4%White
- 1,35231.1%Hispanic or Latino
- 3828.8%Black
- 3808.7%Asian
- 2345.4%Two or more races
- 1002.3%Native Hawaiian and Other
Pacific Islander - 140.3%American Indian
Distribution of median household income
![Distribution of median household income]()
- 41Less than $10,000
- 156$10,000 to $19,999
- 241$20,000 to $29,999
- 147$30,000 to $39,999
- 245$40,000 to $49,999
- 78$50,000 to $59,999
- 136$60,000 to $74,999
- 188$75,000 to $99,999
- 170$100,000 to $124,999
- 195$125,000 to $149,999
- 217$150,000 to $199,999
- 114$200,000 or more

Distribution of owner-occupied house/condo value
![Distribution of owner-occupied house/condo value]()
- 103Less than $50,000
- 49$50,000 to $99,999
- 40$100,000 to $149,999
- 42$200,000 to $249,999
- 44$250,000 to $299,999
- 56$300,000 to $399,999
- 280$400,000 to $499,999
- 467$500,000 to $749,999
- 48$750,000 to $999,999
- 40$1,000,000 or more

Distribution of rent paid by renters
![Distribution of rent paid by renters]()
- 98$100 to $199
- 132$200 to $299
- 94$500 to $599
- 22$600 to $699
- 57$700 to $799
- 17$800 to $899
- 154$900 to $999
- 74$1,000 to $1,249
- 275$1,250 to $1,499
- 132$1,500 to $1,999
- 202$2,000 or more

Median rent in 2022:
| Downtown Burien (Downtown): | $1,278 |
| Burien: | $1,462 |
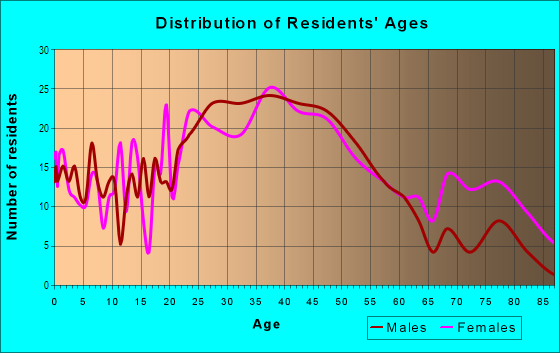
| Males: | 2,390 |
| Females: | 1,890 |
Males:
| This neighborhood: | 40.4 years |
| Whole city: | 37.7 years |
| This neighborhood: | 41.8 years |
| Whole city: | 41.0 years |
Average household size:
| Downtown Burien (Downtown): | 2.5 people |
| Burien: | 2.6 people |
Percentage of family households:
| Downtown Burien (Downtown): | 43.2% |
| Burien: | 44.3% |
| Here: | 39.5% |
| Burien: | 40.8% |
Percentage of married-couple families with children (among all households):
| Downtown Burien (Downtown): | 27.0% |
| Burien: | 25.4% |
Percentage of single-mother households (among all households):
| Downtown Burien (Downtown): | 12.4% |
| Burien: | 9.8% |
Percentage of never married males 15 years old and over:
Percentage of never married females 15 years old and over:
| Downtown Burien (Downtown): | 16.3% |
| Burien: | 20.6% |
Percentage of never married females 15 years old and over:
| Downtown Burien (Downtown): | 17.6% |
| city: | 14.6% |
Percentage of people that speak English not well or not at all:
| Downtown Burien (Downtown): | 11.7% |
| Burien: | 10.0% |
Percentage of people born in this state:
Percentage of people born in another U.S. state:
Percentage of native residents but born outside the U.S.:
Percentage of foreign born residents:
| Here: | 44.3% |
| Burien: | 48.3% |
Percentage of people born in another U.S. state:
| Downtown Burien (Downtown): | 28.0% |
| Burien: | 26.5% |
Percentage of native residents but born outside the U.S.:
| Here: | 1.1% |
| city: | 1.6% |
Percentage of foreign born residents:
| Here: | 26.7% |
| Burien: | 23.6% |
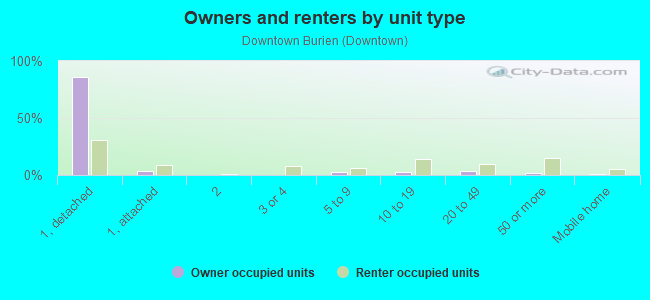
Owner-occupied
Renter-occupied

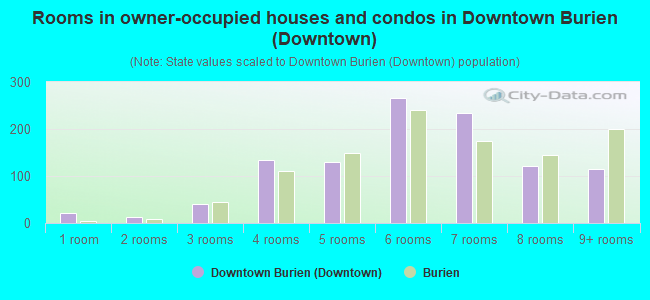
- Rooms in owner-occupied houses and condos in Downtown Burien <
> - 221 room
- 132 rooms
- 413 rooms
- 1344 rooms
- 1295 rooms
- 2676 rooms
- 2337 rooms
- 1228 rooms
- 1159+ rooms
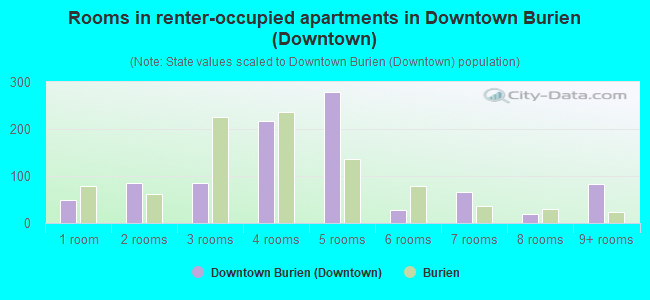
- Rooms in renter-occupied apartments in Downtown Burien <
> - 501 room
- 862 rooms
- 853 rooms
- 2174 rooms
- 2795 rooms
- 286 rooms
- 657 rooms
- 198 rooms
- 829+ rooms
Owner-occupied
Renter-occupied
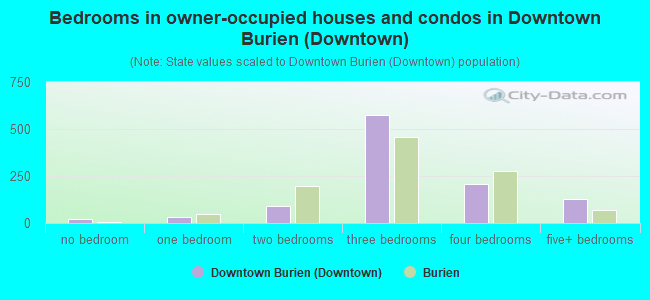
- Bedrooms in owner-occupied houses and condos in Downtown Burien <
> - 23no bedroom
- 321 bedroom
- 882 bedrooms
- 5723 bedrooms
- 2104 bedrooms
- 1295+ bedrooms
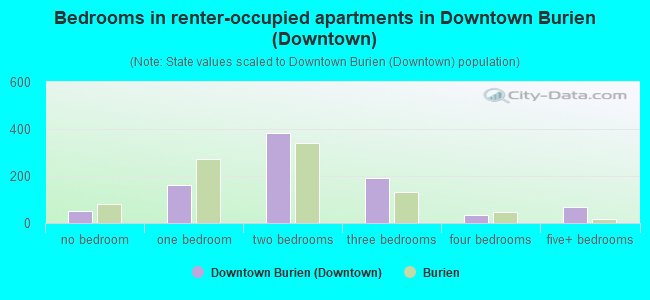
- Bedrooms in renter-occupied apartments in Downtown Burien <
> - 50no bedroom
- 1631 bedroom
- 3842 bedrooms
- 1933 bedrooms
- 324 bedrooms
- 665+ bedrooms
Average number of cars or other vehicles available in houses/condos:
Average number of cars or other vehicles available in apartments:
| This neighborhood: | 2.2 |
| Burien: | 2.2 |
Average number of cars or other vehicles available in apartments:
| Here: | 2.0 |
| city: | 1.4 |
Percentage of units with a mortgage:
| Downtown Burien (Downtown): | 73.4% |
| Burien: | 68.1% |
Housing prices:
- Average estimated value of detached houses in 2022 (64.8% of all units):
Downtown Burien (Downtown): $538,979 Burien: $665,485
- Average estimated value of townhouses or other attached units in 2022 (5.8% of all units):
This neighborhood: $492,437 city: $620,539
- Average estimated '22 value of housing units in 5-or-more-unit structures (8.6% of all units):
Downtown Burien (Downtown): $215,937 Burien: $290,590
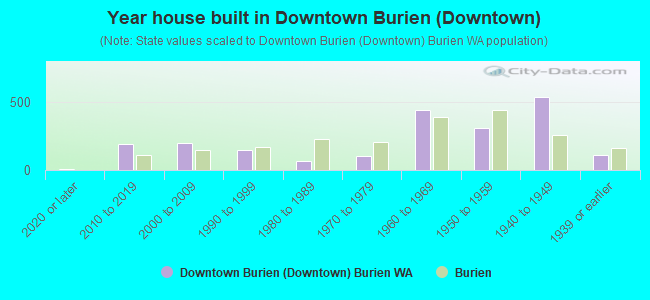
- Year house built in Downtown Burien <
> - 82020 or later
- 1902010 to 2019
- 1962000 to 2009
- 1481990 to 1999
- 681980 to 1989
- 1041970 to 1979
- 4351960 to 1969
- 3101950 to 1959
- 5311940 to 1949
- 1101939 or earlier
City-data.com crime index for city in 2020 (higher means more crime):
| City: | 377.3 |
| U.S. average: | 219.5 |
Travel time to work (commute)
![Travel time to work (commute)]()
- 41Less than 5 minutes
- 1145 to 9 minutes
- 12410 to 14 minutes
- 25815 to 19 minutes
- 29520 to 24 minutes
- 9225 to 29 minutes
- 21930 to 34 minutes
- 5835 to 39 minutes
- 4140 to 44 minutes
- 20845 to 59 minutes
- 9660 to 89 minutes
- 3090 or more minutes

Means of transportation to work
![Means of transportation to work]()
- 59.2%1,378Drove a car alone
- 13.7%320Carpooled
- 4.7%109Bus
- 1.8%41Subway or elevated rail
- 5.0%116Light rail, streetcar or trolley
- 0.3%7Taxi
- 1.5%36Motorcycle
- 3.6%83Bicycle
- 11.8%276Walked
- 2.0%46Other means
- 12.4%289Worked at home

Time leaving home to go to work
![Time leaving home to go to work]()
- 7812:00 a.m. to 4:59 a.m.
- 755:00 a.m. to 5:29 a.m.
- 1255:30 a.m. to 5:59 a.m.
- 1716:00 a.m. to 6:29 a.m.
- 1966:30 a.m. to 6:59 a.m.
- 1777:00 a.m. to 7:29 a.m.
- 1497:30 a.m. to 7:59 a.m.
- 1238:00 a.m. to 8:29 a.m.
- 688:30 a.m. to 8:59 a.m.
- 709:00 a.m. to 9:59 a.m.
- 6610:00 a.m. to 10:59 a.m.
- 2111:00 a.m. to 11:59 a.m.
- 15012:00 p.m. to 3:59 p.m.
- 974:00 p.m. to 11:59 p.m.

Occupations of males:
- Percentage of males in management occupations (except farmers):
Here: 7.4% city: 11.5%
- Percentage of males in computer and mathematical occupations:
Here: 2.7% city: 4.4%
- Percentage of males in architecture and engineering occupations:
Here: 5.8% city: 2.9%
- Percentage of males in community and social services occupations:
Here: 2.4% city: 1.3%
- Percentage of males in education, training, and library occupations:
Here: 3.9% city: 1.7%
- Percentage of males in service occupations:
Here: 16.7% city: 15.8%
- Percentage of males in sales and office occupations:
Here: 15.0% city: 16.4%
- Percentage of males in farming, fishing, and forestry occupations:
Here: 1.1% city: 0.6%
- Percentage of males in construction, extraction, and maintenance occupations:
Here: 15.4% city: 13.2%
- Percentage of males in production occupations:
Here: 4.0% city: 6.3%
- Percentage of males in transportation occupations:
Here: 12.6% city: 6.2%
- Percentage of males in material moving occupations:
Here: 5.3% city: 6.4%
Occupations of females:
- Percentage of females in management occupations (except farmers):
Here: 3.7% city: 9.7%
- Percentage of females in business and financial operations occupations:
Here: 9.9% city: 5.8%
- Percentage of females in computer and mathematical occupations:
Here: 2.0% city: 1.8%
- Percentage of females in architecture and engineering occupations:
Here: 1.1% city: 0.3%
- Percentage of females in community and social services occupations:
Here: 2.7% city: 2.9%
- Percentage of females in legal occupations:
Here: 2.6% city: 0.8%
- Percentage of females in education, training, and library occupations:
Here: 16.9% city: 8.9%
- Percentage of females in arts, design, entertainment, sports, and media occupations:
Here: 4.6% city: 1.9%
- Percentage of females in healthcare practitioners and technical occupations:
Here: 7.3% city: 6.1%
- Percentage of females in service occupations:
Here: 30.1% city: 30.6%
- Percentage of females in sales and office occupations:
Here: 15.7% city: 23.3%
- Percentage of females in production occupations:
Here: 2.5% city: 2.9%
- Percentage of females in transportation occupations:
Here: 1.7% city: 1.8%
Percentage of people 16-64 in Armed Forces:
| Downtown Burien (Downtown): | 0.1% |
| Burien: | 0.0% |
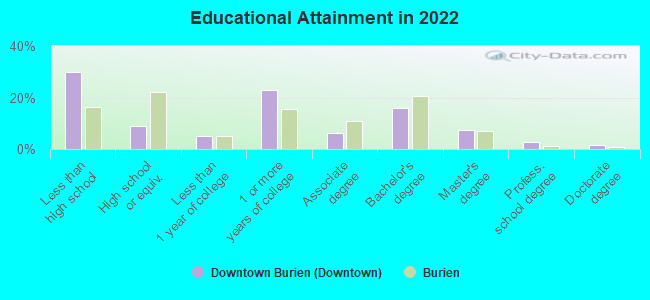
Education in this neighborhood (subdivision or community):
- Percentage of people 3 years and older in K-12 schools:
Downtown Burien (Downtown): 19.9% Burien: 15.9%
- Percentage of people 3 years and older in undergraduate colleges:
Downtown Burien (Downtown): 4.0% Burien: 3.5%
- Percentage of people 3 years and older in grad. or professional schools:
Downtown Burien (Downtown): 1.9% Burien: 0.9%
- Percentage of students K-12 enrolled in private schools:
Downtown Burien (Downtown): 32.3% Burien: 7.7%
Percentage of population below poverty level:
| Downtown Burien (Downtown): | 11.8% |
| Burien: | 11.4% |
Median year owner moved in (as recorded in 2022):
Median year renter moved in (as recorded in 2022):
| Downtown Burien (Downtown): | 2009 |
| Burien: | 2010 |
Median year renter moved in (as recorded in 2022):
| Downtown Burien (Downtown): | 2015 |
| Burien: | 2017 |
Percentage of married-couple families with both working:
| Downtown Burien (Downtown): | 94.4% |
| Burien: | 81.8% |
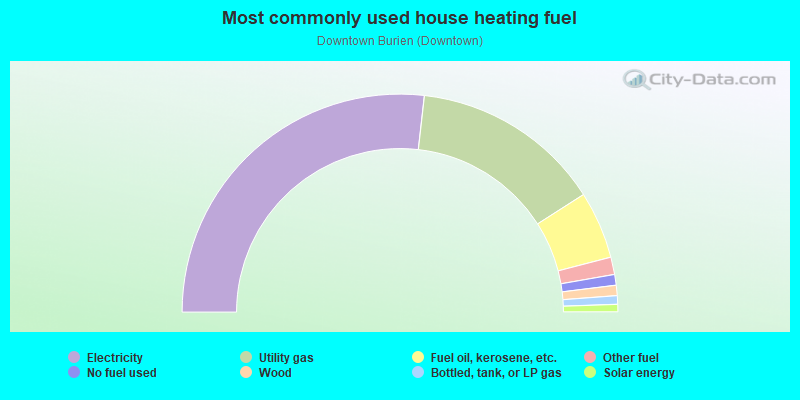
- 53.6%Electricity
- 28.3%Utility gas
- 10.0%Fuel oil, kerosene, etc.
- 2.6%Other fuel
- 1.6%No fuel used
- 1.5%Wood
- 1.3%Bottled, tank, or LP gas
- 1.1%Solar energy
Highways in this neighborhood:
State Rte 509
Length: 2.12 miles
Directions: N-S, SE-NW, SW-NE
Directions: N-S, SE-NW, SW-NE
State Rte 518
Length: 0.17 miles
Direction: E-W
Direction: E-W
Roads and streets:
SW 146th St
Length: 1.11 miles
Direction: E-W
Address range: 100 to 1199
Direction: E-W
Address range: 100 to 1199
SW 148th St
Length: 1.11 miles
Direction: E-W
Address range: 100 to 1199
Direction: E-W
Address range: 100 to 1199
Ambaum Blvd SW
Length: 0.92 miles
Directions: E-W, N-S, SE-NW
Address range: 14400 to 15499
Directions: E-W, N-S, SE-NW
Address range: 14400 to 15499
SW 150th St
Length: 0.84 miles
Direction: E-W
Address range: 100 to 899
Direction: E-W
Address range: 100 to 899
SW 152nd St
Length: 0.83 miles
Direction: E-W
Address range: 100 to 908
Direction: E-W
Address range: 100 to 908
SW 154th St
Length: 0.82 miles
Direction: E-W
Address range: 100 to 899
Direction: E-W
Address range: 100 to 899
4th Ave SW
Length: 0.82 miles
Directions: N-S, SE-NW
Address range: 14300 to 15599
Directions: N-S, SE-NW
Address range: 14300 to 15599
1st Ave S
Length: 0.75 miles
Direction: N-S
Address range: 14400 to 15599
Direction: N-S
Address range: 14400 to 15599
SW 153rd St
Length: 0.73 miles
Direction: E-W
Address range: 100 to 799
Direction: E-W
Address range: 100 to 799
SW 156th St
Length: 0.72 miles
Direction: E-W
Address range: 100 to 899
Direction: E-W
Address range: 100 to 899
6th Ave SW
Length: 0.68 miles
Directions: N-S, SE-NW
Address range: 14300 to 15599
Directions: N-S, SE-NW
Address range: 14300 to 15599
SW 155th St
Length: 0.67 miles
Direction: E-W
Address range: 100 to 799
Direction: E-W
Address range: 100 to 799
8th Ave SW
Length: 0.64 miles
Direction: N-S
Address range: 14400 to 15599
Direction: N-S
Address range: 14400 to 15599
SW 144th St
Length: 0.61 miles
Directions: E-W, SE-NW
Address range: 1 to 1099
Directions: E-W, SE-NW
Address range: 1 to 1099
SW 149th St
Length: 0.56 miles
Direction: E-W
Address range: 600 to 1199
Direction: E-W
Address range: 600 to 1199
SW 151st St
Length: 0.48 miles
Directions: E-W, N-S, SE-NW, SW-NE
Address range: 664 to 899
Directions: E-W, N-S, SE-NW, SW-NE
Address range: 664 to 899
9th Ave SW
Length: 0.37 miles
Direction: N-S
Address range: 14600 to 15599
Direction: N-S
Address range: 14600 to 15599
2nd Ave SW
Length: 0.36 miles
Direction: N-S
Address range: 14400 to 15575
Direction: N-S
Address range: 14400 to 15575
S 140th St
Length: 0.26 miles
Direction: E-W
Address range: 156 to 399
Direction: E-W
Address range: 156 to 399
11th Ave SW
Length: 0.25 miles
Direction: N-S
Address range: 14400 to 14799
Direction: N-S
Address range: 14400 to 14799
3rd Ave SW
Length: 0.23 miles
Direction: N-S
Address range: 14400 to 14699
Direction: N-S
Address range: 14400 to 14699
S 146th St
Length: 0.21 miles
Direction: E-W
Address range: 100 to 399
Direction: E-W
Address range: 100 to 399
12th Ave SW
Length: 0.19 miles
Direction: N-S
Address range: 14600 to 14899
Direction: N-S
Address range: 14600 to 14899
SW 143rd St
Length: 0.18 miles
Direction: E-W
Address range: 400 to 599
Direction: E-W
Address range: 400 to 599
SW 145th St
Length: 0.15 miles
Directions: E-W, N-S, SW-NE
Address range: 600 to 799
Directions: E-W, N-S, SW-NE
Address range: 600 to 799
7th Ave SW
Length: 0.13 miles
Direction: N-S
Address range: 14600 to 14799
Direction: N-S
Address range: 14600 to 14799
SW 144th Pl
Length: 0.13 miles
Directions: E-W, N-S, SW-NE
Address range: 600 to 799
Directions: E-W, N-S, SW-NE
Address range: 600 to 799
5th Pl SW
Length: 0.12 miles
Directions: E-W, N-S, SE-NW
Directions: E-W, N-S, SE-NW
S 152nd St
Length: 0.11 miles
Direction: E-W
Address range: 1 to 119
Direction: E-W
Address range: 1 to 119
4th Pl SW
Length: 0.09 miles
Directions: E-W, SW-NE
Address range: 15500 to 15599
Directions: E-W, SW-NE
Address range: 15500 to 15599
3rd Ave S
Length: 0.07 miles
Directions: N-S, SE-NW
Address range: 14600 to 14699
Directions: N-S, SE-NW
Address range: 14600 to 14699
S 150th St
Length: 0.05 miles
Direction: E-W
Address range: 100 to 299
Direction: E-W
Address range: 100 to 299
6th Pl SW
Length: 0.05 miles
Directions: E-W, N-S, SE-NW
Address range: 14400 to 14499
Directions: E-W, N-S, SE-NW
Address range: 14400 to 14499
Length: 0.04 miles
Direction: N-S
Direction: N-S