Downtown neighborhood in Cedar Rapids, Iowa (IA), 52401, 52404 detailed profile
Settings
X


Business Search - 14 Million verified businesses
Area: 0.343 square miles
Population: 812
Population density:
| Downtown: | 2,365 people per square mile |
| Cedar Rapids: | 2,161 people per square mile |

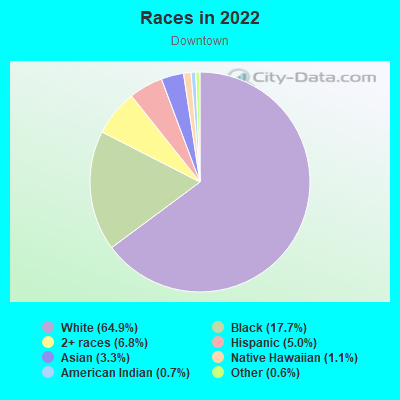
- 55464.9%White
- 15117.7%Black
- 586.8%Two or more races
- 435.0%Hispanic or Latino
- 283.3%Asian
- 91.1%Native Hawaiian and Other
Pacific Islander - 60.7%American Indian
- 50.6%Some other race
Median household income in 2022:
| Downtown: | $48,510 |
| Cedar Rapids: | $64,435 |
Distribution of median household income
![Distribution of median household income]()
- 18Less than $10,000
- 64$10,000 to $19,999
- 70$20,000 to $29,999
- 36$30,000 to $39,999
- 67$40,000 to $49,999
- 29$50,000 to $59,999
- 47$60,000 to $74,999
- 71$75,000 to $99,999
- 22$100,000 to $124,999
- 34$125,000 to $149,999
- 9$150,000 to $199,999
- 39$200,000 or more

Distribution of owner-occupied house/condo value
![Distribution of owner-occupied house/condo value]()
- 13Less than $50,000
- 51$50,000 to $99,999
- 55$100,000 to $149,999
- 16$150,000 to $199,999
- 23$200,000 to $249,999
- 24$250,000 to $299,999
- 11$300,000 to $399,999
- 8$400,000 to $499,999
- 40$500,000 to $749,999
- 6$750,000 to $999,999
- 6$1,000,000 or more

Distribution of rent paid by renters
![Distribution of rent paid by renters]()
- 26Less than $100
- 6$100 to $199
- 79$200 to $299
- 17$300 to $399
- 12$400 to $499
- 38$500 to $599
- 93$600 to $699
- 93$700 to $799
- 20$800 to $899
- 62$900 to $999
- 57$1,000 to $1,249
- 12$1,250 to $1,499
- 5$1,500 to $1,999
- 5$2,000 or more

Median rent in 2022:
| Downtown: | $733 |
| Cedar Rapids: | $745 |
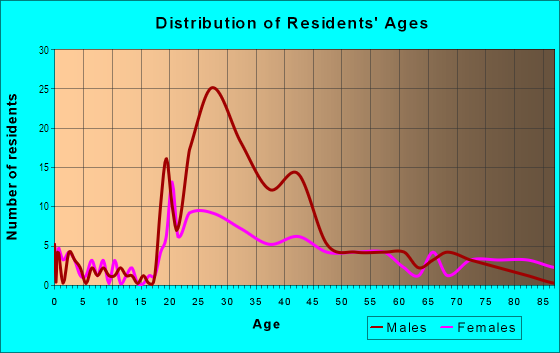
| Males: | 454 |
| Females: | 358 |
Males:
| This neighborhood: | 33.4 years |
| Whole city: | 39.0 years |
| This neighborhood: | 34.6 years |
| Whole city: | 39.2 years |
Average household size:
| Downtown: | 11.1 people |
| Cedar Rapids: | 2.3 people |
Percentage of family households:
| Downtown: | 18.0% |
| Cedar Rapids: | 40.6% |
| Here: | 9.9% |
| Cedar Rapids: | 40.3% |
Percentage of married-couple families with children (among all households):
| Downtown: | 23.3% |
| Cedar Rapids: | 28.1% |
Percentage of single-mother households (among all households):
| Downtown: | 31.2% |
| Cedar Rapids: | 11.2% |
Percentage of never married males 15 years old and over:
Percentage of never married females 15 years old and over:
| Downtown: | 35.8% |
| Cedar Rapids: | 19.7% |
Percentage of never married females 15 years old and over:
| Downtown: | 23.0% |
| city: | 19.4% |
Percentage of people that speak English not well or not at all:
| Downtown: | 0.1% |
| Cedar Rapids: | 1.4% |
Percentage of people born in this state:
Percentage of people born in another U.S. state:
Percentage of native residents but born outside the U.S.:
Percentage of foreign born residents:
| Here: | 55.6% |
| Cedar Rapids: | 69.8% |
Percentage of people born in another U.S. state:
| Downtown: | 37.6% |
| Cedar Rapids: | 23.6% |
Percentage of native residents but born outside the U.S.:
| Here: | 0.3% |
| city: | 1.0% |
Percentage of foreign born residents:
| Here: | 6.6% |
| Cedar Rapids: | 5.6% |
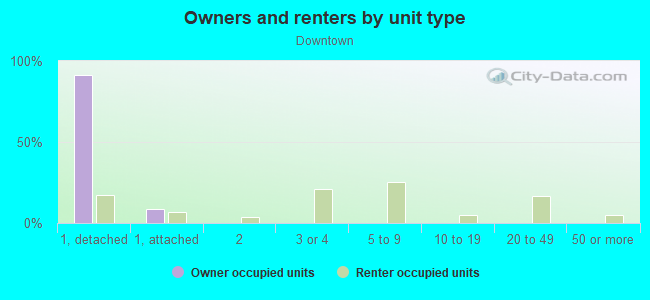
Owner-occupied
Renter-occupied

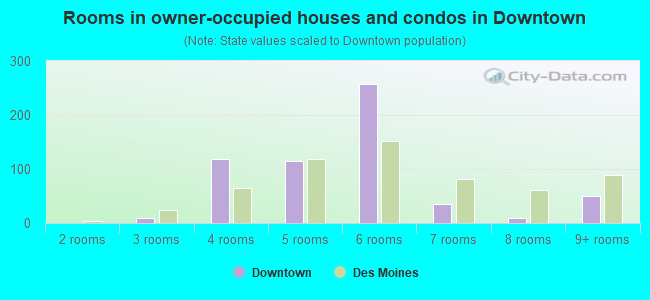
- Rooms in owner-occupied houses and condos in Downtown
- 41 room
- 42 rooms
- 173 rooms
- 124 rooms
- 305 rooms
- 516 rooms
- 467 rooms
- 48 rooms
- 79+ rooms
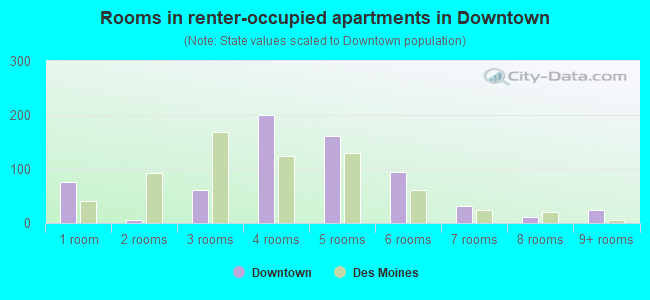
- Rooms in renter-occupied apartments in Downtown
- 431 room
- 902 rooms
- 1273 rooms
- 564 rooms
- 305 rooms
- 586 rooms
- 37 rooms
- 08 rooms
- 39+ rooms
Owner-occupied
Renter-occupied
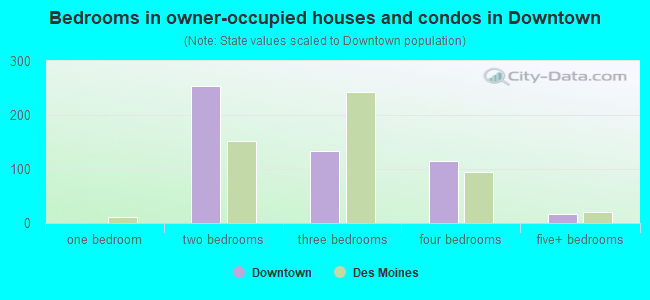
- Bedrooms in owner-occupied houses and condos in Downtown
- 4no bedroom
- 161 bedroom
- 482 bedrooms
- 583 bedrooms
- 364 bedrooms
- 265+ bedrooms
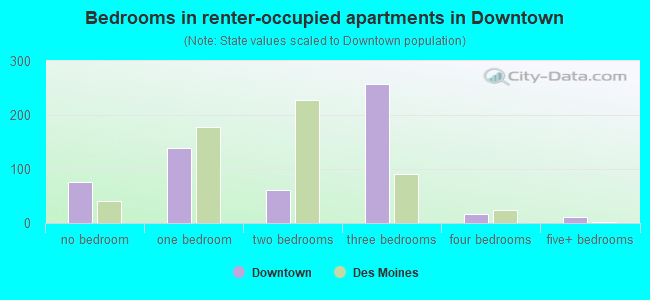
- Bedrooms in renter-occupied apartments in Downtown
- 61no bedroom
- 1921 bedroom
- 1002 bedrooms
- 423 bedrooms
- 94 bedrooms
- 35+ bedrooms
Average number of cars or other vehicles available in houses/condos:
Average number of cars or other vehicles available in apartments:
| This neighborhood: | |
| Cedar Rapids: |
Average number of cars or other vehicles available in apartments:
| Here: | 0.9 |
| city: | 1.3 |
Percentage of units with a mortgage:
| Downtown: | 82.7% |
| Cedar Rapids: | 61.9% |
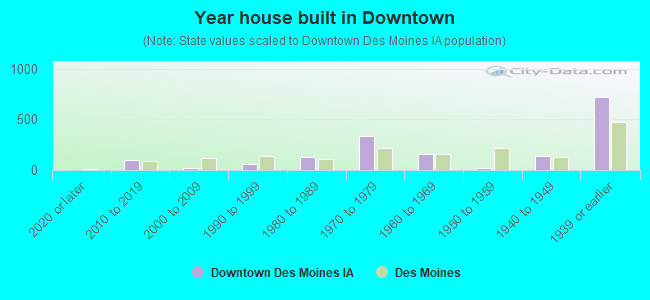
- Year house built in Downtown
- 02020 or later
- 2992010 to 2019
- 1252000 to 2009
- 111990 to 1999
- 261980 to 1989
- 1311970 to 1979
- 211960 to 1969
- 91950 to 1959
- 421940 to 1949
- 1391939 or earlier
City-data.com crime index for city in 2020 (higher means more crime):
| City: | 255.6 |
| U.S. average: | 219.5 |
Travel time to work (commute)
![Travel time to work (commute)]()
- 41Less than 5 minutes
- 625 to 9 minutes
- 7710 to 14 minutes
- 4215 to 19 minutes
- 1720 to 24 minutes
- 1025 to 29 minutes
- 1530 to 34 minutes
- 235 to 39 minutes
- 240 to 44 minutes
- 1645 to 59 minutes
- 360 to 89 minutes
- 590 or more minutes

Means of transportation to work
![Means of transportation to work]()
- 71.2%304Drove a car alone
- 8.0%34Carpooled
- 6.3%27Bus
- 3.0%13Bicycle
- 7.3%31Walked
- 2.3%10Other means
- 6.3%27Worked at home

Time leaving home to go to work
![Time leaving home to go to work]()
- 512:00 a.m. to 4:59 a.m.
- 55:00 a.m. to 5:29 a.m.
- 45:30 a.m. to 5:59 a.m.
- 176:00 a.m. to 6:29 a.m.
- 366:30 a.m. to 6:59 a.m.
- 247:00 a.m. to 7:29 a.m.
- 297:30 a.m. to 7:59 a.m.
- 358:00 a.m. to 8:29 a.m.
- 98:30 a.m. to 8:59 a.m.
- 209:00 a.m. to 9:59 a.m.
- 610:00 a.m. to 10:59 a.m.
- 411:00 a.m. to 11:59 a.m.
- 4112:00 p.m. to 3:59 p.m.
- 464:00 p.m. to 11:59 p.m.

Occupations of males:
- Percentage of males in management occupations (except farmers):
Here: 10.5% city: 9.9%
- Percentage of males in business and financial operations occupations:
Here: 1.3% city: 4.2%
- Percentage of males in computer and mathematical occupations:
Here: 5.2% city: 6.3%
- Percentage of males in architecture and engineering occupations:
Here: 9.4% city: 4.6%
- Percentage of males in legal occupations:
Here: 2.9% city: 2.0%
- Percentage of males in healthcare practitioners and technical occupations:
Here: 14.5% city: 1.9%
- Percentage of males in service occupations:
Here: 21.7% city: 12.0%
- Percentage of males in sales and office occupations:
Here: 14.6% city: 15.0%
- Percentage of males in construction, extraction, and maintenance occupations:
Here: 3.4% city: 8.1%
- Percentage of males in production occupations:
Here: 1.2% city: 12.0%
- Percentage of males in transportation occupations:
Here: 1.0% city: 5.5%
- Percentage of males in material moving occupations:
Here: 8.6% city: 6.3%
Occupations of females:
- Percentage of females in management occupations (except farmers):
Here: 15.2% city: 8.2%
- Percentage of females in business and financial operations occupations:
Here: 15.9% city: 8.1%
- Percentage of females in computer and mathematical occupations:
Here: 1.8% city: 1.2%
- Percentage of females in life, physical, and social science occupations:
Here: 1.9% city: 0.5%
- Percentage of females in community and social services occupations:
Here: 4.9% city: 3.2%
- Percentage of females in legal occupations:
Here: 3.2% city: 0.7%
- Percentage of females in education, training, and library occupations:
Here: 3.4% city: 7.5%
- Percentage of females in arts, design, entertainment, sports, and media occupations:
Here: 1.1% city: 1.5%
- Percentage of females in healthcare practitioners and technical occupations:
Here: 9.9% city: 9.7%
- Percentage of females in service occupations:
Here: 12.0% city: 19.8%
- Percentage of females in sales and office occupations:
Here: 15.0% city: 28.7%
- Percentage of females in production occupations:
Here: 12.5% city: 5.4%
- Percentage of females in transportation occupations:
Here: 3.1% city: 1.0%
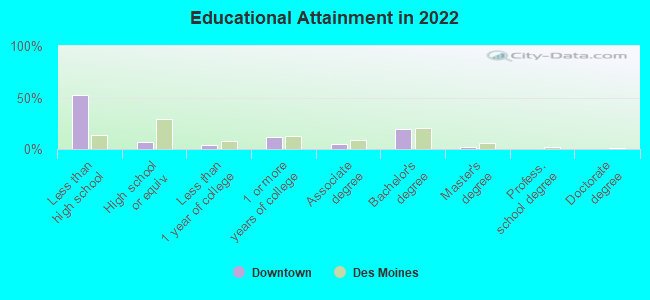
Education in this neighborhood (subdivision or community):
- Percentage of people 3 years and older in K-12 schools:
Downtown: 20.5% Cedar Rapids: 15.7%
- Percentage of people 3 years and older in undergraduate colleges:
Downtown: 4.2% Cedar Rapids: 5.7%
- Percentage of people 3 years and older in grad. or professional schools:
Downtown: 6.2% Cedar Rapids: 0.8%
- Percentage of students K-12 enrolled in private schools:
Downtown: 29.7% Cedar Rapids: 12.8%
Percentage of population below poverty level:
| Downtown: | 31.5% |
| Cedar Rapids: | 11.4% |
Median year renter moved in (as recorded in 2022):
| Downtown: | 2019 |
| Cedar Rapids: | 2020 |
Percentage of married-couple families with both working:
| Downtown: | 54.2% |
| Cedar Rapids: | 71.3% |
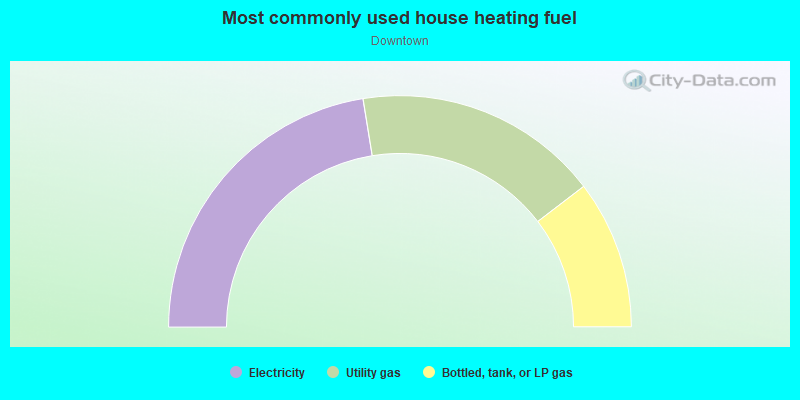
- 51.0%Utility gas
- 42.0%Electricity
- 4.2%No fuel used
- 1.6%Bottled, tank, or LP gas
- 1.3%Other fuel
Limited-access highways (interstate or state) in this neighborhood:
I- 380
Length: 0.49 miles
Directions: E-W, SW-NE
Directions: E-W, SW-NE
Highways in this neighborhood:
1st Ave SE (1st Ave E, 1st Ave NE, US Hwy 151 Bus)
Length: 0.59 miles
Direction: SW-NE
Address range: 1 to 699
Direction: SW-NE
Address range: 1 to 699
US Hwy 151 Bus (1st Avenue Brg)
Length: 0.14 miles
Direction: SW-NE
Address range: 44 to 79
Direction: SW-NE
Address range: 44 to 79
Roads and streets:
2nd Ave SE
Length: 0.59 miles
Direction: SW-NE
Address range: 1 to 699
Direction: SW-NE
Address range: 1 to 699
3rd Ave SE
Length: 0.59 miles
Direction: SW-NE
Address range: 1 to 699
Direction: SW-NE
Address range: 1 to 699
4th Ave SE
Length: 0.58 miles
Direction: SW-NE
Address range: 100 to 699
Direction: SW-NE
Address range: 100 to 699
A Ave NE
Length: 0.55 miles
Directions: E-W, SW-NE
Address range: 100 to 699
Directions: E-W, SW-NE
Address range: 100 to 699
5th Ave SE
Length: 0.53 miles
Direction: SW-NE
Address range: 100 to 699
Direction: SW-NE
Address range: 100 to 699
5th St SE
Length: 0.50 miles
Direction: SE-NW
Address range: 100 to 699
Direction: SE-NW
Address range: 100 to 699
1st St SE
Length: 0.50 miles
Direction: SE-NW
Address range: 100 to 699
Direction: SE-NW
Address range: 100 to 699
6th St SE
Length: 0.50 miles
Direction: SE-NW
Address range: 100 to 699
Direction: SE-NW
Address range: 100 to 699
3rd St SE
Length: 0.50 miles
Direction: SE-NW
Address range: 100 to 699
Direction: SE-NW
Address range: 100 to 699
7th Ave SE
Length: 0.44 miles
Direction: SW-NE
Address range: 100 to 599
Direction: SW-NE
Address range: 100 to 599
6th Ave SE
Length: 0.44 miles
Direction: SW-NE
Address range: 300 to 699
Direction: SW-NE
Address range: 300 to 699
2nd St SE
Length: 0.42 miles
Direction: SE-NW
Address range: 100 to 699
Direction: SE-NW
Address range: 100 to 699
7th St SE
Length: 0.42 miles
Direction: SE-NW
Address range: 100 to 599
Direction: SE-NW
Address range: 100 to 599
3rd Avenue Brg
Length: 0.20 miles
Direction: SW-NE
Address range: 32 to 83
Direction: SW-NE
Address range: 32 to 83
2nd Avenue Brg
Length: 0.17 miles
Directions: E-W, SW-NE
Address range: 40 to 83
Directions: E-W, SW-NE
Address range: 40 to 83
E Av Brg
Length: 0.16 miles
Directions: E-W, SE-NW
Directions: E-W, SE-NW
7th St NE
Length: 0.13 miles
Direction: SE-NW
Address range: 100 to 199
Direction: SE-NW
Address range: 100 to 199
1st St NE
Length: 0.13 miles
Direction: SE-NW
Address range: 100 to 198
Direction: SE-NW
Address range: 100 to 198
6th St NE
Length: 0.13 miles
Direction: SE-NW
Address range: 100 to 199
Direction: SE-NW
Address range: 100 to 199
2nd St NE
Length: 0.12 miles
Direction: SE-NW
Address range: 100 to 199
Direction: SE-NW
Address range: 100 to 199
3rd St NE
Length: 0.11 miles
Direction: SE-NW
Address range: 100 to 275
Direction: SE-NW
Address range: 100 to 275
Transit Way SE
Length: 0.10 miles
Direction: N-S
Address range: 100 to 199
Direction: N-S
Address range: 100 to 199
5th St NE
Length: 0.09 miles
Direction: SE-NW
Address range: 100 to 199
Direction: SE-NW
Address range: 100 to 199
4th St NE
Length: 0.08 miles
Direction: SE-NW
Address range: 100 to 199
Direction: SE-NW
Address range: 100 to 199
Railroad features:
Union Pacific RR
Length: 0.58 miles
Direction: SE-NW
Direction: SE-NW