Downtown (Downtown Crown Point) neighborhood in Crown Point, Indiana (IN), 46307 detailed profile
Settings
X


Business Search - 14 Million verified businesses
Area: 0.327 square miles
Population: 179
Population density:
| Downtown (Downtown Crown Point): | 547 people per square mile |
| Crown Point: | 2,030 people per square mile |

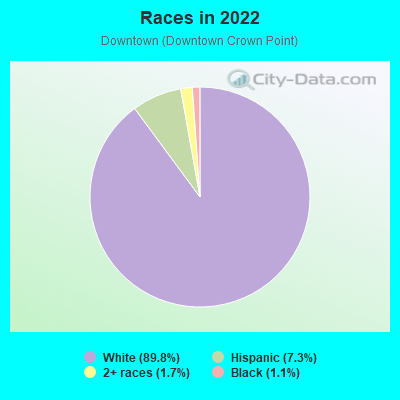
- 15989.8%White
- 137.3%Hispanic or Latino
- 31.7%Two or more races
- 21.1%Black
Median household income in 2022:
| Downtown (Downtown Crown Point): | $80,833 |
| Crown Point: | $92,810 |
Distribution of median household income
![Distribution of median household income]()
- 4Less than $10,000
- 4$10,000 to $19,999
- 4$20,000 to $29,999
- 5$30,000 to $39,999
- 5$40,000 to $49,999
- 6$50,000 to $59,999
- 6$60,000 to $74,999
- 16$75,000 to $99,999
- 7$100,000 to $124,999
- 7$125,000 to $149,999
- 9$150,000 to $199,999
- 2$200,000 or more

Distribution of owner-occupied house/condo value
![Distribution of owner-occupied house/condo value]()
- 5Less than $50,000
- 4$50,000 to $99,999
- 4$100,000 to $149,999
- 13$150,000 to $199,999
- 13$200,000 to $249,999
- 10$250,000 to $299,999
- 9$300,000 to $399,999
- 4$400,000 to $499,999
- 4$500,000 to $749,999
- 3$750,000 to $999,999

Distribution of rent paid by renters
![Distribution of rent paid by renters]()
- 3$700 to $799
- 3$900 to $999
- 4$1,000 to $1,249
- 2$1,250 to $1,499
- 3$1,500 to $1,999

Median rent in 2022:
| Downtown (Downtown Crown Point): | $1,197 |
| Crown Point: | $1,100 |
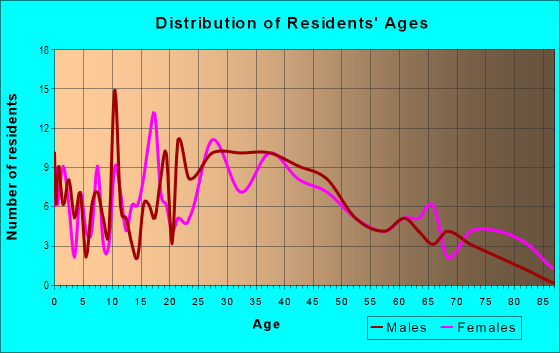
| Males: | 93 |
| Females: | 85 |
Males:
| This neighborhood: | 36.2 years |
| Whole city: | 38.2 years |
| This neighborhood: | 44.8 years |
| Whole city: | 40.9 years |
Average household size:
| Downtown (Downtown Crown Point): | 2.6 people |
| Crown Point: | 2.7 people |
Percentage of family households:
| Downtown (Downtown Crown Point): | 49.4% |
| Crown Point: | 52.0% |
| Here: | 56.6% |
| Crown Point: | 57.2% |
Percentage of married-couple families with children (among all households):
| Downtown (Downtown Crown Point): | 28.6% |
| Crown Point: | 28.1% |
Percentage of single-mother households (among all households):
| Downtown (Downtown Crown Point): | 7.1% |
| Crown Point: | 4.1% |
Percentage of never married males 15 years old and over:
Percentage of never married females 15 years old and over:
| Downtown (Downtown Crown Point): | 15.2% |
| Crown Point: | 15.9% |
Percentage of never married females 15 years old and over:
| Downtown (Downtown Crown Point): | 11.7% |
| city: | 10.1% |
Percentage of people that speak English not well or not at all:
| Downtown (Downtown Crown Point): | 0.0% |
| Crown Point: | 1.2% |
Percentage of people born in this state:
Percentage of people born in another U.S. state:
Percentage of native residents but born outside the U.S.:
Percentage of foreign born residents:
| Here: | 55.9% |
| Crown Point: | 61.4% |
Percentage of people born in another U.S. state:
| Downtown (Downtown Crown Point): | 37.7% |
| Crown Point: | 31.9% |
Percentage of native residents but born outside the U.S.:
| Here: | 0.2% |
| city: | 0.5% |
Percentage of foreign born residents:
| Here: | 6.2% |
| Crown Point: | 6.2% |
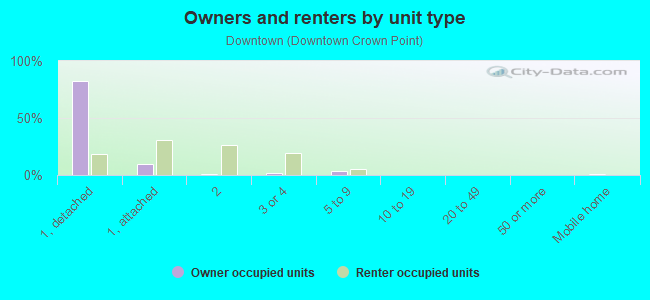
Owner-occupied
Renter-occupied

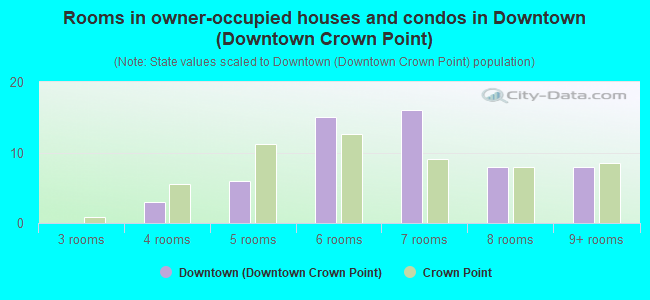
- Rooms in owner-occupied houses and condos in Downtown <
> - 01 room
- 02 rooms
- 03 rooms
- 34 rooms
- 65 rooms
- 156 rooms
- 167 rooms
- 88 rooms
- 89+ rooms
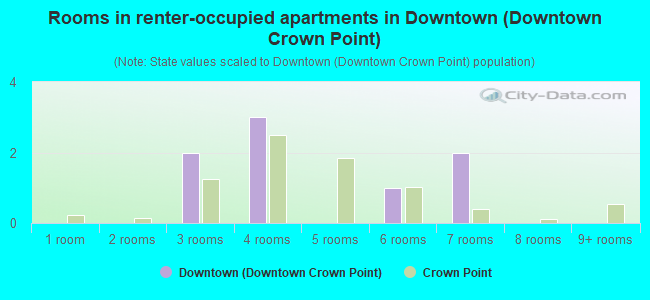
- Rooms in renter-occupied apartments in Downtown <
> - 01 room
- 02 rooms
- 23 rooms
- 34 rooms
- 05 rooms
- 16 rooms
- 27 rooms
- 08 rooms
- 09+ rooms
Owner-occupied
Renter-occupied
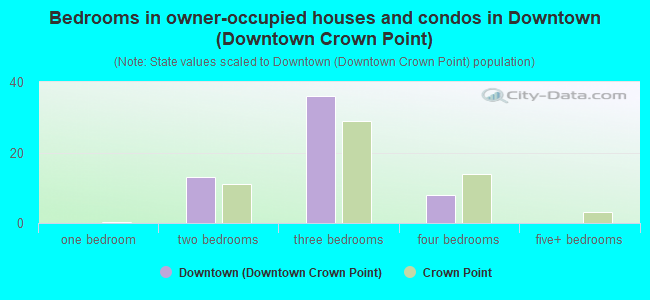
- Bedrooms in owner-occupied houses and condos in Downtown <
> - 0no bedroom
- 01 bedroom
- 132 bedrooms
- 363 bedrooms
- 84 bedrooms
- 05+ bedrooms
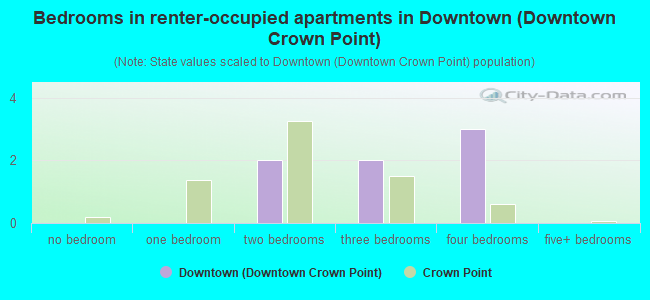
- Bedrooms in renter-occupied apartments in Downtown <
> - 0no bedroom
- 01 bedroom
- 22 bedrooms
- 23 bedrooms
- 34 bedrooms
- 05+ bedrooms
Average number of cars or other vehicles available in houses/condos:
Average number of cars or other vehicles available in apartments:
| This neighborhood: | 2.1 |
| Crown Point: | 1.9 |
Average number of cars or other vehicles available in apartments:
| Here: | 1.8 |
| city: | 1.5 |
Percentage of units with a mortgage:
| Downtown (Downtown Crown Point): | 66.2% |
| Crown Point: | 71.6% |
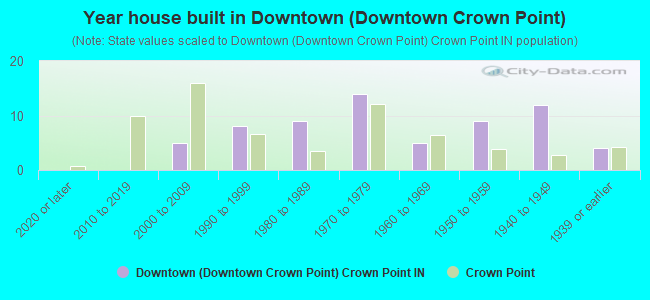
- Year house built in Downtown <
> - 02020 or later
- 02010 to 2019
- 52000 to 2009
- 81990 to 1999
- 91980 to 1989
- 141970 to 1979
- 51960 to 1969
- 91950 to 1959
- 121940 to 1949
- 41939 or earlier
City-data.com crime index for city in 2019 (higher means more crime):
| City: | 47.9 |
| U.S. average: | 223.9 |
Travel time to work (commute)
![Travel time to work (commute)]()
- 5Less than 5 minutes
- 155 to 9 minutes
- 3510 to 14 minutes
- 2015 to 19 minutes
- 1420 to 24 minutes
- 1025 to 29 minutes
- 2830 to 34 minutes
- 635 to 39 minutes
- 1840 to 44 minutes
- 945 to 59 minutes
- 1260 to 89 minutes
- 390 or more minutes

Means of transportation to work
![Means of transportation to work]()
- 87.9%80Drove a car alone
- 1.1%1Carpooled
- 7.7%7Worked at home

Time leaving home to go to work
![Time leaving home to go to work]()
- 1412:00 a.m. to 4:59 a.m.
- 15:00 a.m. to 5:29 a.m.
- 165:30 a.m. to 5:59 a.m.
- 36:00 a.m. to 6:29 a.m.
- 286:30 a.m. to 6:59 a.m.
- 217:00 a.m. to 7:29 a.m.
- 217:30 a.m. to 7:59 a.m.
- 198:00 a.m. to 8:29 a.m.
- 98:30 a.m. to 8:59 a.m.
- 139:00 a.m. to 9:59 a.m.
- 510:00 a.m. to 10:59 a.m.
- 111:00 a.m. to 11:59 a.m.
- 1712:00 p.m. to 3:59 p.m.
- 174:00 p.m. to 11:59 p.m.

Occupations of males:
- Percentage of males in management occupations (except farmers):
Here: 2.8% city: 9.8%
- Percentage of males in business and financial operations occupations:
Here: 12.5% city: 4.2%
- Percentage of males in computer and mathematical occupations:
Here: 4.7% city: 2.7%
- Percentage of males in legal occupations:
Here: 1.8% city: 0.6%
- Percentage of males in education, training, and library occupations:
Here: 3.4% city: 3.4%
- Percentage of males in healthcare practitioners and technical occupations:
Here: 3.0% city: 6.2%
- Percentage of males in service occupations:
Here: 14.5% city: 12.5%
- Percentage of males in sales and office occupations:
Here: 14.8% city: 13.8%
- Percentage of males in construction, extraction, and maintenance occupations:
Here: 10.3% city: 11.9%
- Percentage of males in production occupations:
Here: 15.9% city: 10.4%
- Percentage of males in transportation occupations:
Here: 13.4% city: 9.7%
- Percentage of males in material moving occupations:
Here: 9.6% city: 3.8%
Occupations of females:
- Percentage of females in management occupations (except farmers):
Here: 8.4% city: 6.0%
- Percentage of females in business and financial operations occupations:
Here: 1.5% city: 7.0%
- Percentage of females in computer and mathematical occupations:
Here: 1.7% city: 0.9%
- Percentage of females in life, physical, and social science occupations:
Here: 1.9% city: 1.0%
- Percentage of females in legal occupations:
Here: 1.2% city: 1.6%
- Percentage of females in education, training, and library occupations:
Here: 5.0% city: 13.4%
- Percentage of females in arts, design, entertainment, sports, and media occupations:
Here: 7.3% city: 1.1%
- Percentage of females in healthcare practitioners and technical occupations:
Here: 17.0% city: 16.1%
- Percentage of females in service occupations:
Here: 18.7% city: 13.4%
- Percentage of females in sales and office occupations:
Here: 38.2% city: 31.2%
- Percentage of females in production occupations:
Here: 2.9% city: 3.2%
- Percentage of females in transportation occupations:
Here: 5.8% city: 1.0%
- Percentage of females in material moving occupations:
Here: 2.2% city: 1.6%
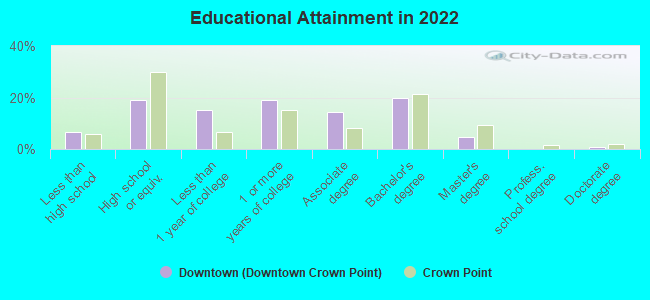
Education in this neighborhood (subdivision or community):
- Percentage of people 3 years and older in K-12 schools:
Downtown (Downtown Crown Point): 9.4% Crown Point: 18.0%
- Percentage of people 3 years and older in undergraduate colleges:
Downtown (Downtown Crown Point): 7.6% Crown Point: 3.8%
- Percentage of people 3 years and older in grad. or professional schools:
Downtown (Downtown Crown Point): 0.6% Crown Point: 0.7%
- Percentage of students K-12 enrolled in private schools:
Downtown (Downtown Crown Point): 37.5% Crown Point: 10.0%
Percentage of population below poverty level:
| Downtown (Downtown Crown Point): | 5.9% |
| Crown Point: | 6.1% |
Median year owner moved in (as recorded in 2022):
Median year renter moved in (as recorded in 2022):
| Downtown (Downtown Crown Point): | 2008 |
| Crown Point: | 2010 |
Median year renter moved in (as recorded in 2022):
| Downtown (Downtown Crown Point): | 2016 |
| Crown Point: | 2018 |
Percentage of married-couple families with both working:
| Downtown (Downtown Crown Point): | 70.4% |
| Crown Point: | 75.4% |
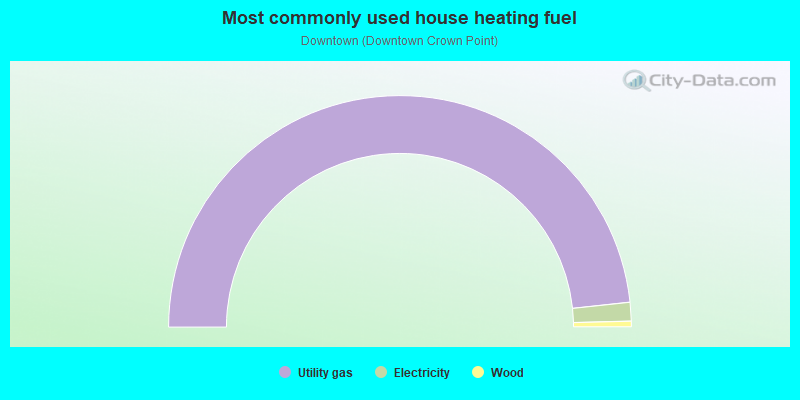
- 96.6%Utility gas
- 2.6%Electricity
- 0.8%Wood
Highways in this neighborhood:
W 109th Ave (US Hwy 231, W State Rd 231, W Joliet St)
Length: 0.54 miles
Direction: E-W
Address range: 400 to 699
Direction: E-W
Address range: 400 to 699
S Main St
Length: 0.36 miles
Directions: E-W, N-S, SE-NW, SW-NE
Address range: 100 to 399
Directions: E-W, N-S, SE-NW, SW-NE
Address range: 100 to 399
US Hwy 231 (W Joliet St, W State Rd 231)
Length: 0.16 miles
Directions: E-W, SE-NW
Address range: 1 to 399
Directions: E-W, SE-NW
Address range: 1 to 399
State Rd 55 (US Hwy 231, E Joliet St)
Length: 0.13 miles
Direction: E-W
Address range: 100 to 399
Direction: E-W
Address range: 100 to 399
Roads and streets:
W Walnut St
Length: 0.60 miles
Direction: E-W
Address range: 1 to 599
Direction: E-W
Address range: 1 to 599
S East St
Length: 0.35 miles
Direction: N-S
Address range: 100 to 399
Direction: N-S
Address range: 100 to 399
E South St
Length: 0.34 miles
Directions: E-W, SE-NW
Address range: 101 to 298
Directions: E-W, SE-NW
Address range: 101 to 298
W North St
Length: 0.33 miles
Direction: E-W
Address range: 117 to 399
Direction: E-W
Address range: 117 to 399
S West St
Length: 0.31 miles
Direction: N-S
Address range: 100 to 399
Direction: N-S
Address range: 100 to 399
S Court St
Length: 0.29 miles
Direction: N-S
Address range: 1 to 399
Direction: N-S
Address range: 1 to 399
N Main St
Length: 0.25 miles
Direction: N-S
Address range: 100 to 219
Direction: N-S
Address range: 100 to 219
Harrington Ave
Length: 0.24 miles
Direction: N-S
Address range: 100 to 199
Direction: N-S
Address range: 100 to 199
E Clark St
Length: 0.23 miles
Direction: E-W
Address range: 1 to 399
Direction: E-W
Address range: 1 to 399
N East St
Length: 0.22 miles
Direction: N-S
Address range: 100 to 299
Direction: N-S
Address range: 100 to 299
W Robinson St
Length: 0.22 miles
Direction: E-W
Address range: 128 to 138
Direction: E-W
Address range: 128 to 138
N Court St
Length: 0.21 miles
Direction: N-S
Address range: 1 to 205
Direction: N-S
Address range: 1 to 205
N West St
Length: 0.20 miles
Direction: N-S
Address range: 100 to 199
Direction: N-S
Address range: 100 to 199
Hoffman Ct
Length: 0.18 miles
Directions: E-W, N-S
Address range: 300 to 398
Directions: E-W, N-S
Address range: 300 to 398
E Walnut St
Length: 0.16 miles
Directions: E-W, SE-NW
Address range: 216 to 224
Directions: E-W, SE-NW
Address range: 216 to 224
Rosary Ln
Length: 0.16 miles
Directions: N-S, SE-NW
Directions: N-S, SE-NW
W School Ct
Length: 0.16 miles
Direction: E-W
Address range: 100 to 144
Direction: E-W
Address range: 100 to 144
E North St
Length: 0.15 miles
Direction: E-W
Address range: 100 to 299
Direction: E-W
Address range: 100 to 299
S Nichols St
Length: 0.12 miles
Direction: N-S
Address range: 100 to 199
Direction: N-S
Address range: 100 to 199
E Hack Ct
Length: 0.08 miles
Direction: E-W
Address range: 100 to 199
Direction: E-W
Address range: 100 to 199
E School Ct
Length: 0.08 miles
Direction: E-W
Direction: E-W
Parry Ct
Length: 0.08 miles
Direction: E-W
Address range: 100 to 199
Direction: E-W
Address range: 100 to 199
E Robinson Ct
Length: 0.08 miles
Directions: E-W, SE-NW
Address range: 100 to 199
Directions: E-W, SE-NW
Address range: 100 to 199
W Hack Ct
Length: 0.08 miles
Direction: E-W
Address range: 100 to 199
Direction: E-W
Address range: 100 to 199
W Clark St
Length: 0.08 miles
Direction: E-W
Address range: 100 to 199
Direction: E-W
Address range: 100 to 199
Farragut St
Length: 0.07 miles
Direction: E-W
Address range: 200 to 299
Direction: E-W
Address range: 200 to 299
N Sherman St
Length: 0.06 miles
Direction: N-S
Address range: 200 to 299
Direction: N-S
Address range: 200 to 299
Kristie Ct
Length: 0.02 miles
Directions: E-W, N-S
Address range: 340 to 350
Directions: E-W, N-S
Address range: 340 to 350
Walnut Pkwy
Length: 0.00 miles
Direction: N-S
Direction: N-S