Downtown Glendale neighborhood in Glendale, California (CA), 91203, 91204, 91205, 91206 detailed profile
Settings
X


Business Search - 14 Million verified businesses
Area: 0.185 square miles
Population: 3,032
Population density:
| Downtown Glendale: | 16,415 people per square mile |
| Glendale: | 6,175 people per square mile |

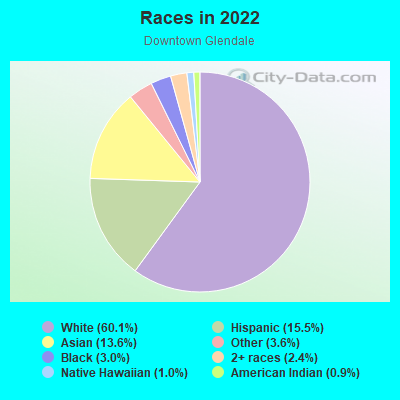
- 1,88560.1%White
- 48615.5%Hispanic or Latino
- 42613.6%Asian
- 1133.6%Some other race
- 953.0%Black
- 752.4%Two or more races
- 301.0%Native Hawaiian and Other
Pacific Islander - 270.9%American Indian
Median household income in 2022:
| Downtown Glendale: | $60,817 |
| Glendale: | $77,483 |
Distribution of median household income
![Distribution of median household income]()
- 66Less than $10,000
- 281$10,000 to $19,999
- 239$20,000 to $29,999
- 55$30,000 to $39,999
- 57$40,000 to $49,999
- 71$50,000 to $59,999
- 56$60,000 to $74,999
- 190$75,000 to $99,999
- 127$100,000 to $124,999
- 42$125,000 to $149,999
- 136$150,000 to $199,999
- 164$200,000 or more

Distribution of owner-occupied house/condo value
![Distribution of owner-occupied house/condo value]()
- 28Less than $50,000
- 8$50,000 to $99,999
- 7$200,000 to $249,999
- 42$300,000 to $399,999
- 49$400,000 to $499,999
- 81$500,000 to $749,999
- 30$750,000 to $999,999
- 22$1,000,000 or more

Distribution of rent paid by renters
![Distribution of rent paid by renters]()
- 29$100 to $199
- 149$200 to $299
- 114$300 to $399
- 122$400 to $499
- 153$500 to $599
- 86$600 to $699
- 17$700 to $799
- 74$800 to $899
- 32$900 to $999
- 60$1,000 to $1,249
- 116$1,250 to $1,499
- 188$1,500 to $1,999
- 510$2,000 or more

Median rent in 2022:
| Downtown Glendale: | $1,761 |
| Glendale: | $1,842 |
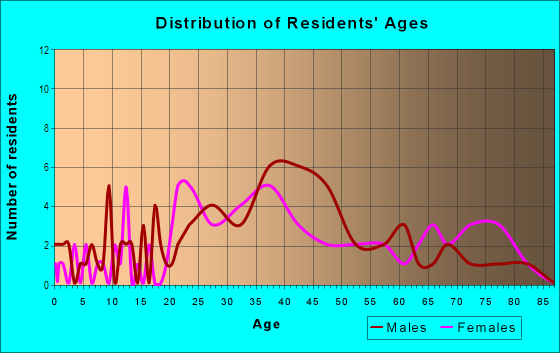
| Males: | 1,403 |
| Females: | 1,629 |
Males:
| This neighborhood: | 36.3 years |
| Whole city: | 41.8 years |
| This neighborhood: | 41.9 years |
| Whole city: | 43.4 years |
Average household size:
| Downtown Glendale: | 8.9 people |
| Glendale: | 2.5 people |
Percentage of family households:
| Downtown Glendale: | 25.7% |
| Glendale: | 40.0% |
| Here: | 34.5% |
| Glendale: | 44.2% |
Percentage of married-couple families with children (among all households):
| Downtown Glendale: | 45.5% |
| Glendale: | 30.5% |
Percentage of single-mother households (among all households):
| Downtown Glendale: | 4.8% |
| Glendale: | 7.0% |
Percentage of never married males 15 years old and over:
Percentage of never married females 15 years old and over:
| Downtown Glendale: | 19.1% |
| Glendale: | 18.4% |
Percentage of never married females 15 years old and over:
| Downtown Glendale: | 17.8% |
| city: | 18.3% |
Percentage of people that speak English not well or not at all:
| Downtown Glendale: | 25.6% |
| Glendale: | 12.5% |
Percentage of people born in this state:
Percentage of people born in another U.S. state:
Percentage of native residents but born outside the U.S.:
Percentage of foreign born residents:
| Here: | 29.0% |
| Glendale: | 38.0% |
Percentage of people born in another U.S. state:
| Downtown Glendale: | 10.3% |
| Glendale: | 11.6% |
Percentage of native residents but born outside the U.S.:
| Here: | 0.6% |
| city: | 1.5% |
Percentage of foreign born residents:
| Here: | 60.1% |
| Glendale: | 48.9% |
Owner-occupied
Renter-occupied


- Rooms in owner-occupied houses and condos in Downtown Glendale
- 71 room
- 62 rooms
- 303 rooms
- 1004 rooms
- 365 rooms
- 116 rooms
- 177 rooms
- 98 rooms
- 09+ rooms
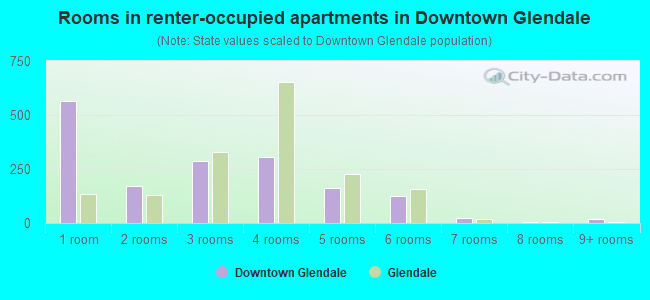
- Rooms in renter-occupied apartments in Downtown Glendale
- 5651 room
- 1692 rooms
- 2873 rooms
- 3044 rooms
- 1605 rooms
- 1256 rooms
- 217 rooms
- 68 rooms
- 189+ rooms
Owner-occupied
Renter-occupied

- Bedrooms in owner-occupied houses and condos in Downtown Glendale
- 7no bedroom
- 131 bedroom
- 1372 bedrooms
- 273 bedrooms
- 94 bedrooms
- 05+ bedrooms
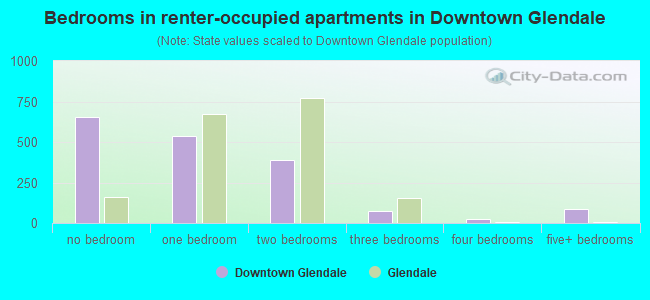
- Bedrooms in renter-occupied apartments in Downtown Glendale
- 653no bedroom
- 5401 bedroom
- 3902 bedrooms
- 763 bedrooms
- 224 bedrooms
- 885+ bedrooms
Average number of cars or other vehicles available in houses/condos:
Average number of cars or other vehicles available in apartments:
| This neighborhood: | |
| Glendale: |
Average number of cars or other vehicles available in apartments:
| Here: | 1.0 |
| city: | 1.4 |
Percentage of units with a mortgage:
| Downtown Glendale: | 60.3% |
| Glendale: | 73.0% |
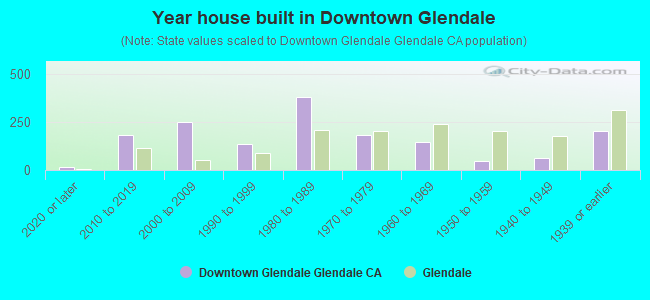
- Year house built in Downtown Glendale
- 182020 or later
- 1812010 to 2019
- 2492000 to 2009
- 1351990 to 1999
- 3771980 to 1989
- 1791970 to 1979
- 1461960 to 1969
- 481950 to 1959
- 631940 to 1949
- 2011939 or earlier

City-data.com crime index for city in 2020 (higher means more crime):
| City: | 110.5 |
| U.S. average: | 219.5 |
Travel time to work (commute)
![Travel time to work (commute)]()
- 3Less than 5 minutes
- 575 to 9 minutes
- 27310 to 14 minutes
- 28715 to 19 minutes
- 12920 to 24 minutes
- 5225 to 29 minutes
- 29430 to 34 minutes
- 3035 to 39 minutes
- 6940 to 44 minutes
- 12545 to 59 minutes
- 6160 to 89 minutes
- 2690 or more minutes

Means of transportation to work
![Means of transportation to work]()
- 68.8%980Drove a car alone
- 3.3%47Carpooled
- 2.6%37Bus
- 1.0%14Taxi
- 0.4%6Bicycle
- 5.9%84Walked
- 1.5%21Other means
- 17.2%245Worked at home

Time leaving home to go to work
![Time leaving home to go to work]()
- 2912:00 a.m. to 4:59 a.m.
- 385:00 a.m. to 5:29 a.m.
- 405:30 a.m. to 5:59 a.m.
- 556:00 a.m. to 6:29 a.m.
- 516:30 a.m. to 6:59 a.m.
- 1907:00 a.m. to 7:29 a.m.
- 607:30 a.m. to 7:59 a.m.
- 1918:00 a.m. to 8:29 a.m.
- 908:30 a.m. to 8:59 a.m.
- 2519:00 a.m. to 9:59 a.m.
- 19610:00 a.m. to 10:59 a.m.
- 2211:00 a.m. to 11:59 a.m.
- 14112:00 p.m. to 3:59 p.m.
- 464:00 p.m. to 11:59 p.m.

Occupations of males:
- Percentage of males in management occupations (except farmers):
Here: 13.5% city: 12.9%
- Percentage of males in business and financial operations occupations:
Here: 3.5% city: 4.8%
- Percentage of males in computer and mathematical occupations:
Here: 3.3% city: 5.2%
- Percentage of males in architecture and engineering occupations:
Here: 5.3% city: 4.1%
- Percentage of males in community and social services occupations:
Here: 1.3% city: 1.3%
- Percentage of males in legal occupations:
Here: 4.8% city: 1.2%
- Percentage of males in education, training, and library occupations:
Here: 1.7% city: 2.0%
- Percentage of males in arts, design, entertainment, sports, and media occupations:
Here: 12.8% city: 8.9%
- Percentage of males in healthcare practitioners and technical occupations:
Here: 5.0% city: 5.5%
- Percentage of males in service occupations:
Here: 10.8% city: 11.8%
- Percentage of males in sales and office occupations:
Here: 20.7% city: 18.3%
- Percentage of males in construction, extraction, and maintenance occupations:
Here: 2.7% city: 5.5%
- Percentage of males in transportation occupations:
Here: 8.0% city: 6.0%
Occupations of females:
- Percentage of females in management occupations (except farmers):
Here: 13.4% city: 10.3%
- Percentage of females in business and financial operations occupations:
Here: 10.5% city: 6.1%
- Percentage of females in computer and mathematical occupations:
Here: 5.7% city: 1.6%
- Percentage of females in architecture and engineering occupations:
Here: 1.7% city: 1.0%
- Percentage of females in life, physical, and social science occupations:
Here: 1.9% city: 1.5%
- Percentage of females in community and social services occupations:
Here: 1.9% city: 2.8%
- Percentage of females in legal occupations:
Here: 1.4% city: 2.6%
- Percentage of females in education, training, and library occupations:
Here: 3.4% city: 9.4%
- Percentage of females in arts, design, entertainment, sports, and media occupations:
Here: 3.2% city: 6.1%
- Percentage of females in healthcare practitioners and technical occupations:
Here: 8.7% city: 10.7%
- Percentage of females in service occupations:
Here: 18.7% city: 18.3%
- Percentage of females in sales and office occupations:
Here: 16.5% city: 26.5%
- Percentage of females in farming, fishing, and forestry occupations:
Here: 2.1% city: 0.2%
- Percentage of females in production occupations:
Here: 7.2% city: 1.5%
- Percentage of females in material moving occupations:
Here: 3.7% city: 0.7%
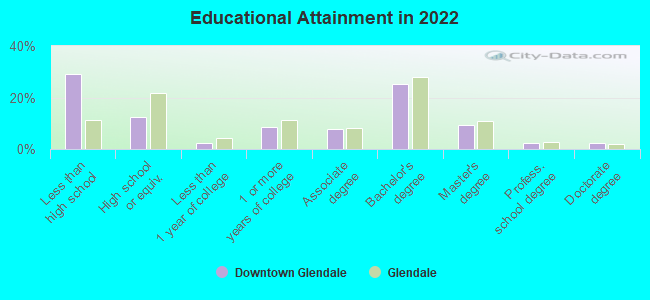
Education in this neighborhood (subdivision or community):
- Percentage of people 3 years and older in K-12 schools:
Downtown Glendale: 13.5% Glendale: 14.1%
- Percentage of people 3 years and older in undergraduate colleges:
Downtown Glendale: 5.2% Glendale: 5.2%
- Percentage of people 3 years and older in grad. or professional schools:
Downtown Glendale: 2.4% Glendale: 1.9%
- Percentage of students K-12 enrolled in private schools:
Downtown Glendale: 33.0% Glendale: 9.3%
Percentage of population below poverty level:
| Downtown Glendale: | 23.7% |
| Glendale: | 13.0% |
Median year renter moved in (as recorded in 2022):
| Downtown Glendale: | 2015 |
| Glendale: | 2018 |
Percentage of married-couple families with both working:
| Downtown Glendale: | 61.1% |
| Glendale: | 66.7% |

- 52.9%Utility gas
- 37.9%Electricity
- 3.7%No fuel used
- 2.0%Coal or coke
- 1.8%Bottled, tank, or LP gas
- 1.7%Fuel oil, kerosene, etc.
Roads and streets:
S Brand Blvd
Length: 0.51 miles
Direction: N-S
Address range: 100 to 299
Direction: N-S
Address range: 100 to 299
N Brand Blvd
Length: 0.25 miles
Direction: N-S
Address range: 100 to 299
Direction: N-S
Address range: 100 to 299
N Maryland Ave
Length: 0.25 miles
Direction: N-S
Address range: 100 to 299
Direction: N-S
Address range: 100 to 299
N Orange St
Length: 0.24 miles
Direction: N-S
Address range: 100 to 299
Direction: N-S
Address range: 100 to 299
S Orange St
Length: 0.20 miles
Direction: N-S
Address range: 100 to 299
Direction: N-S
Address range: 100 to 299
E Broadway
Length: 0.17 miles
Direction: E-W
Address range: 100 to 299
Direction: E-W
Address range: 100 to 299
E Harvard St
Length: 0.17 miles
Direction: E-W
Address range: 100 to 299
Direction: E-W
Address range: 100 to 299
E Colorado St
Length: 0.17 miles
Direction: E-W
Address range: 100 to 299
Direction: E-W
Address range: 100 to 299
E California Ave
Length: 0.17 miles
Direction: E-W
Address range: 100 to 299
Direction: E-W
Address range: 100 to 299
E Wilson Ave
Length: 0.16 miles
Direction: E-W
Address range: 100 to 299
Direction: E-W
Address range: 100 to 299
S Maryland Ave
Length: 0.13 miles
Direction: N-S
Address range: 100 to 199
Direction: N-S
Address range: 100 to 199
W Broadway
Length: 0.09 miles
Direction: E-W
Address range: 2 to 199
Direction: E-W
Address range: 2 to 199
W Wilson Ave
Length: 0.09 miles
Direction: E-W
Address range: 100 to 199
Direction: E-W
Address range: 100 to 199
W California Ave
Length: 0.09 miles
Direction: E-W
Address range: 100 to 199
Direction: E-W
Address range: 100 to 199
W Harvard St
Length: 0.09 miles
Direction: E-W
Address range: 100 to 199
Direction: E-W
Address range: 100 to 199
W Colorado St
Length: 0.09 miles
Direction: E-W
Address range: 100 to 248
Direction: E-W
Address range: 100 to 248