Downtown neighborhood in Hobart, Indiana (IN), 46342 detailed profile
Settings
X


Business Search - 14 Million verified businesses
Area: 0.280 square miles
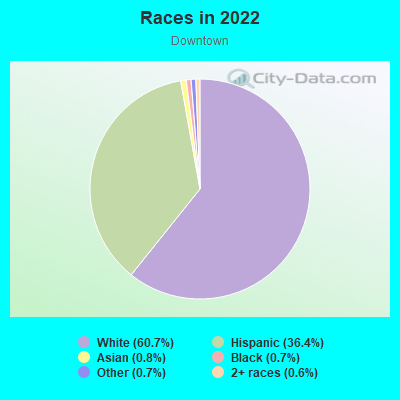
Population: 561
Population density:
| Downtown: | 2,003 people per square mile |
| Hobart: | 1,128 people per square mile |

- 37964.0%White
- 14424.3%Hispanic or Latino
- 366.1%Asian
- 172.9%Black
- 132.2%Two or more races
- 30.5%Some other race
Median household income in 2022:
| Downtown: | $66,736 |
| Hobart: | $69,398 |
Distribution of median household income
![Distribution of median household income]()
- 32Less than $10,000
- 36$10,000 to $19,999
- 31$20,000 to $29,999
- 34$30,000 to $39,999
- 54$40,000 to $49,999
- 17$50,000 to $59,999
- 43$60,000 to $74,999
- 53$75,000 to $99,999
- 37$100,000 to $124,999
- 31$125,000 to $149,999
- 12$150,000 to $199,999
- 15$200,000 or more

Distribution of owner-occupied house/condo value
![Distribution of owner-occupied house/condo value]()
- 16Less than $50,000
- 62$50,000 to $99,999
- 54$100,000 to $149,999
- 34$150,000 to $199,999
- 43$200,000 to $249,999
- 10$250,000 to $299,999
- 33$300,000 to $399,999
- 17$400,000 to $499,999
- 4$500,000 to $749,999
- 13$1,000,000 or more

Distribution of rent paid by renters
![Distribution of rent paid by renters]()
- 61$100 to $199
- 3$200 to $299
- 78$400 to $499
- 39$500 to $599
- 44$600 to $699
- 36$700 to $799
- 46$800 to $899
- 13$900 to $999
- 26$1,000 to $1,249
- 62$1,250 to $1,499
- 4$1,500 to $1,999
- 2$2,000 or more

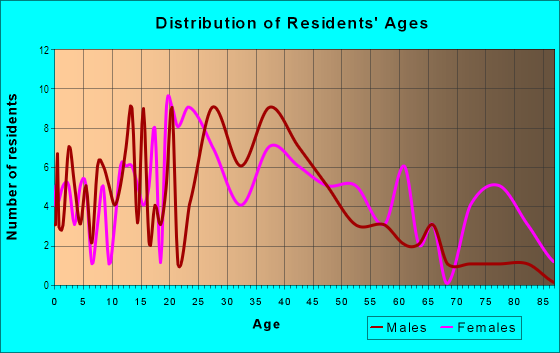
| Males: | 257 |
| Females: | 303 |
Males:
| This neighborhood: | 41.0 years |
| Whole city: | 38.7 years |
| This neighborhood: | 44.5 years |
| Whole city: | 41.0 years |
Average household size:
| Downtown: | 2.3 people |
| Hobart: | 2.4 people |
Percentage of family households:
| Downtown: | 31.3% |
| Hobart: | 45.2% |
| Here: | 29.5% |
| Hobart: | 41.9% |
Percentage of married-couple families with children (among all households):
| Downtown: | 17.3% |
| Hobart: | 25.1% |
Percentage of single-mother households (among all households):
| Downtown: | 45.1% |
| Hobart: | 9.3% |
Percentage of never married males 15 years old and over:
Percentage of never married females 15 years old and over:
| Downtown: | 20.7% |
| Hobart: | 18.5% |
Percentage of never married females 15 years old and over:
| Downtown: | 12.2% |
| city: | 14.7% |
Percentage of people that speak English not well or not at all:
| Downtown: | 0.9% |
| Hobart: | 1.0% |
Percentage of people born in this state:
Percentage of people born in another U.S. state:
Percentage of native residents but born outside the U.S.:
Percentage of foreign born residents:
| Here: | 71.6% |
| Hobart: | 66.0% |
Percentage of people born in another U.S. state:
| Downtown: | 22.3% |
| Hobart: | 28.7% |
Percentage of native residents but born outside the U.S.:
| Here: | 1.1% |
| city: | 0.9% |
Percentage of foreign born residents:
| Here: | 5.0% |
| Hobart: | 4.4% |

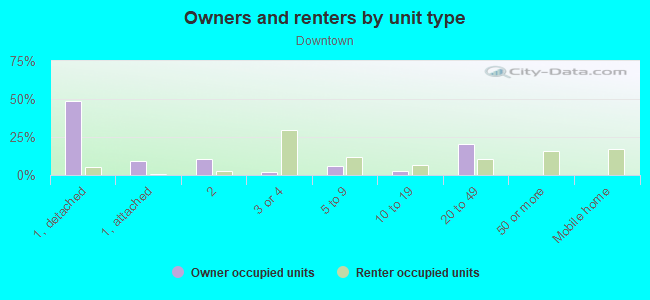
Owner-occupied
Renter-occupied

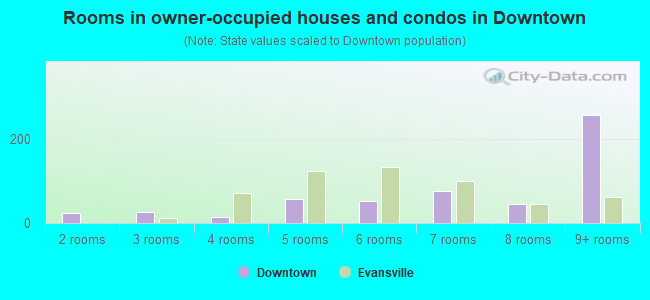
- Rooms in owner-occupied houses and condos in Downtown
- 01 room
- 02 rooms
- 123 rooms
- 314 rooms
- 235 rooms
- 356 rooms
- 247 rooms
- 148 rooms
- 359+ rooms
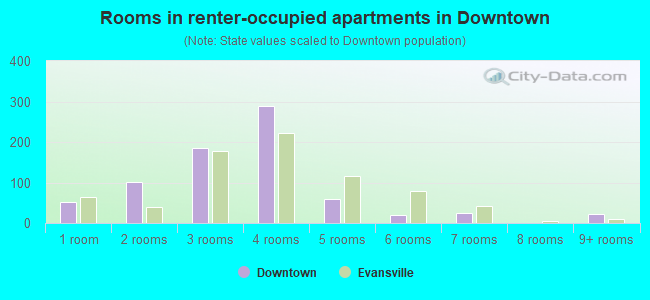
- Rooms in renter-occupied apartments in Downtown
- 741 room
- 152 rooms
- 303 rooms
- 304 rooms
- 545 rooms
- 306 rooms
- 87 rooms
- 608 rooms
- 239+ rooms
Owner-occupied
Renter-occupied
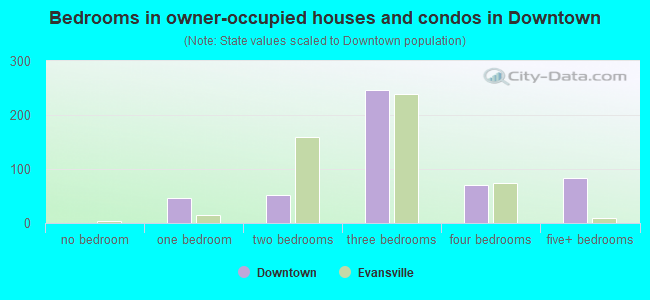
- Bedrooms in owner-occupied houses and condos in Downtown
- 0no bedroom
- 121 bedroom
- 492 bedrooms
- 973 bedrooms
- 434 bedrooms
- 105+ bedrooms
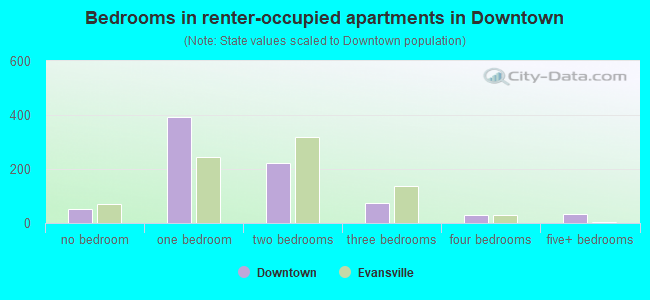
- Bedrooms in renter-occupied apartments in Downtown
- 74no bedroom
- 411 bedroom
- 962 bedrooms
- 323 bedrooms
- 844 bedrooms
- 05+ bedrooms
Average number of cars or other vehicles available in houses/condos:
Average number of cars or other vehicles available in apartments:
| This neighborhood: | 3.1 |
| Hobart: | 2.1 |
Average number of cars or other vehicles available in apartments:
| Here: | |
| city: |
Percentage of units with a mortgage:
| Downtown: | 65.9% |
| Hobart: | 66.9% |
Average estimated value of detached houses in 2022 (61.2% of all units):
| Downtown: | $199,961 |
| Indiana: | $257,916 |
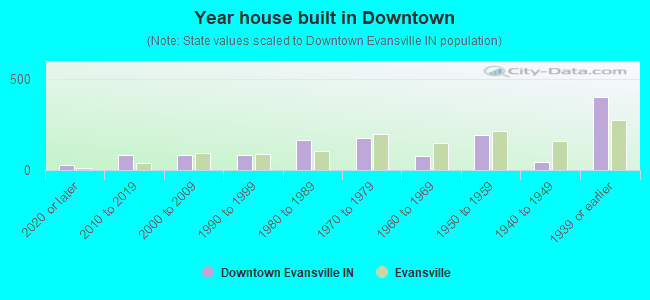
- Year house built in Downtown
- 52020 or later
- 32010 to 2019
- 412000 to 2009
- 321990 to 1999
- 1161980 to 1989
- 321970 to 1979
- 701960 to 1969
- 281950 to 1959
- 331940 to 1949
- 951939 or earlier
City-data.com crime index for city in 2020 (higher means more crime):
| City: | 194.7 |
| U.S. average: | 219.5 |
Travel time to work (commute)
![Travel time to work (commute)]()
- 7Less than 5 minutes
- 515 to 9 minutes
- 2710 to 14 minutes
- 4515 to 19 minutes
- 7320 to 24 minutes
- 2625 to 29 minutes
- 4630 to 34 minutes
- 1735 to 39 minutes
- 1940 to 44 minutes
- 1145 to 59 minutes
- 3960 to 89 minutes
- 790 or more minutes

Means of transportation to work
![Means of transportation to work]()
- 89.8%267Drove a car alone
- 5.0%15Carpooled
- 0.3%1Long-distance train or commuter rail
- 2.4%7Other means
- 18.5%55Worked at home

Time leaving home to go to work
![Time leaving home to go to work]()
- 4012:00 a.m. to 4:59 a.m.
- 325:00 a.m. to 5:29 a.m.
- 125:30 a.m. to 5:59 a.m.
- 596:00 a.m. to 6:29 a.m.
- 326:30 a.m. to 6:59 a.m.
- 507:00 a.m. to 7:29 a.m.
- 327:30 a.m. to 7:59 a.m.
- 368:00 a.m. to 8:29 a.m.
- 138:30 a.m. to 8:59 a.m.
- 149:00 a.m. to 9:59 a.m.
- 510:00 a.m. to 10:59 a.m.
- 711:00 a.m. to 11:59 a.m.
- 2012:00 p.m. to 3:59 p.m.
- 294:00 p.m. to 11:59 p.m.

Occupations of males:
- Percentage of males in management occupations (except farmers):
Here: 7.3% city: 8.1%
- Percentage of males in computer and mathematical occupations:
Here: 2.7% city: 2.7%
- Percentage of males in architecture and engineering occupations:
Here: 4.8% city: 3.7%
- Percentage of males in life, physical, and social science occupations:
Here: 8.8% city: 2.1%
- Percentage of males in community and social services occupations:
Here: 3.3% city: 1.7%
- Percentage of males in education, training, and library occupations:
Here: 1.2% city: 1.5%
- Percentage of males in healthcare practitioners and technical occupations:
Here: 4.6% city: 1.4%
- Percentage of males in service occupations:
Here: 15.7% city: 15.1%
- Percentage of males in sales and office occupations:
Here: 1.3% city: 9.7%
- Percentage of males in construction, extraction, and maintenance occupations:
Here: 17.5% city: 12.6%
- Percentage of males in production occupations:
Here: 20.4% city: 14.2%
- Percentage of males in material moving occupations:
Here: 9.4% city: 6.1%
Occupations of females:
- Percentage of females in management occupations (except farmers):
Here: 6.6% city: 8.4%
- Percentage of females in business and financial operations occupations:
Here: 1.2% city: 5.2%
- Percentage of females in architecture and engineering occupations:
Here: 1.5% city: 0.9%
- Percentage of females in education, training, and library occupations:
Here: 11.8% city: 8.3%
- Percentage of females in arts, design, entertainment, sports, and media occupations:
Here: 2.0% city: 1.1%
- Percentage of females in healthcare practitioners and technical occupations:
Here: 8.6% city: 11.1%
- Percentage of females in service occupations:
Here: 6.3% city: 20.8%
- Percentage of females in sales and office occupations:
Here: 52.6% city: 35.1%
- Percentage of females in transportation occupations:
Here: 1.9% city: 0.9%
- Percentage of females in material moving occupations:
Here: 8.2% city: 2.8%
Percentage of people 16-64 in Armed Forces:
| Downtown: | 0.7% |
| Hobart: | 0.4% |
Education in this neighborhood (subdivision or community):
- Percentage of people 3 years and older in K-12 schools:
Downtown: 30.3% Hobart: 17.1%
- Percentage of people 3 years and older in undergraduate colleges:
Downtown: 7.0% Hobart: 4.2%
- Percentage of people 3 years and older in grad. or professional schools:
Downtown: 8.8% Hobart: 0.9%
- Percentage of students K-12 enrolled in private schools:
Downtown: 1.8% Hobart: 5.1%
Percentage of population below poverty level:
| Downtown: | 8.4% |
| Hobart: | 14.0% |
Median year owner moved in (as recorded in 2022):
| Downtown: | 2005 |
| Hobart: | 2007 |
Percentage of married-couple families with both working:
| Downtown: | 116.1% |
| Hobart: | 70.4% |
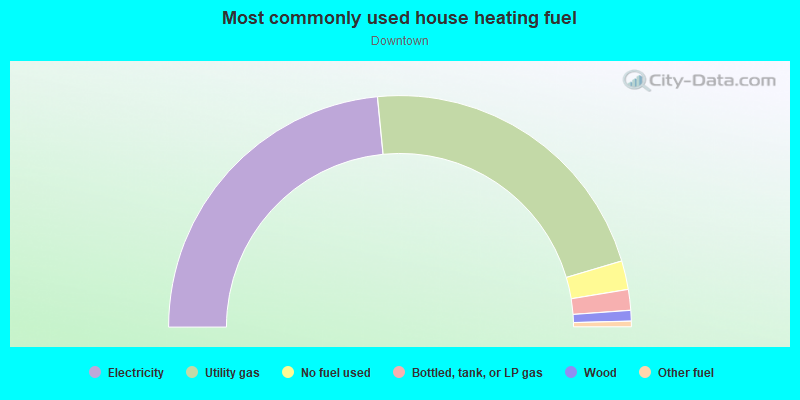
- 83.9%Utility gas
- 6.1%Electricity
- 4.9%Bottled, tank, or LP gas
- 4.0%Wood
- 1.0%No fuel used
Highways in this neighborhood:
State Rd 51 (E 3rd St)
Length: 0.42 miles
Direction: E-W
Address range: 300 to 765
Direction: E-W
Address range: 300 to 765
Roads and streets:
Main St
Length: 0.78 miles
Directions: N-S, SE-NW, SW-NE
Address range: 1 to 998
Directions: N-S, SE-NW, SW-NE
Address range: 1 to 998
E 8th St
Length: 0.59 miles
Direction: E-W
Address range: 1 to 699
Direction: E-W
Address range: 1 to 699
Center St
Length: 0.50 miles
Directions: N-S, SE-NW, SW-NE
Address range: 16 to 599
Directions: N-S, SE-NW, SW-NE
Address range: 16 to 599
E 7th St
Length: 0.36 miles
Directions: E-W, SW-NE
Address range: 1 to 799
Directions: E-W, SW-NE
Address range: 1 to 799
E 6th St
Length: 0.27 miles
Directions: E-W, SW-NE
Address range: 200 to 599
Directions: E-W, SW-NE
Address range: 200 to 599
New St
Length: 0.27 miles
Directions: N-S, SE-NW
Address range: 200 to 499
Directions: N-S, SE-NW
Address range: 200 to 499
Water St
Length: 0.26 miles
Directions: E-W, N-S
Address range: 501 to 812
Directions: E-W, N-S
Address range: 501 to 812
E 4th St
Length: 0.26 miles
Directions: E-W, N-S, SW-NE
Address range: 400 to 799
Directions: E-W, N-S, SW-NE
Address range: 400 to 799
E 5th St
Length: 0.24 miles
Directions: E-W, N-S, SE-NW, SW-NE
Address range: 400 to 699
Directions: E-W, N-S, SE-NW, SW-NE
Address range: 400 to 699
E 2nd St
Length: 0.21 miles
Direction: E-W
Address range: 400 to 699
Direction: E-W
Address range: 400 to 699
Front St
Length: 0.20 miles
Directions: E-W, SW-NE
Address range: 400 to 699
Directions: E-W, SW-NE
Address range: 400 to 699
S Lake St
Length: 0.17 miles
Direction: N-S
Address range: 500 to 699
Direction: N-S
Address range: 500 to 699
Fleming St
Length: 0.17 miles
Directions: N-S, SW-NE
Address range: 600 to 799
Directions: N-S, SW-NE
Address range: 600 to 799
Lincoln St
Length: 0.17 miles
Direction: N-S
Address range: 600 to 799
Direction: N-S
Address range: 600 to 799
East St
Length: 0.15 miles
Direction: SE-NW
Address range: 200 to 699
Direction: SE-NW
Address range: 200 to 699
Lake St
Length: 0.12 miles
Direction: N-S
Address range: 700 to 799
Direction: N-S
Address range: 700 to 799
S State St
Length: 0.12 miles
Direction: N-S
Address range: 600 to 699
Direction: N-S
Address range: 600 to 699
Garfield St
Length: 0.09 miles
Direction: N-S
Address range: 301 to 799
Direction: N-S
Address range: 301 to 799
Springdale Dr
Length: 0.09 miles
Direction: E-W
Direction: E-W
Railroad features:
Soo Line RR
Length: 0.29 miles
Direction: E-W
Direction: E-W
Other features:
Duck Crk
Length: 0.51 miles
Directions: E-W, N-S, SE-NW, SW-NE
Directions: E-W, N-S, SE-NW, SW-NE