Downtown neighborhood in Hudson, Massachusetts (MA), 01749 detailed profile
Settings
X


Business Search - 14 Million verified businesses
Area: 0.231 square miles
Population: 8,054
Population density:
| Downtown: | 34,826 people per square mile |
| Hudson: | 2,711 people per square mile |

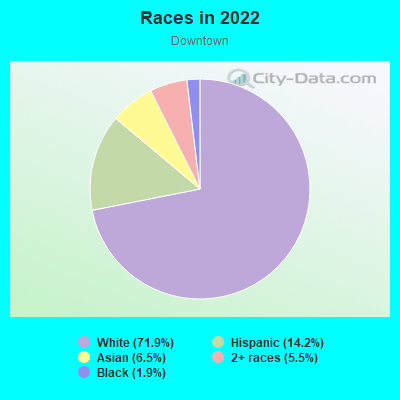
- 3,48338.3%White
- 2,72630.0%Black
- 1,45116.0%Hispanic or Latino
- 1,00611.1%Asian
- 2733.0%Two or more races
- 1331.5%Some other race
- 120.1%American Indian
Distribution of median household income
![Distribution of median household income]()
- 178Less than $10,000
- 300$10,000 to $19,999
- 296$20,000 to $29,999
- 302$30,000 to $39,999
- 310$40,000 to $49,999
- 208$50,000 to $59,999
- 204$60,000 to $74,999
- 328$75,000 to $99,999
- 353$100,000 to $124,999
- 302$125,000 to $149,999
- 464$150,000 to $199,999
- 796$200,000 or more

Distribution of owner-occupied house/condo value
![Distribution of owner-occupied house/condo value]()
- 844Less than $50,000
- 747$50,000 to $99,999
- 229$100,000 to $149,999
- 345$150,000 to $199,999
- 134$200,000 to $249,999
- 218$250,000 to $299,999
- 470$300,000 to $399,999
- 743$400,000 to $499,999
- 815$500,000 to $749,999
- 569$750,000 to $999,999
- 228$1,000,000 or more

Distribution of rent paid by renters
![Distribution of rent paid by renters]()
- 30Less than $100
- 198$100 to $199
- 76$200 to $299
- 253$300 to $399
- 351$400 to $499
- 578$500 to $599
- 37$600 to $699
- 201$700 to $799
- 85$800 to $899
- 110$900 to $999
- 123$1,000 to $1,249
- 316$1,250 to $1,499
- 313$1,500 to $1,999
- 742$2,000 or more

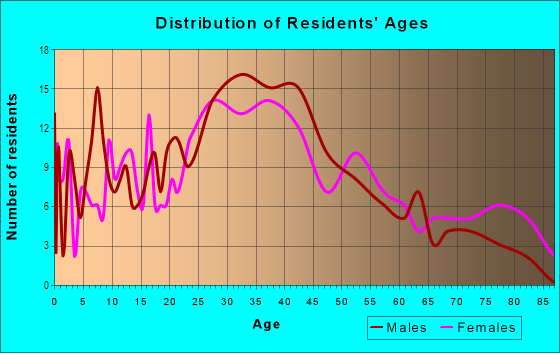
| Males: | 4,059 |
| Females: | 3,994 |
Males:
| This neighborhood: | 62.4 years |
| Whole city: | 42.3 years |
| This neighborhood: | 68.6 years |
| Whole city: | 46.2 years |
Average household size:
| Downtown: | 9.8 people |
| Hudson: | 2.4 people |
Percentage of family households:
| Downtown: | 46.1% |
| Hudson: | 43.1% |
| Here: | 50.7% |
| Hudson: | 48.9% |
Percentage of married-couple families with children (among all households):
| Downtown: | 31.0% |
| Hudson: | 36.2% |
Percentage of single-mother households (among all households):
| Downtown: | 8.3% |
| Hudson: | 4.6% |
Percentage of never married males 15 years old and over:
Percentage of never married females 15 years old and over:
| Downtown: | 20.6% |
| Hudson: | 17.1% |
Percentage of never married females 15 years old and over:
| Downtown: | 14.3% |
| place: | 15.3% |
Percentage of people that speak English not well or not at all:
| Downtown: | 5.7% |
| Hudson: | 5.5% |
Percentage of people born in this state:
Percentage of people born in another U.S. state:
Percentage of native residents but born outside the U.S.:
Percentage of foreign born residents:
| Here: | 55.8% |
| Hudson: | 59.6% |
Percentage of people born in another U.S. state:
| Downtown: | 10.9% |
| Hudson: | 20.3% |
Percentage of native residents but born outside the U.S.:
| Here: | 3.1% |
| place: | 1.1% |
Percentage of foreign born residents:
| Here: | 30.3% |
| Hudson: | 19.0% |
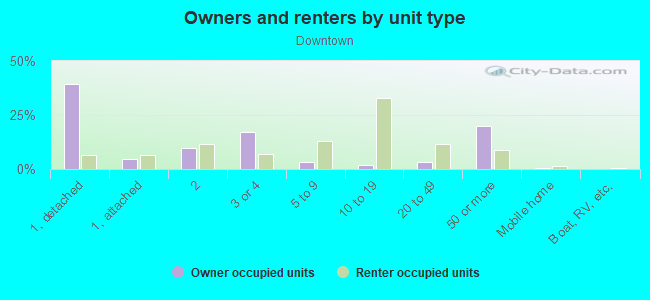
Owner-occupied
Renter-occupied

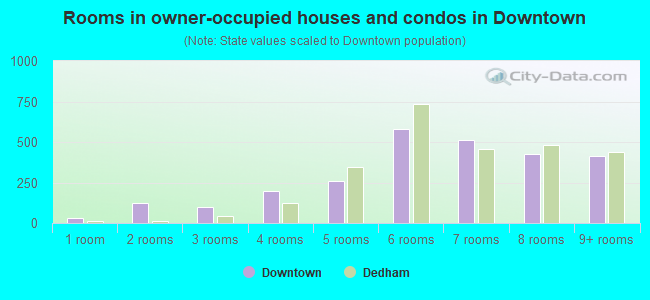
- Rooms in owner-occupied houses and condos in Downtown
- 281 room
- 1222 rooms
- 973 rooms
- 1984 rooms
- 2585 rooms
- 5836 rooms
- 5137 rooms
- 4298 rooms
- 4169+ rooms
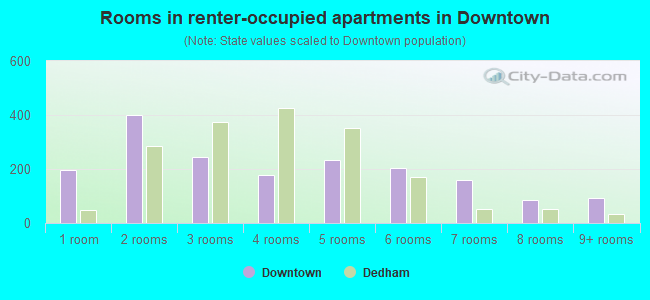
- Rooms in renter-occupied apartments in Downtown
- 1971 room
- 4012 rooms
- 2453 rooms
- 1774 rooms
- 2355 rooms
- 2046 rooms
- 1597 rooms
- 848 rooms
- 949+ rooms
Owner-occupied
Renter-occupied
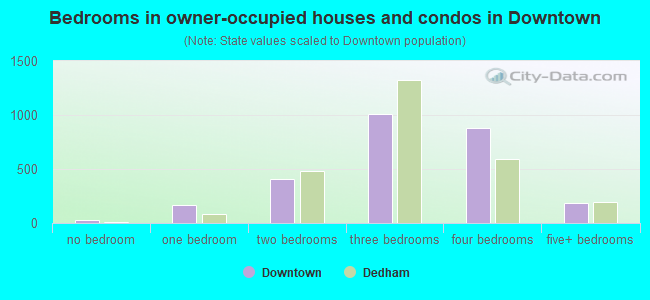
- Bedrooms in owner-occupied houses and condos in Downtown
- 28no bedroom
- 1711 bedroom
- 4082 bedrooms
- 1,0103 bedrooms
- 8844 bedrooms
- 1815+ bedrooms
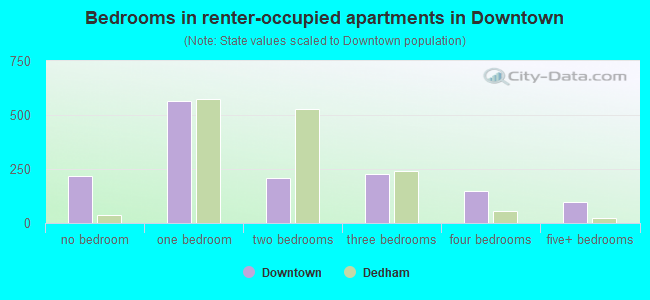
- Bedrooms in renter-occupied apartments in Downtown
- 219no bedroom
- 5651 bedroom
- 2082 bedrooms
- 2253 bedrooms
- 1484 bedrooms
- 975+ bedrooms
Average number of cars or other vehicles available in houses/condos:
Average number of cars or other vehicles available in apartments:
| This neighborhood: | 2.3 |
| Hudson: | 2.0 |
Average number of cars or other vehicles available in apartments:
| Here: | |
| place: |
Percentage of units with a mortgage:
| Downtown: | 70.7% |
| Hudson: | 58.3% |
Average estimated value of detached houses in 2022 (64.3% of all units):
| Downtown: | $751,453 |
| Hudson: | $478,107 |
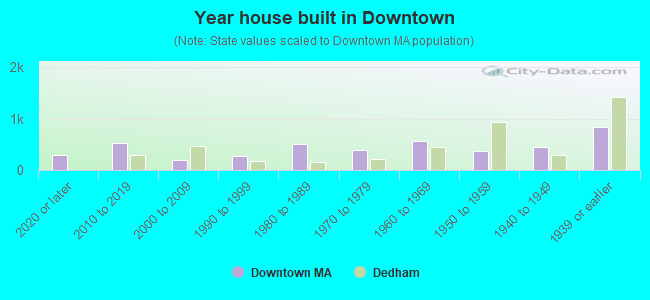
- Year house built in Downtown
- 2872020 or later
- 5312010 to 2019
- 2012000 to 2009
- 2741990 to 1999
- 4981980 to 1989
- 3981970 to 1979
- 5591960 to 1969
- 3661950 to 1959
- 4561940 to 1949
- 8441939 or earlier
City-data.com crime index for place in 2020 (higher means more crime):
| City: | 42.8 |
| U.S. average: | 219.5 |
Travel time to work (commute)
![Travel time to work (commute)]()
- 72Less than 5 minutes
- 2205 to 9 minutes
- 19410 to 14 minutes
- 34315 to 19 minutes
- 60020 to 24 minutes
- 18625 to 29 minutes
- 64930 to 34 minutes
- 10535 to 39 minutes
- 16140 to 44 minutes
- 72745 to 59 minutes
- 59760 to 89 minutes
- 16690 or more minutes

Means of transportation to work
![Means of transportation to work]()
- 73.3%2,998Drove a car alone
- 6.3%256Carpooled
- 5.3%216Bus
- 7.7%315Subway or elevated rail
- 3.8%155Long-distance train or commuter rail
- 1.6%64Light rail, streetcar or trolley
- 3.7%151Taxi
- 0.1%5Motorcycle
- 2.7%112Bicycle
- 5.7%234Walked
- 2.6%108Other means
- 14.3%585Worked at home

Time leaving home to go to work
![Time leaving home to go to work]()
- 20212:00 a.m. to 4:59 a.m.
- 1805:00 a.m. to 5:29 a.m.
- 2275:30 a.m. to 5:59 a.m.
- 4996:00 a.m. to 6:29 a.m.
- 4636:30 a.m. to 6:59 a.m.
- 3817:00 a.m. to 7:29 a.m.
- 3837:30 a.m. to 7:59 a.m.
- 5798:00 a.m. to 8:29 a.m.
- 1708:30 a.m. to 8:59 a.m.
- 2109:00 a.m. to 9:59 a.m.
- 22010:00 a.m. to 10:59 a.m.
- 2411:00 a.m. to 11:59 a.m.
- 18512:00 p.m. to 3:59 p.m.
- 3714:00 p.m. to 11:59 p.m.

Occupations of males:
- Percentage of males in management occupations (except farmers):
Here: 11.2% place: 17.6%
- Percentage of males in business and financial operations occupations:
Here: 9.2% place: 3.6%
- Percentage of males in computer and mathematical occupations:
Here: 6.6% place: 4.5%
- Percentage of males in architecture and engineering occupations:
Here: 6.2% place: 6.5%
- Percentage of males in community and social services occupations:
Here: 1.2% place: 0.5%
- Percentage of males in legal occupations:
Here: 1.0% place: 1.4%
- Percentage of males in education, training, and library occupations:
Here: 2.0% place: 4.7%
- Percentage of males in arts, design, entertainment, sports, and media occupations:
Here: 1.0% place: 3.4%
- Percentage of males in healthcare practitioners and technical occupations:
Here: 3.4% place: 3.4%
- Percentage of males in service occupations:
Here: 12.8% place: 13.7%
- Percentage of males in sales and office occupations:
Here: 16.8% place: 17.7%
- Percentage of males in construction, extraction, and maintenance occupations:
Here: 5.7% place: 7.1%
- Percentage of males in production occupations:
Here: 7.1% place: 5.2%
- Percentage of males in transportation occupations:
Here: 3.3% place: 2.9%
- Percentage of males in material moving occupations:
Here: 3.6% place: 2.1%
Occupations of females:
- Percentage of females in management occupations (except farmers):
Here: 7.5% place: 14.7%
- Percentage of females in business and financial operations occupations:
Here: 9.4% place: 5.1%
- Percentage of females in computer and mathematical occupations:
Here: 4.3% place: 2.3%
- Percentage of females in life, physical, and social science occupations:
Here: 2.7% place: 1.3%
- Percentage of females in community and social services occupations:
Here: 4.8% place: 3.3%
- Percentage of females in legal occupations:
Here: 4.7% place: 0.7%
- Percentage of females in education, training, and library occupations:
Here: 10.0% place: 13.5%
- Percentage of females in arts, design, entertainment, sports, and media occupations:
Here: 1.9% place: 3.0%
- Percentage of females in healthcare practitioners and technical occupations:
Here: 14.8% place: 8.6%
- Percentage of females in service occupations:
Here: 19.4% place: 15.4%
- Percentage of females in sales and office occupations:
Here: 16.7% place: 21.7%
- Percentage of females in production occupations:
Here: 1.2% place: 5.6%
- Percentage of females in transportation occupations:
Here: 1.4% place: 0.8%
Percentage of people 16-64 in Armed Forces:
| Downtown: | 0.3% |
| Hudson: | 0.0% |
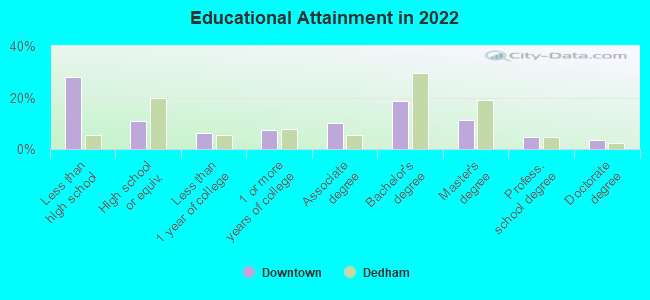
Education in this neighborhood (subdivision or community):
- Percentage of people 3 years and older in K-12 schools:
Downtown: 35.2% Hudson: 14.6%
- Percentage of people 3 years and older in undergraduate colleges:
Downtown: 5.9% Hudson: 3.3%
- Percentage of people 3 years and older in grad. or professional schools:
Downtown: 4.0% Hudson: 1.8%
- Percentage of students K-12 enrolled in private schools:
Downtown: 32.3% Hudson: 7.5%
Percentage of population below poverty level:
| Downtown: | 7.5% |
| Hudson: | 6.8% |
Median year owner moved in (as recorded in 2022):
| Downtown: | 3027 |
| Hudson: | 2007 |
Percentage of married-couple families with both working:
| Downtown: | 115.6% |
| Hudson: | 68.1% |
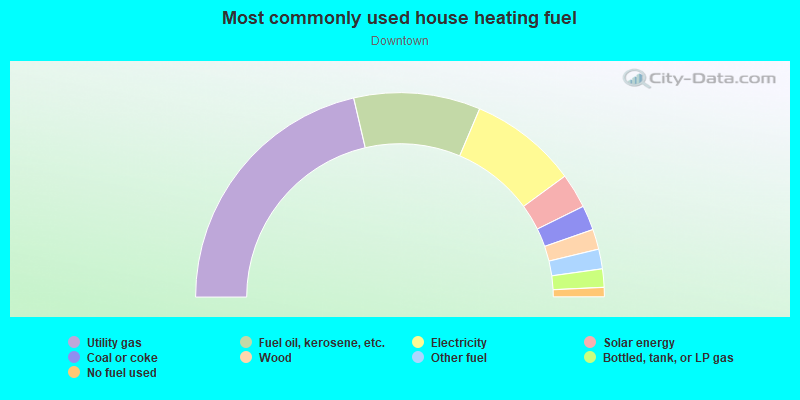
- 42.7%Utility gas
- 20.0%Fuel oil, kerosene, etc.
- 17.1%Electricity
- 5.5%Solar energy
- 3.9%Coal or coke
- 3.2%Wood
- 3.1%Other fuel
- 2.9%Bottled, tank, or LP gas
- 1.5%No fuel used
Highways in this neighborhood:
Main St (State Hwy 62)
Length: 0.63 miles
Directions: E-W, SE-NW
Address range: 1 to 266
Directions: E-W, SE-NW
Address range: 1 to 266
Central St (State Hwy 62)
Length: 0.19 miles
Directions: E-W, SE-NW
Address range: 1 to 37
Directions: E-W, SE-NW
Address range: 1 to 37
Washington St (State Hwy 85)
Length: 0.11 miles
Directions: N-S, SE-NW, SW-NE
Address range: 1 to 29
Directions: N-S, SE-NW, SW-NE
Address range: 1 to 29
Lincoln St (State Hwy 85)
Length: 0.09 miles
Direction: SE-NW
Address range: 1 to 12
Direction: SE-NW
Address range: 1 to 12
Roads and streets:
South St
Length: 0.37 miles
Direction: E-W
Address range: 1 to 35
Direction: E-W
Address range: 1 to 35
Church St
Length: 0.26 miles
Direction: N-S
Address range: 1 to 99
Direction: N-S
Address range: 1 to 99
Broad St
Length: 0.24 miles
Direction: N-S
Address range: 1 to 56
Direction: N-S
Address range: 1 to 56
Grove St
Length: 0.23 miles
Directions: N-S, SE-NW
Address range: 2 to 99
Directions: N-S, SE-NW
Address range: 2 to 99
Water St
Length: 0.20 miles
Direction: E-W
Address range: 1 to 45
Direction: E-W
Address range: 1 to 45
Summer St
Length: 0.19 miles
Direction: E-W
Address range: 1 to 99
Direction: E-W
Address range: 1 to 99
Winter St
Length: 0.18 miles
Direction: E-W
Address range: 1 to 34
Direction: E-W
Address range: 1 to 34
Loring St
Length: 0.18 miles
Direction: E-W
Address range: 1 to 99
Direction: E-W
Address range: 1 to 99
Houghton Ct
Length: 0.17 miles
Directions: E-W, N-S, SW-NE
Address range: 1 to 99
Directions: E-W, N-S, SW-NE
Address range: 1 to 99
Pope St
Length: 0.17 miles
Direction: N-S
Address range: 1 to 37
Direction: N-S
Address range: 1 to 37
Houghton St
Length: 0.15 miles
Direction: N-S
Address range: 2 to 44
Direction: N-S
Address range: 2 to 44
High St
Length: 0.14 miles
Direction: N-S
Address range: 1 to 38
Direction: N-S
Address range: 1 to 38
Manning St
Length: 0.14 miles
Direction: N-S
Address range: 1 to 33
Direction: N-S
Address range: 1 to 33
Loring Ct
Length: 0.11 miles
Directions: E-W, N-S
Address range: 1 to 21
Directions: E-W, N-S
Address range: 1 to 21
Munson St
Length: 0.10 miles
Direction: N-S
Address range: 1 to 99
Direction: N-S
Address range: 1 to 99
Cross St
Length: 0.09 miles
Direction: E-W
Address range: 1 to 99
Direction: E-W
Address range: 1 to 99
Spring St
Length: 0.08 miles
Direction: N-S
Address range: 1 to 99
Direction: N-S
Address range: 1 to 99
Day Cir
Length: 0.06 miles
Directions: E-W, SE-NW
Directions: E-W, SE-NW
Forest Ave
Length: 0.05 miles
Direction: E-W
Address range: 1 to 15
Direction: E-W
Address range: 1 to 15
Market St
Length: 0.05 miles
Direction: N-S
Address range: 1 to 99
Direction: N-S
Address range: 1 to 99
Other features:
Danforth Brk
Length: 0.20 miles
Directions: N-S, SW-NE
Directions: N-S, SW-NE