Downtown Johnson City neighborhood in Johnson City, New York (NY), 13790 detailed profile
Settings
X


Business Search - 14 Million verified businesses
Area: 0.150 square miles
Population: 409
Population density:
| Downtown Johnson City: | 2,721 people per square mile |
| Johnson City: | 3,428 people per square mile |

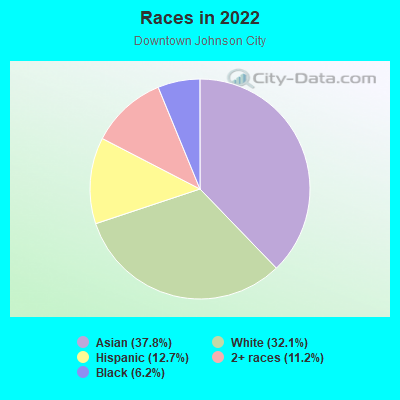
- 17237.8%Asian
- 14632.1%White
- 5812.7%Hispanic or Latino
- 5111.2%Two or more races
- 286.2%Black
Distribution of median household income
![Distribution of median household income]()
- 40Less than $10,000
- 27$10,000 to $19,999
- 81$20,000 to $29,999
- 157$30,000 to $39,999
- 36$40,000 to $49,999
- 16$50,000 to $59,999
- 123$60,000 to $74,999
- 15$75,000 to $99,999
- 49$100,000 to $124,999
- 13$125,000 to $149,999
- 14$150,000 to $199,999
- 11$200,000 or more

Distribution of owner-occupied house/condo value
![Distribution of owner-occupied house/condo value]()
- 6Less than $50,000
- 183$50,000 to $99,999
- 28$100,000 to $149,999
- 12$150,000 to $199,999
- 8$200,000 to $249,999
- 3$250,000 to $299,999
- 2$500,000 to $749,999
- 11$750,000 to $999,999

Distribution of rent paid by renters
![Distribution of rent paid by renters]()
- 13$200 to $299
- 102$300 to $399
- 79$400 to $499
- 45$500 to $599
- 440$600 to $699
- 187$700 to $799
- 99$800 to $899
- 27$900 to $999
- 24$1,000 to $1,249
- 85$1,250 to $1,499
- 52$1,500 to $1,999

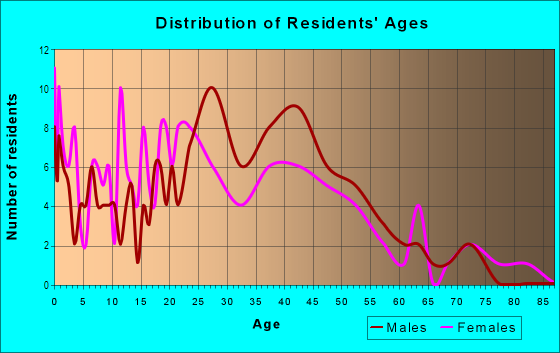
| Males: | 218 |
| Females: | 190 |
Males:
| This neighborhood: | 32.8 years |
| Whole city: | 36.0 years |
| This neighborhood: | 27.9 years |
| Whole city: | 41.2 years |
Average household size:
| Downtown Johnson City: | 8.7 people |
| Johnson City: | 2.2 people |
Percentage of family households:
| Downtown Johnson City: | 29.3% |
| Johnson City: | 31.6% |
| Here: | 52.3% |
| Johnson City: | 31.6% |
Percentage of married-couple families with children (among all households):
| Downtown Johnson City: | 80.5% |
| Johnson City: | 20.1% |
Percentage of single-mother households (among all households):
| Downtown Johnson City: | 18.4% |
| Johnson City: | 18.9% |
Percentage of never married males 15 years old and over:
Percentage of never married females 15 years old and over:
| Downtown Johnson City: | 43.6% |
| Johnson City: | 23.9% |
Percentage of never married females 15 years old and over:
| Downtown Johnson City: | 18.6% |
| village: | 20.9% |
Percentage of people that speak English not well or not at all:
| Downtown Johnson City: | 17.1% |
| Johnson City: | 3.3% |
Percentage of people born in this state:
Percentage of people born in another U.S. state:
Percentage of native residents but born outside the U.S.:
Percentage of foreign born residents:
| Here: | 68.7% |
| Johnson City: | 72.7% |
Percentage of people born in another U.S. state:
| Downtown Johnson City: | 13.6% |
| Johnson City: | 15.9% |
Percentage of native residents but born outside the U.S.:
| Here: | 1.4% |
| village: | 0.9% |
Percentage of foreign born residents:
| Here: | 16.3% |
| Johnson City: | 10.5% |
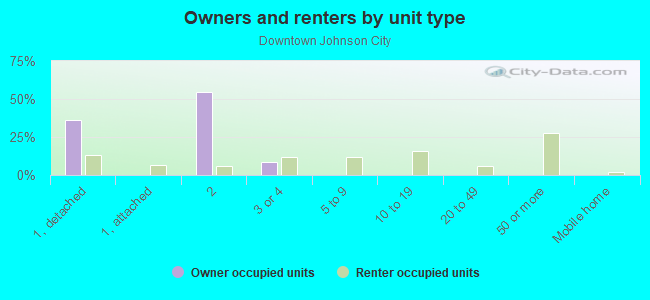
Owner-occupied
Renter-occupied

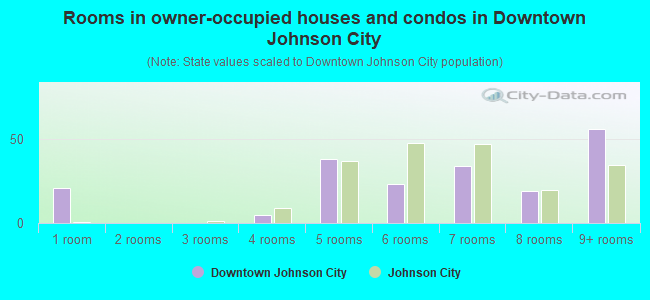
- Rooms in owner-occupied houses and condos in Downtown Johnson City
- 211 room
- 02 rooms
- 03 rooms
- 54 rooms
- 385 rooms
- 236 rooms
- 347 rooms
- 198 rooms
- 569+ rooms
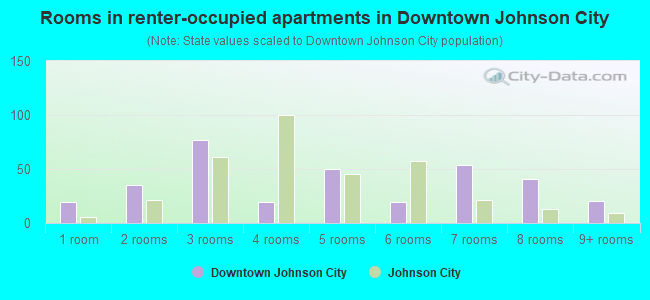
- Rooms in renter-occupied apartments in Downtown Johnson City
- 191 room
- 352 rooms
- 773 rooms
- 194 rooms
- 505 rooms
- 196 rooms
- 547 rooms
- 418 rooms
- 209+ rooms
Owner-occupied
Renter-occupied
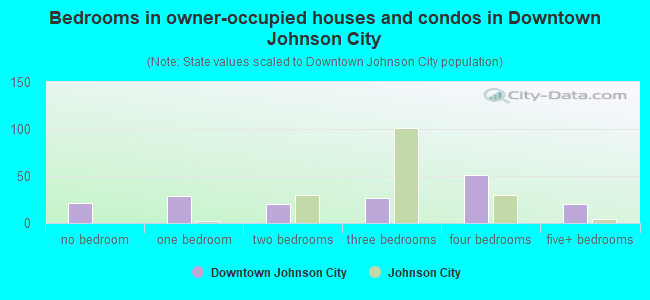
- Bedrooms in owner-occupied houses and condos in Downtown Johnson City
- 21no bedroom
- 291 bedroom
- 202 bedrooms
- 273 bedrooms
- 514 bedrooms
- 205+ bedrooms
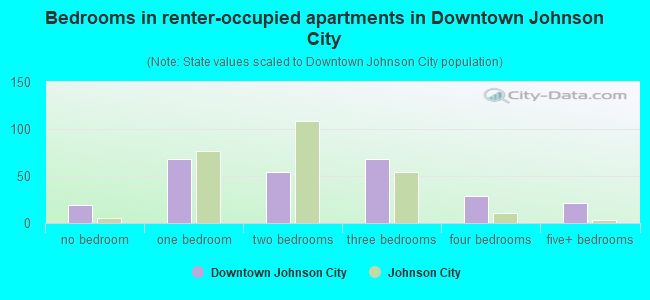
- Bedrooms in renter-occupied apartments in Downtown Johnson City
- 19no bedroom
- 681 bedroom
- 542 bedrooms
- 683 bedrooms
- 294 bedrooms
- 215+ bedrooms
Average number of cars or other vehicles available in houses/condos:
Average number of cars or other vehicles available in apartments:
| This neighborhood: | |
| Johnson City: |
Average number of cars or other vehicles available in apartments:
| Here: | 0.8 |
| village: | 1.0 |
Percentage of units with a mortgage:
| Downtown Johnson City: | 27.0% |
| Johnson City: | 51.4% |
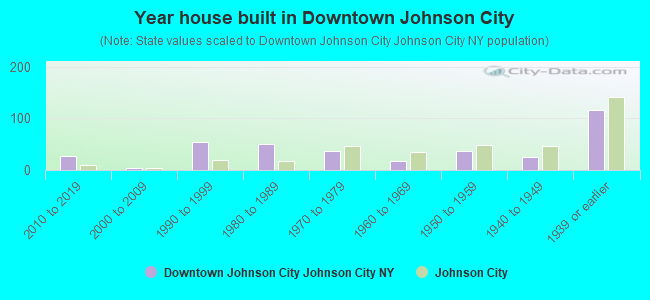
- Year house built in Downtown Johnson City
- 02020 or later
- 282010 to 2019
- 32000 to 2009
- 541990 to 1999
- 511980 to 1989
- 361970 to 1979
- 181960 to 1969
- 361950 to 1959
- 261940 to 1949
- 1161939 or earlier
City-data.com crime index for village in 2020 (higher means more crime):
| City: | 417.9 |
| U.S. average: | 219.5 |
Travel time to work (commute)
![Travel time to work (commute)]()
- 16Less than 5 minutes
- 405 to 9 minutes
- 6110 to 14 minutes
- 3515 to 19 minutes
- 3420 to 24 minutes
- 625 to 29 minutes
- 2930 to 34 minutes
- 735 to 39 minutes
- 640 to 44 minutes
- 22645 to 59 minutes
- 860 to 89 minutes
- 290 or more minutes

Means of transportation to work
![Means of transportation to work]()
- 80.7%97Drove a car alone
- 23.3%28Carpooled
- 105.7%127Bus
- 171.5%206Taxi
- 28.3%34Bicycle
- 20.8%25Walked
- 43.3%52Other means
- 5.8%7Worked at home

Time leaving home to go to work
![Time leaving home to go to work]()
- 1912:00 a.m. to 4:59 a.m.
- 55:00 a.m. to 5:29 a.m.
- 225:30 a.m. to 5:59 a.m.
- 66:00 a.m. to 6:29 a.m.
- 196:30 a.m. to 6:59 a.m.
- 287:00 a.m. to 7:29 a.m.
- 377:30 a.m. to 7:59 a.m.
- 108:00 a.m. to 8:29 a.m.
- 178:30 a.m. to 8:59 a.m.
- 39:00 a.m. to 9:59 a.m.
- 610:00 a.m. to 10:59 a.m.
- 2711:00 a.m. to 11:59 a.m.
- 1012:00 p.m. to 3:59 p.m.
- 214:00 p.m. to 11:59 p.m.

Occupations of males:
- Percentage of males in management occupations (except farmers):
Here: 11.3% village: 11.6%
- Percentage of males in life, physical, and social science occupations:
Here: 1.5% village: 0.9%
- Percentage of males in education, training, and library occupations:
Here: 3.0% village: 5.2%
- Percentage of males in healthcare practitioners and technical occupations:
Here: 3.3% village: 4.3%
- Percentage of males in service occupations:
Here: 7.5% village: 21.1%
- Percentage of males in sales and office occupations:
Here: 2.8% village: 14.7%
- Percentage of males in construction, extraction, and maintenance occupations:
Here: 13.5% village: 7.3%
- Percentage of males in production occupations:
Here: 1.3% village: 5.3%
- Percentage of males in transportation occupations:
Here: 51.3% village: 6.9%
- Percentage of males in material moving occupations:
Here: 2.9% village: 5.0%
Occupations of females:
- Percentage of females in computer and mathematical occupations:
Here: 1.1% village: 1.0%
- Percentage of females in community and social services occupations:
Here: 1.2% village: 3.5%
- Percentage of females in education, training, and library occupations:
Here: 21.1% village: 10.2%
- Percentage of females in healthcare practitioners and technical occupations:
Here: 2.3% village: 9.5%
- Percentage of females in service occupations:
Here: 25.1% village: 27.7%
- Percentage of females in sales and office occupations:
Here: 11.6% village: 25.9%
- Percentage of females in production occupations:
Here: 33.3% village: 3.3%
- Percentage of females in material moving occupations:
Here: 3.1% village: 0.4%
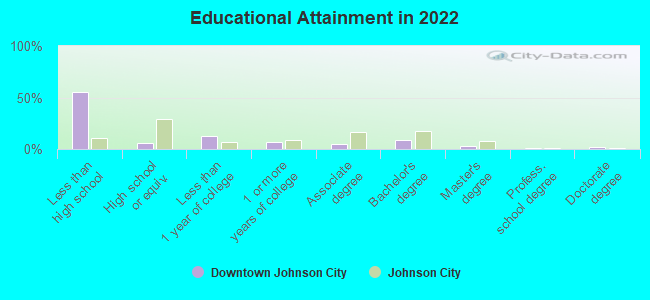
Education in this neighborhood (subdivision or community):
- Percentage of people 3 years and older in K-12 schools:
Downtown Johnson City: 73.4% Johnson City: 12.9%
- Percentage of people 3 years and older in undergraduate colleges:
Downtown Johnson City: 26.3% Johnson City: 6.4%
- Percentage of people 3 years and older in grad. or professional schools:
Downtown Johnson City: 19.0% Johnson City: 3.0%
- Percentage of students K-12 enrolled in private schools:
Downtown Johnson City: 15.9% Johnson City: 2.6%
Percentage of population below poverty level:
| Downtown Johnson City: | 42.2% |
| Johnson City: | 20.3% |
Percentage of married-couple families with both working:
| Downtown Johnson City: | 205.9% |
| Johnson City: | 71.2% |
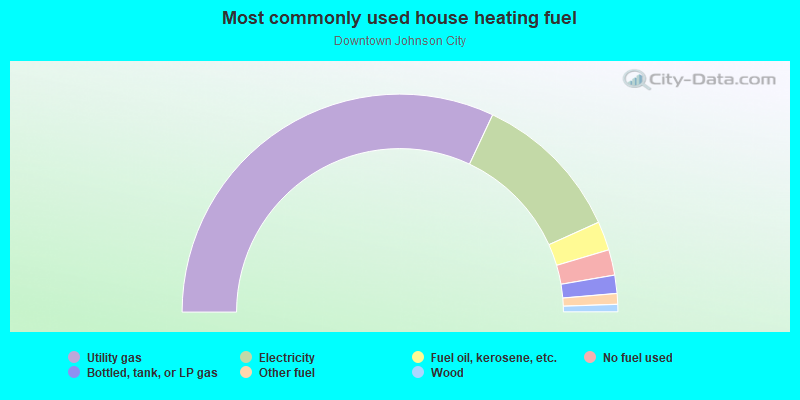
- 64.0%Utility gas
- 22.5%Electricity
- 4.3%Fuel oil, kerosene, etc.
- 3.8%No fuel used
- 2.7%Bottled, tank, or LP gas
- 1.6%Other fuel
- 1.1%Wood
Highways in this neighborhood:
Main St (State Hwy 17C)
Length: 0.67 miles
Direction: E-W
Address range: 130 to 351
Direction: E-W
Address range: 130 to 351
Roads and streets:
Corliss Ave
Length: 0.39 miles
Direction: E-W
Address range: 1 to 121
Direction: E-W
Address range: 1 to 121
Arch St
Length: 0.34 miles
Directions: N-S, SE-NW
Address range: 1 to 85
Directions: N-S, SE-NW
Address range: 1 to 85
Helen Dr
Length: 0.29 miles
Directions: E-W, SE-NW, SW-NE
Directions: E-W, SE-NW, SW-NE
Baldwin St
Length: 0.29 miles
Direction: N-S
Address range: 1 to 100
Direction: N-S
Address range: 1 to 100
Willow St
Length: 0.22 miles
Direction: N-S
Address range: 1 to 130
Direction: N-S
Address range: 1 to 130
Lester Ave
Length: 0.18 miles
Direction: N-S
Address range: 1 to 59
Direction: N-S
Address range: 1 to 59
Broad St
Length: 0.16 miles
Direction: N-S
Address range: 1 to 70
Direction: N-S
Address range: 1 to 70
Harrison St
Length: 0.16 miles
Direction: N-S
Address range: 1 to 99
Direction: N-S
Address range: 1 to 99
Laurel St
Length: 0.13 miles
Directions: E-W, SE-NW
Address range: 1 to 49
Directions: E-W, SE-NW
Address range: 1 to 49
Lewis St
Length: 0.12 miles
Direction: E-W
Address range: 1 to 59
Direction: E-W
Address range: 1 to 59
Ave C
Length: 0.11 miles
Direction: SW-NE
Address range: 1 to 99
Direction: SW-NE
Address range: 1 to 99
Ave A
Length: 0.11 miles
Direction: SW-NE
Address range: 1 to 39
Direction: SW-NE
Address range: 1 to 39
Ave B
Length: 0.10 miles
Direction: SW-NE
Address range: 1 to 39
Direction: SW-NE
Address range: 1 to 39
Jennison Ave
Length: 0.08 miles
Direction: SW-NE
Address range: 1 to 99
Direction: SW-NE
Address range: 1 to 99
N Broad St
Length: 0.08 miles
Direction: N-S
Address range: 1 to 26
Direction: N-S
Address range: 1 to 26
Ave D
Length: 0.07 miles
Direction: SW-NE
Address range: 1 to 29
Direction: SW-NE
Address range: 1 to 29
Faatz Aly
Length: 0.06 miles
Direction: E-W
Direction: E-W
Zalid Rd (Ozalid Rd)
Length: 0.06 miles
Direction: N-S
Address range: 1 to 21
Direction: N-S
Address range: 1 to 21
Park St
Length: 0.05 miles
Direction: SW-NE
Address range: 1 to 38
Direction: SW-NE
Address range: 1 to 38
Ozalid Rd
Length: 0.05 miles
Directions: N-S, SE-NW
Address range: 20 to 99
Directions: N-S, SE-NW
Address range: 20 to 99
Isabelle Pl
Length: 0.03 miles
Direction: N-S
Address range: 1 to 99
Direction: N-S
Address range: 1 to 99
Railroad features:
Norfolk-Southern RR
Length: 0.48 miles
Direction: E-W
Direction: E-W
Norfolk & Southern RR
Length: 0.47 miles
Direction: E-W
Direction: E-W
Southern Tier
Length: 0.06 miles
Direction: E-W
Direction: E-W