Downtown neighborhood in Lake Forest, Illinois (IL), 60045 detailed profile
Settings
X


Business Search - 14 Million verified businesses
Area: 0.370 square miles
Population: 1,051
Population density:
| Downtown: | 2,840 people per square mile |
| Lake Forest: | 1,152 people per square mile |

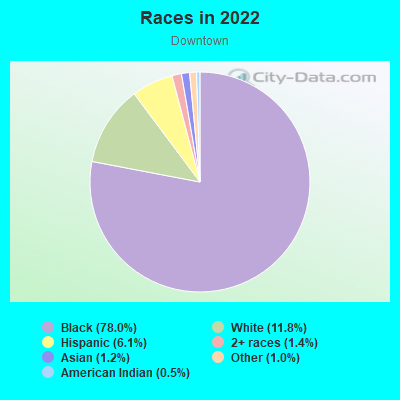
- 86180.6%White
- 878.1%Asian
- 605.6%Two or more races
- 383.6%Hispanic or Latino
- 181.7%Some other race
- 40.4%Black
Median household income in 2022:
| Downtown: | $154,776 |
| Lake Forest: | $202,153 |
Distribution of median household income
![Distribution of median household income]()
- 31Less than $10,000
- 16$10,000 to $19,999
- 37$20,000 to $29,999
- 50$30,000 to $39,999
- 36$40,000 to $49,999
- 19$50,000 to $59,999
- 42$60,000 to $74,999
- 40$75,000 to $99,999
- 72$100,000 to $124,999
- 47$125,000 to $149,999
- 26$150,000 to $199,999
- 175$200,000 or more

Distribution of owner-occupied house/condo value
![Distribution of owner-occupied house/condo value]()
- 13Less than $50,000
- 11$50,000 to $99,999
- 2$100,000 to $149,999
- 38$150,000 to $199,999
- 38$200,000 to $249,999
- 45$250,000 to $299,999
- 57$300,000 to $399,999
- 93$400,000 to $499,999
- 63$500,000 to $749,999
- 40$750,000 to $999,999
- 63$1,000,000 or more

Distribution of rent paid by renters
![Distribution of rent paid by renters]()
- 13$700 to $799
- 8$900 to $999
- 31$1,000 to $1,249
- 9$1,250 to $1,499
- 60$1,500 to $1,999
- 64$2,000 or more

Median rent in 2022:
| Downtown: | $1,983 |
| Lake Forest: | $1,863 |
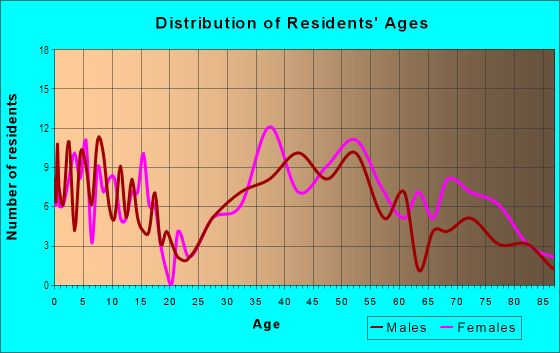
| Males: | 458 |
| Females: | 592 |
Males:
| This neighborhood: | 50.6 years |
| Whole city: | 41.0 years |
| This neighborhood: | 59.7 years |
| Whole city: | 48.3 years |
Average household size:
| Downtown: | 10.7 people |
| Lake Forest: | 2.6 people |
Percentage of family households:
| Downtown: | 29.7% |
| Lake Forest: | 44.0% |
| Here: | 36.7% |
| Lake Forest: | 64.2% |
Percentage of married-couple families with children (among all households):
| Downtown: | 31.1% |
| Lake Forest: | 32.3% |
Percentage of single-mother households (among all households):
| Downtown: | 24.2% |
| Lake Forest: | 2.0% |
Percentage of never married males 15 years old and over:
Percentage of never married females 15 years old and over:
| Downtown: | 16.1% |
| Lake Forest: | 16.4% |
Percentage of never married females 15 years old and over:
| Downtown: | 13.7% |
| city: | 13.7% |
Percentage of people that speak English not well or not at all:
| Downtown: | 2.8% |
| Lake Forest: | 0.7% |
Percentage of people born in this state:
Percentage of people born in another U.S. state:
Percentage of native residents but born outside the U.S.:
Percentage of foreign born residents:
| Here: | 53.6% |
| Lake Forest: | 55.1% |
Percentage of people born in another U.S. state:
| Downtown: | 34.2% |
| Lake Forest: | 32.8% |
Percentage of native residents but born outside the U.S.:
| Here: | 0.9% |
| city: | 1.0% |
Percentage of foreign born residents:
| Here: | 11.3% |
| Lake Forest: | 11.1% |
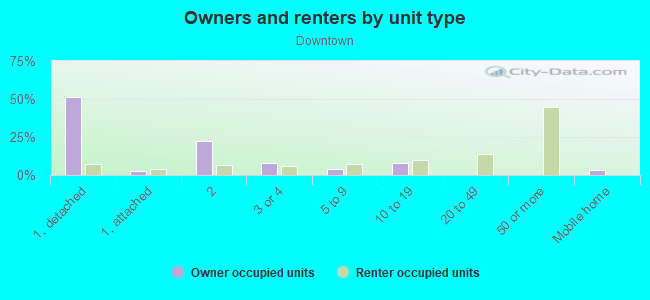
Owner-occupied
Renter-occupied

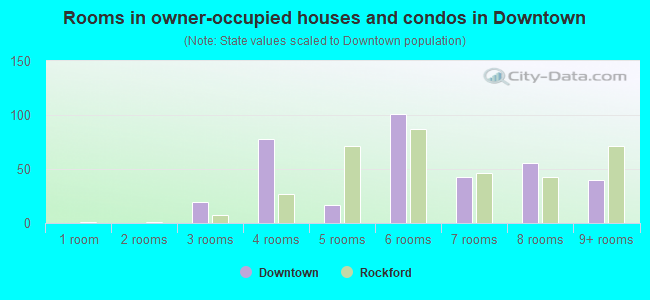
- Rooms in owner-occupied houses and condos in Downtown
- 161 room
- 212 rooms
- 33 rooms
- 584 rooms
- 675 rooms
- 586 rooms
- 717 rooms
- 588 rooms
- 469+ rooms
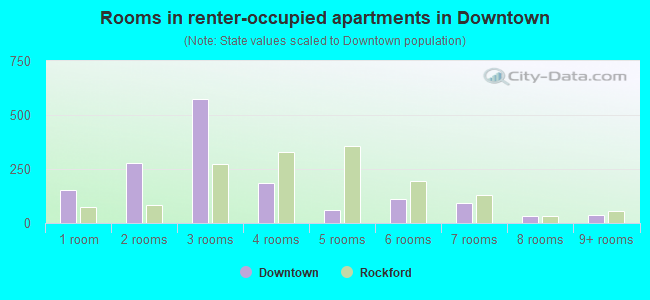
- Rooms in renter-occupied apartments in Downtown
- 131 room
- 902 rooms
- 273 rooms
- 454 rooms
- 1075 rooms
- 376 rooms
- 97 rooms
- 08 rooms
- 139+ rooms
Owner-occupied
Renter-occupied
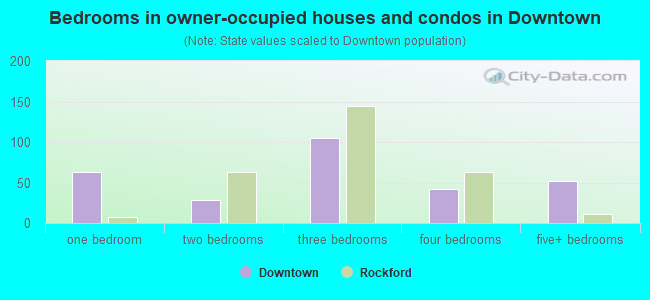
- Bedrooms in owner-occupied houses and condos in Downtown
- 16no bedroom
- 161 bedroom
- 1502 bedrooms
- 1133 bedrooms
- 674 bedrooms
- 125+ bedrooms
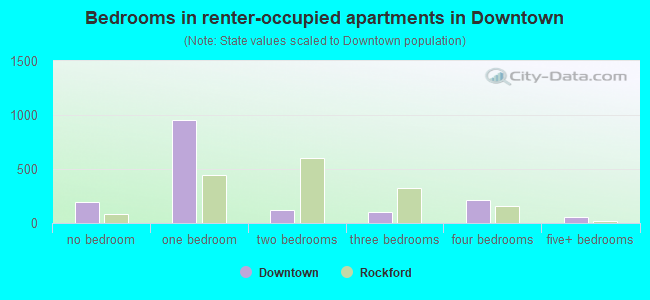
- Bedrooms in renter-occupied apartments in Downtown
- 7no bedroom
- 641 bedroom
- 492 bedrooms
- 353 bedrooms
- 04 bedrooms
- 225+ bedrooms
Average number of cars or other vehicles available in houses/condos:
Average number of cars or other vehicles available in apartments:
| This neighborhood: | 1.5 |
| Lake Forest: | 2.1 |
Average number of cars or other vehicles available in apartments:
| Here: | 1.3 |
| city: | 1.4 |
Percentage of units with a mortgage:
| Downtown: | 44.0% |
| Lake Forest: | 59.2% |
Housing prices:
- Average estimated value of detached houses in 2022 (34.1% of all units):
Downtown: $950,067 Illinois: $310,164
- Average estimated value of townhouses or other attached units in 2022 (5.8% of all units):
This neighborhood: $1,538,902 Illinois: $286,230
- Average estimated '22 value of housing units in 5-or-more-unit structures (7.2% of all units):
Downtown: $263,797 Illinois: $318,887
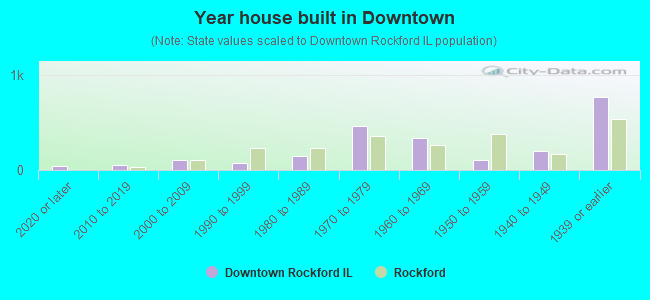
- Year house built in Downtown
- 182020 or later
- 232010 to 2019
- 332000 to 2009
- 511990 to 1999
- 441980 to 1989
- 1851970 to 1979
- 501960 to 1969
- 701950 to 1959
- 561940 to 1949
- 1071939 or earlier
City-data.com crime index for city in 2020 (higher means more crime):
| City: | 93.4 |
| U.S. average: | 219.5 |
Travel time to work (commute)
![Travel time to work (commute)]()
- 20Less than 5 minutes
- 465 to 9 minutes
- 3210 to 14 minutes
- 2615 to 19 minutes
- 4220 to 24 minutes
- 1425 to 29 minutes
- 2830 to 34 minutes
- 435 to 39 minutes
- 1540 to 44 minutes
- 2245 to 59 minutes
- 10660 to 89 minutes
- 2190 or more minutes

Means of transportation to work
![Means of transportation to work]()
- 52.7%284Drove a car alone
- 4.1%22Carpooled
- 4.6%25Bus
- 21.0%113Long-distance train or commuter rail
- 4.5%24Bicycle
- 5.4%29Walked
- 0.6%3Other means
- 16.3%88Worked at home

Time leaving home to go to work
![Time leaving home to go to work]()
- 212:00 a.m. to 4:59 a.m.
- 155:00 a.m. to 5:29 a.m.
- 85:30 a.m. to 5:59 a.m.
- 216:00 a.m. to 6:29 a.m.
- 946:30 a.m. to 6:59 a.m.
- 547:00 a.m. to 7:29 a.m.
- 347:30 a.m. to 7:59 a.m.
- 588:00 a.m. to 8:29 a.m.
- 198:30 a.m. to 8:59 a.m.
- 329:00 a.m. to 9:59 a.m.
- 110:00 a.m. to 10:59 a.m.
- 711:00 a.m. to 11:59 a.m.
- 2812:00 p.m. to 3:59 p.m.
- 184:00 p.m. to 11:59 p.m.

Occupations of males:
- Percentage of males in management occupations (except farmers):
Here: 17.0% city: 27.9%
- Percentage of males in business and financial operations occupations:
Here: 8.1% city: 9.6%
- Percentage of males in computer and mathematical occupations:
Here: 4.0% city: 3.3%
- Percentage of males in architecture and engineering occupations:
Here: 3.8% city: 4.9%
- Percentage of males in life, physical, and social science occupations:
Here: 1.2% city: 1.1%
- Percentage of males in legal occupations:
Here: 13.2% city: 10.4%
- Percentage of males in education, training, and library occupations:
Here: 8.6% city: 3.1%
- Percentage of males in arts, design, entertainment, sports, and media occupations:
Here: 5.9% city: 2.8%
- Percentage of males in healthcare practitioners and technical occupations:
Here: 15.1% city: 5.9%
- Percentage of males in service occupations:
Here: 9.1% city: 6.3%
- Percentage of males in sales and office occupations:
Here: 17.5% city: 17.3%
- Percentage of males in construction, extraction, and maintenance occupations:
Here: 1.1% city: 0.9%
- Percentage of males in production occupations:
Here: 1.4% city: 1.1%
- Percentage of males in material moving occupations:
Here: 1.6% city: 1.8%
Occupations of females:
- Percentage of females in management occupations (except farmers):
Here: 16.8% city: 15.9%
- Percentage of females in business and financial operations occupations:
Here: 8.2% city: 8.1%
- Percentage of females in computer and mathematical occupations:
Here: 1.9% city: 2.2%
- Percentage of females in life, physical, and social science occupations:
Here: 8.0% city: 1.3%
- Percentage of females in legal occupations:
Here: 4.0% city: 10.5%
- Percentage of females in education, training, and library occupations:
Here: 4.4% city: 12.7%
- Percentage of females in arts, design, entertainment, sports, and media occupations:
Here: 1.1% city: 0.8%
- Percentage of females in healthcare practitioners and technical occupations:
Here: 13.1% city: 8.4%
- Percentage of females in service occupations:
Here: 5.0% city: 12.1%
- Percentage of females in sales and office occupations:
Here: 32.2% city: 23.5%
- Percentage of females in production occupations:
Here: 8.2% city: 2.3%
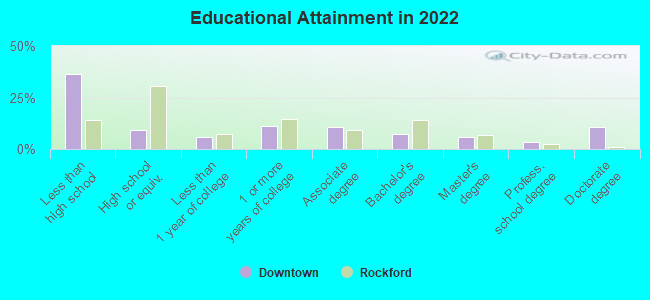
Education in this neighborhood (subdivision or community):
- Percentage of people 3 years and older in K-12 schools:
Downtown: 13.5% Lake Forest: 16.6%
- Percentage of people 3 years and older in undergraduate colleges:
Downtown: 3.8% Lake Forest: 9.5%
- Percentage of people 3 years and older in grad. or professional schools:
Downtown: 5.7% Lake Forest: 2.5%
- Percentage of students K-12 enrolled in private schools:
Downtown: 21.6% Lake Forest: 17.3%
Percentage of population below poverty level:
| Downtown: | 6.4% |
| Lake Forest: | 4.0% |
Median year owner moved in (as recorded in 2022):
Median year renter moved in (as recorded in 2022):
| Downtown: | 2012 |
| Lake Forest: | 2011 |
Median year renter moved in (as recorded in 2022):
| Downtown: | 2016 |
| Lake Forest: | 2018 |
Percentage of married-couple families with both working:
| Downtown: | 118.4% |
| Lake Forest: | 57.4% |
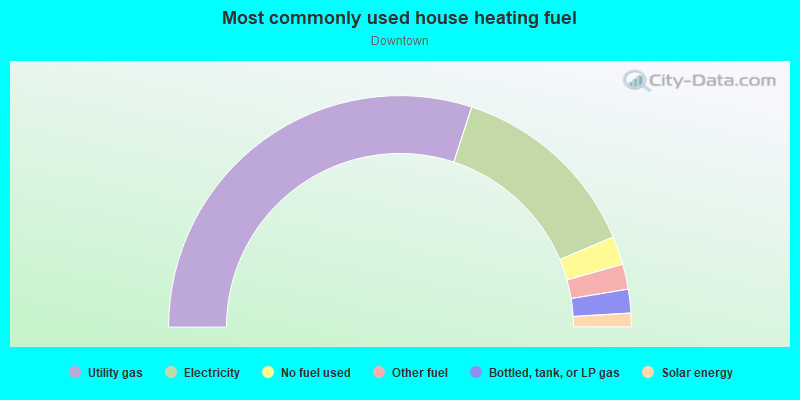
- 65.0%Utility gas
- 32.8%Electricity
- 1.8%Other fuel
Roads and streets:
N Green Bay Rd
Length: 0.89 miles
Directions: N-S, SE-NW
Address range: 400 to 1099
Directions: N-S, SE-NW
Address range: 400 to 1099
N Western Ave
Length: 0.80 miles
Direction: N-S
Address range: 429 to 1099
Direction: N-S
Address range: 429 to 1099
Oakwood Ave
Length: 0.70 miles
Directions: N-S, SE-NW
Address range: 400 to 999
Directions: N-S, SE-NW
Address range: 400 to 999
N McKinley Rd
Length: 0.67 miles
Direction: N-S
Address range: 570 to 1082
Direction: N-S
Address range: 570 to 1082
E Westminster Ave
Length: 0.58 miles
Directions: E-W, SW-NE
Address range: 1 to 403
Directions: E-W, SW-NE
Address range: 1 to 403
E Illinois Rd
Length: 0.50 miles
Directions: E-W, SE-NW
Address range: 140 to 425
Directions: E-W, SE-NW
Address range: 140 to 425
E Deerpath Rd
Length: 0.49 miles
Direction: E-W
Address range: 116 to 409
Direction: E-W
Address range: 116 to 409
E Woodland Rd
Length: 0.47 miles
Directions: E-W, SW-NE
Address range: 1 to 281
Directions: E-W, SW-NE
Address range: 1 to 281
N Bank Ln
Length: 0.45 miles
Directions: N-S, SE-NW, SW-NE
Address range: 450 to 799
Directions: N-S, SE-NW, SW-NE
Address range: 450 to 799
E Laurel Ave
Length: 0.39 miles
Direction: E-W
Address range: 1 to 199
Direction: E-W
Address range: 1 to 199
Atteridge Rd
Length: 0.32 miles
Direction: E-W
Address range: 1 to 199
Direction: E-W
Address range: 1 to 199
E Wisconsin Ave
Length: 0.32 miles
Directions: E-W, N-S, SW-NE
Address range: 180 to 359
Directions: E-W, N-S, SW-NE
Address range: 180 to 359
Vine Ave
Length: 0.30 miles
Direction: E-W
Address range: 100 to 399
Direction: E-W
Address range: 100 to 399
Summit Ave
Length: 0.23 miles
Direction: N-S
Address range: 700 to 999
Direction: N-S
Address range: 700 to 999
Summit Pl
Length: 0.21 miles
Directions: E-W, SE-NW
Address range: 100 to 199
Directions: E-W, SE-NW
Address range: 100 to 199
Market Sq
Length: 0.15 miles
Direction: E-W
Address range: 1 to 99
Direction: E-W
Address range: 1 to 99
Granby Rd
Length: 0.14 miles
Direction: E-W
Address range: 200 to 399
Direction: E-W
Address range: 200 to 399
Forest Ave
Length: 0.14 miles
Direction: N-S
Address range: 600 to 799
Direction: N-S
Address range: 600 to 799
Sunset Pl
Length: 0.12 miles
Direction: E-W
Address range: 1 to 199
Direction: E-W
Address range: 1 to 199
Ridge Ln
Length: 0.08 miles
Direction: E-W
Address range: 100 to 199
Direction: E-W
Address range: 100 to 199
Efner Ave
Length: 0.06 miles
Direction: E-W
Address range: 200 to 299
Direction: E-W
Address range: 200 to 299
Illinois Rd
Length: 0.06 miles
Direction: E-W
Direction: E-W
Northgate St
Length: 0.04 miles
Direction: E-W
Address range: 200 to 299
Direction: E-W
Address range: 200 to 299
Southgate
Length: 0.04 miles
Direction: E-W
Address range: 1 to 99
Direction: E-W
Address range: 1 to 99
Westminster Pl
Length: 0.03 miles
Direction: SE-NW
Address range: 1 to 99
Direction: SE-NW
Address range: 1 to 99
Railroad features:
Chicago and North Western RR
Length: 0.67 miles
Direction: N-S
Direction: N-S