Downtown Laramie (Historic District) neighborhood in Laramie, Wyoming (WY), 82070, 82072 detailed profile
Settings
X

Business Search - 14 Million verified businesses
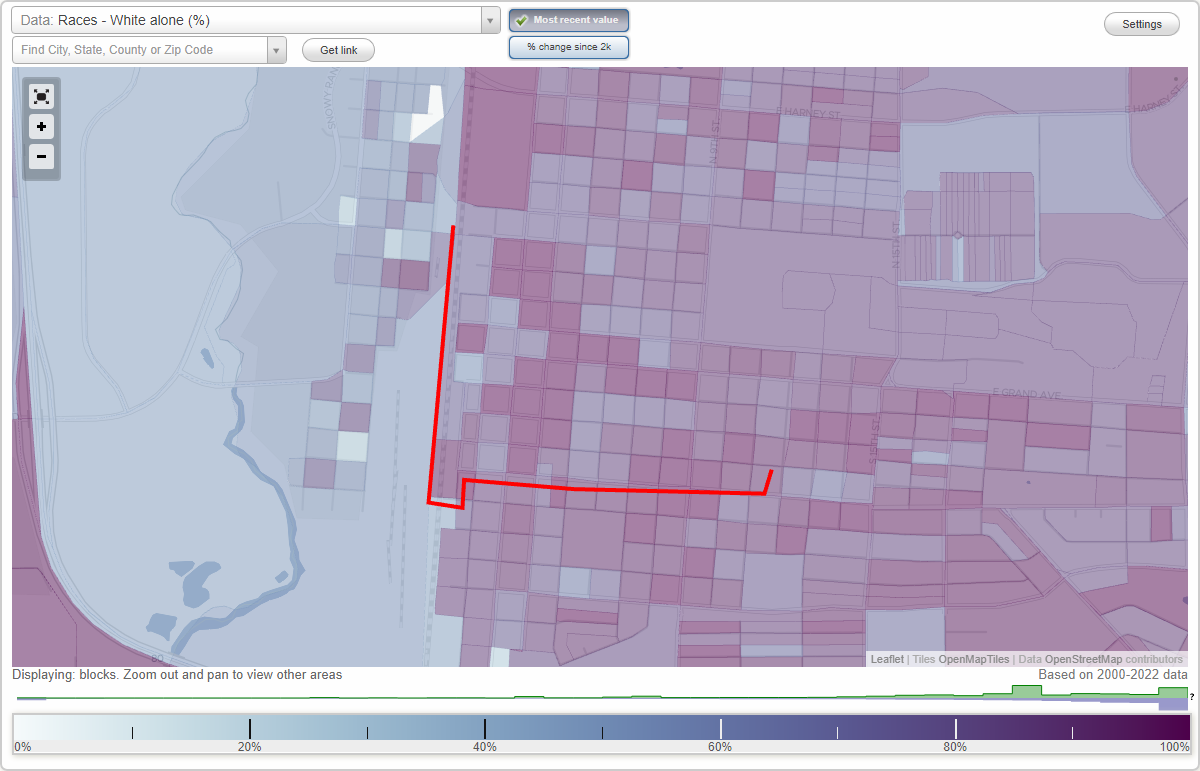
Area: 0.182 square miles
Population: 704
Population density:
| Downtown Laramie (Historic District): | 3,870 people per square mile |
| Laramie: | 2,849 people per square mile |

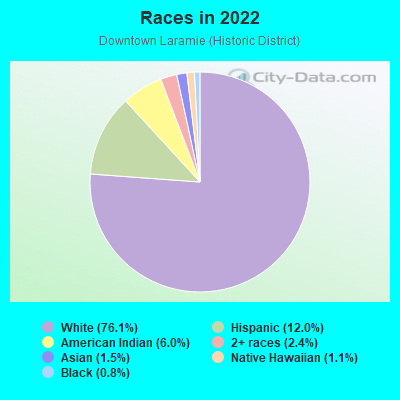
- 54376.1%White
- 8612.0%Hispanic or Latino
- 436.0%American Indian
- 172.4%Two or more races
- 111.5%Asian
- 81.1%Native Hawaiian and Other
Pacific Islander - 60.8%Black
Median household income in 2022:
| Downtown Laramie (Historic District): | $45,427 |
| Laramie: | $50,539 |
Distribution of median household income
![Distribution of median household income]()
- 83Less than $10,000
- 66$10,000 to $19,999
- 34$20,000 to $29,999
- 26$30,000 to $39,999
- 46$40,000 to $49,999
- 15$50,000 to $59,999
- 17$60,000 to $74,999
- 41$75,000 to $99,999
- 28$100,000 to $124,999
- 13$125,000 to $149,999
- 29$150,000 to $199,999
- 35$200,000 or more

Distribution of owner-occupied house/condo value
![Distribution of owner-occupied house/condo value]()
- 10Less than $50,000
- 44$50,000 to $99,999
- 9$100,000 to $149,999
- 13$150,000 to $199,999
- 9$200,000 to $249,999
- 44$250,000 to $299,999
- 33$300,000 to $399,999
- 18$400,000 to $499,999
- 4$500,000 to $749,999
- 1$750,000 to $999,999
- 9$1,000,000 or more

Distribution of rent paid by renters
![Distribution of rent paid by renters]()
- 2$100 to $199
- 1$200 to $299
- 18$300 to $399
- 44$400 to $499
- 46$500 to $599
- 83$600 to $699
- 33$700 to $799
- 45$800 to $899
- 9$900 to $999
- 12$1,000 to $1,249
- 19$1,250 to $1,499
- 4$1,500 to $1,999
- 30$2,000 or more

Median rent in 2022:
| Downtown Laramie (Historic District): | $657 |
| Laramie: | $825 |
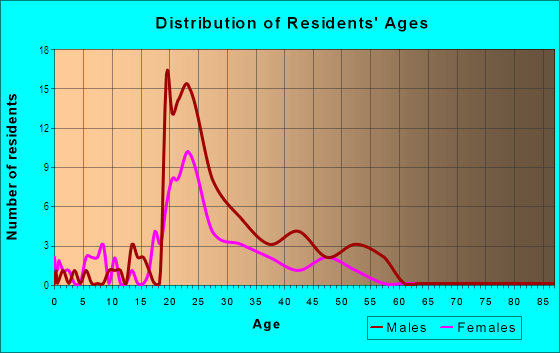
| Males: | 396 |
| Females: | 308 |
Males:
| This neighborhood: | 29.1 years |
| Whole city: | 26.6 years |
| This neighborhood: | 29.1 years |
| Whole city: | 26.6 years |
Average household size:
| Downtown Laramie (Historic District): | 6.5 people |
| Laramie: | 2.1 people |
Percentage of family households:
| Downtown Laramie (Historic District): | 32.6% |
| Laramie: | 37.1% |
| Here: | 29.5% |
| Laramie: | 34.6% |
Percentage of married-couple families with children (among all households):
| Downtown Laramie (Historic District): | 29.7% |
| Laramie: | 31.2% |
Percentage of single-mother households (among all households):
| Downtown Laramie (Historic District): | 13.9% |
| Laramie: | 9.6% |
Percentage of never married males 15 years old and over:
Percentage of never married females 15 years old and over:
| Downtown Laramie (Historic District): | 31.1% |
| Laramie: | 29.5% |
Percentage of never married females 15 years old and over:
| Downtown Laramie (Historic District): | 26.5% |
| city: | 23.4% |
Percentage of people that speak English not well or not at all:
| Downtown Laramie (Historic District): | 0.0% |
| Laramie: | 0.3% |
Percentage of people born in this state:
Percentage of people born in another U.S. state:
Percentage of native residents but born outside the U.S.:
Percentage of foreign born residents:
| Here: | 34.0% |
| Laramie: | 37.7% |
Percentage of people born in another U.S. state:
| Downtown Laramie (Historic District): | 50.2% |
| Laramie: | 53.7% |
Percentage of native residents but born outside the U.S.:
| Here: | 1.1% |
| city: | 0.9% |
Percentage of foreign born residents:
| Here: | 14.7% |
| Laramie: | 7.7% |
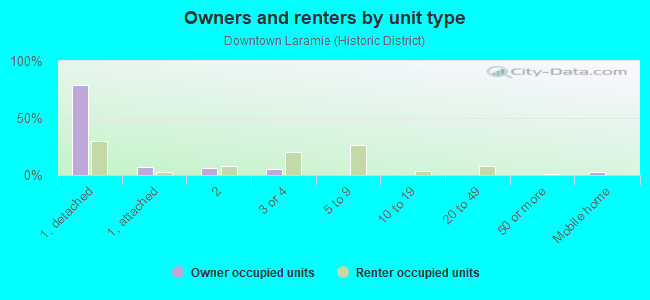
Owner-occupied
Renter-occupied

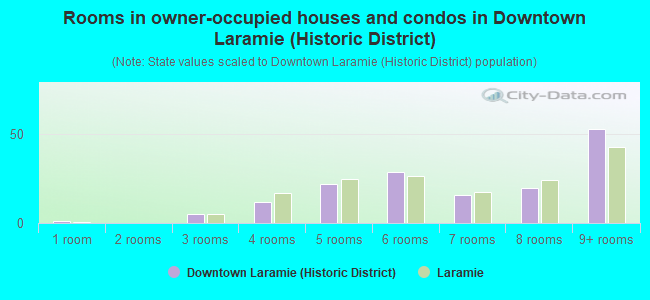
- Rooms in owner-occupied houses and condos in Downtown Laramie <
> - 11 room
- 02 rooms
- 53 rooms
- 124 rooms
- 225 rooms
- 296 rooms
- 167 rooms
- 208 rooms
- 539+ rooms
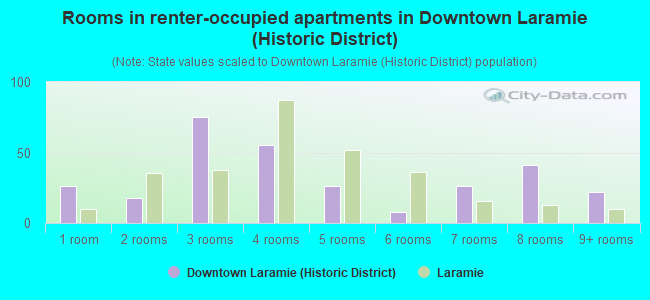
- Rooms in renter-occupied apartments in Downtown Laramie <
> - 261 room
- 182 rooms
- 753 rooms
- 554 rooms
- 265 rooms
- 86 rooms
- 267 rooms
- 418 rooms
- 229+ rooms
Owner-occupied
Renter-occupied
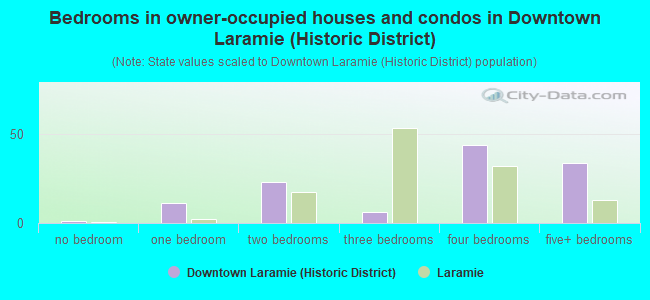
- Bedrooms in owner-occupied houses and condos in Downtown Laramie <
> - 1no bedroom
- 111 bedroom
- 232 bedrooms
- 63 bedrooms
- 444 bedrooms
- 345+ bedrooms
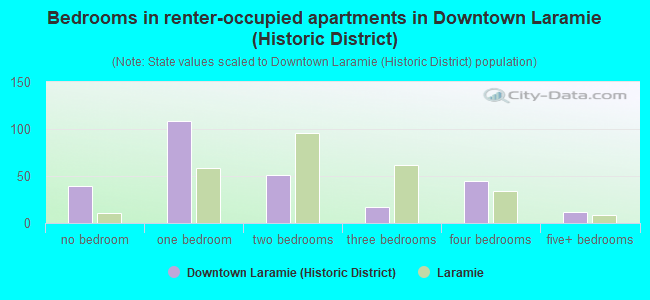
- Bedrooms in renter-occupied apartments in Downtown Laramie <
> - 39no bedroom
- 1081 bedroom
- 512 bedrooms
- 173 bedrooms
- 454 bedrooms
- 125+ bedrooms
Average number of cars or other vehicles available in houses/condos:
Average number of cars or other vehicles available in apartments:
| This neighborhood: | 2.3 |
| Laramie: | 2.2 |
Average number of cars or other vehicles available in apartments:
| Here: | 1.4 |
| city: | 1.7 |
Percentage of units with a mortgage:
| Downtown Laramie (Historic District): | 80.9% |
| Laramie: | 61.1% |
Average estimated value of detached houses in 2022 (46.0% of all units):
| Downtown Laramie (Historic District): | $193,248 |
| Laramie: | $326,856 |
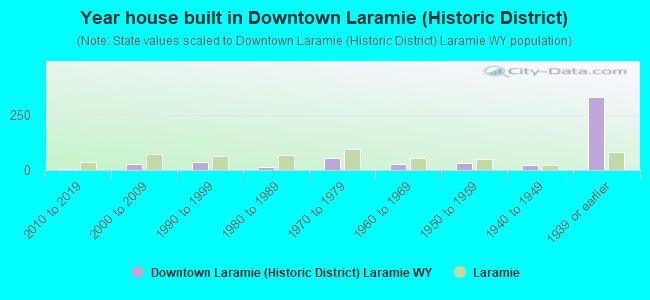
- Year house built in Downtown Laramie <
> - 02020 or later
- 32010 to 2019
- 282000 to 2009
- 371990 to 1999
- 151980 to 1989
- 531970 to 1979
- 281960 to 1969
- 321950 to 1959
- 211940 to 1949
- 3301939 or earlier
City-data.com crime index for city in 2020 (higher means more crime):
| City: | 95.8 |
| U.S. average: | 219.5 |
Travel time to work (commute)
![Travel time to work (commute)]()
- 18Less than 5 minutes
- 2005 to 9 minutes
- 12410 to 14 minutes
- 3515 to 19 minutes
- 1120 to 24 minutes
- 130 to 34 minutes
- 340 to 44 minutes
- 1045 to 59 minutes
- 460 to 89 minutes
- 890 or more minutes

Means of transportation to work
![Means of transportation to work]()
- 52.7%265Drove a car alone
- 8.7%44Carpooled
- 0.4%2Bus
- 4.4%22Motorcycle
- 10.3%52Bicycle
- 22.3%112Walked
- 1.2%6Other means
- 4.4%22Worked at home

Time leaving home to go to work
![Time leaving home to go to work]()
- 912:00 a.m. to 4:59 a.m.
- 35:00 a.m. to 5:29 a.m.
- 155:30 a.m. to 5:59 a.m.
- 96:00 a.m. to 6:29 a.m.
- 116:30 a.m. to 6:59 a.m.
- 497:00 a.m. to 7:29 a.m.
- 737:30 a.m. to 7:59 a.m.
- 848:00 a.m. to 8:29 a.m.
- 208:30 a.m. to 8:59 a.m.
- 459:00 a.m. to 9:59 a.m.
- 810:00 a.m. to 10:59 a.m.
- 2411:00 a.m. to 11:59 a.m.
- 1912:00 p.m. to 3:59 p.m.
- 424:00 p.m. to 11:59 p.m.

Occupations of males:
- Percentage of males in management occupations (except farmers):
Here: 9.5% city: 7.6%
- Percentage of males in business and financial operations occupations:
Here: 3.6% city: 2.5%
- Percentage of males in computer and mathematical occupations:
Here: 8.4% city: 5.6%
- Percentage of males in architecture and engineering occupations:
Here: 2.0% city: 2.2%
- Percentage of males in life, physical, and social science occupations:
Here: 6.0% city: 3.8%
- Percentage of males in community and social services occupations:
Here: 9.8% city: 3.0%
- Percentage of males in legal occupations:
Here: 3.7% city: 1.3%
- Percentage of males in education, training, and library occupations:
Here: 15.7% city: 14.6%
- Percentage of males in arts, design, entertainment, sports, and media occupations:
Here: 2.3% city: 2.6%
- Percentage of males in healthcare practitioners and technical occupations:
Here: 2.4% city: 3.9%
- Percentage of males in service occupations:
Here: 12.3% city: 12.2%
- Percentage of males in sales and office occupations:
Here: 13.5% city: 11.0%
- Percentage of males in construction, extraction, and maintenance occupations:
Here: 8.7% city: 8.8%
Occupations of females:
- Percentage of females in management occupations (except farmers):
Here: 4.5% city: 10.2%
- Percentage of females in business and financial operations occupations:
Here: 2.6% city: 3.7%
- Percentage of females in computer and mathematical occupations:
Here: 4.1% city: 2.3%
- Percentage of females in life, physical, and social science occupations:
Here: 13.3% city: 3.8%
- Percentage of females in legal occupations:
Here: 3.9% city: 1.9%
- Percentage of females in education, training, and library occupations:
Here: 19.9% city: 17.6%
- Percentage of females in arts, design, entertainment, sports, and media occupations:
Here: 3.8% city: 3.2%
- Percentage of females in healthcare practitioners and technical occupations:
Here: 8.6% city: 8.9%
- Percentage of females in service occupations:
Here: 28.1% city: 20.5%
- Percentage of females in sales and office occupations:
Here: 10.5% city: 21.4%
Percentage of people 16-64 in Armed Forces:
| Downtown Laramie (Historic District): | 0.0% |
| Laramie: | 0.2% |
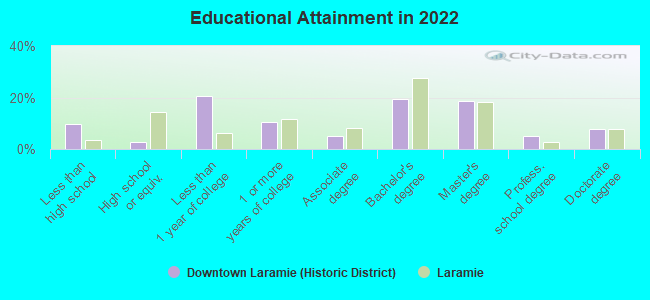
Education in this neighborhood (subdivision or community):
- Percentage of people 3 years and older in K-12 schools:
Downtown Laramie (Historic District): 8.9% Laramie: 10.5%
- Percentage of people 3 years and older in undergraduate colleges:
Downtown Laramie (Historic District): 20.7% Laramie: 27.6%
- Percentage of people 3 years and older in grad. or professional schools:
Downtown Laramie (Historic District): 7.4% Laramie: 6.3%
- Percentage of students K-12 enrolled in private schools:
Downtown Laramie (Historic District): 0.0% Laramie: 0.9%
Percentage of population below poverty level:
| Downtown Laramie (Historic District): | 33.1% |
| Laramie: | 24.8% |
Median year owner moved in (as recorded in 2022):
| Downtown Laramie (Historic District): | 2007 |
| Laramie: | 2013 |
Percentage of married-couple families with both working:
| Downtown Laramie (Historic District): | 151.5% |
| Laramie: | 83.5% |
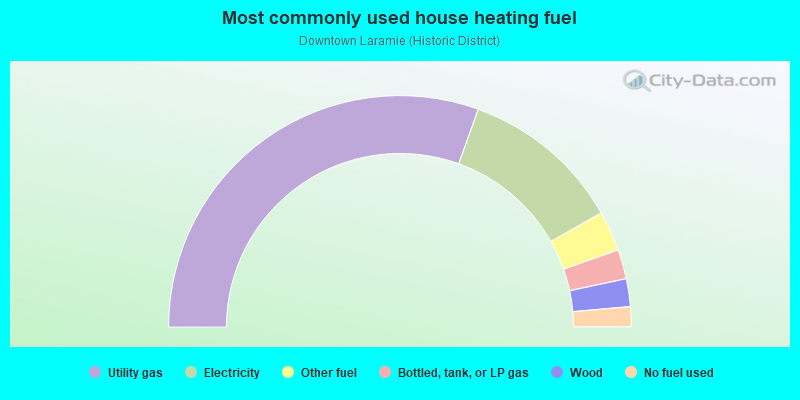
- 61.0%Utility gas
- 22.6%Electricity
- 5.6%Other fuel
- 4.1%Bottled, tank, or LP gas
- 3.9%Wood
- 2.8%No fuel used
Highways in this neighborhood:
US Hwy 287 (S 3rd St, US Hwy 30, Bus I- 80)
Length: 0.45 miles
Directions: E-W, N-S
Address range: 100 to 499
Directions: E-W, N-S
Address range: 100 to 499
S 3rd St (US Hwy 287)
Length: 0.26 miles
Direction: N-S
Address range: 300 to 699
Direction: N-S
Address range: 300 to 699
Clark St (State Hwy 130, State Hwy 230, E Clark St)
Length: 0.21 miles
Direction: E-W
Address range: 100 to 299
Direction: E-W
Address range: 100 to 299
Roads and streets:
S 1st St
Length: 0.45 miles
Direction: N-S
Address range: 100 to 799
Direction: N-S
Address range: 100 to 799
S 2nd St
Length: 0.39 miles
Direction: N-S
Address range: 100 to 699
Direction: N-S
Address range: 100 to 699
S 4th St
Length: 0.39 miles
Direction: N-S
Address range: 100 to 699
Direction: N-S
Address range: 100 to 699
S 5th St
Length: 0.39 miles
Direction: N-S
Address range: 100 to 699
Direction: N-S
Address range: 100 to 699
E Ivinson Ave
Length: 0.36 miles
Direction: E-W
Address range: 100 to 499
Direction: E-W
Address range: 100 to 499
E University Ave
Length: 0.36 miles
Direction: E-W
Address range: 100 to 499
Direction: E-W
Address range: 100 to 499
E Garfield St
Length: 0.36 miles
Direction: E-W
Address range: 100 to 499
Direction: E-W
Address range: 100 to 499
E Kearney St
Length: 0.32 miles
Direction: E-W
Address range: 100 to 499
Direction: E-W
Address range: 100 to 499
E Custer St
Length: 0.32 miles
Direction: E-W
Address range: 100 to 499
Direction: E-W
Address range: 100 to 499
E Sheridan St
Length: 0.32 miles
Direction: E-W
Address range: 100 to 499
Direction: E-W
Address range: 100 to 499
E Fremont St
Length: 0.32 miles
Direction: E-W
Address range: 19 to 499
Direction: E-W
Address range: 19 to 499
E Clark St
Length: 0.18 miles
Direction: E-W
Address range: 300 to 499
Direction: E-W
Address range: 300 to 499
E Grand Ave
Length: 0.18 miles
Direction: E-W
Address range: 100 to 299
Direction: E-W
Address range: 100 to 299
N 4th St
Length: 0.13 miles
Direction: N-S
Address range: 100 to 299
Direction: N-S
Address range: 100 to 299
N 5th St
Length: 0.13 miles
Direction: N-S
Address range: 100 to 299
Direction: N-S
Address range: 100 to 299
N 2nd St
Length: 0.13 miles
Direction: N-S
Address range: 100 to 299
Direction: N-S
Address range: 100 to 299