Downtown (Heritage District) neighborhood in Libertyville, Illinois (IL), 60048 detailed profile
Settings
X


Business Search - 14 Million verified businesses
Area: 0.384 square miles
Population: 728
Population density:
| Downtown (Heritage District): | 1,896 people per square mile |
| Libertyville: | 2,343 people per square mile |

- 63884.8%White
- 506.6%Hispanic or Latino
- 182.4%Two or more races
- 141.9%Asian
- 121.6%Black
- 121.6%Some other race
- 50.7%Native Hawaiian and Other
Pacific Islander - 30.4%American Indian

Median household income in 2022:
| Downtown (Heritage District): | $158,166 |
| Libertyville: | $161,302 |
Distribution of median household income
![Distribution of median household income]()
- 10Less than $10,000
- 13$10,000 to $19,999
- 30$20,000 to $29,999
- 25$30,000 to $39,999
- 16$40,000 to $49,999
- 19$50,000 to $59,999
- 20$60,000 to $74,999
- 29$75,000 to $99,999
- 16$100,000 to $124,999
- 22$125,000 to $149,999
- 46$150,000 to $199,999
- 106$200,000 or more

Distribution of owner-occupied house/condo value
![Distribution of owner-occupied house/condo value]()
- 2Less than $50,000
- 4$50,000 to $99,999
- 9$100,000 to $149,999
- 5$150,000 to $199,999
- 13$200,000 to $249,999
- 6$250,000 to $299,999
- 43$300,000 to $399,999
- 45$400,000 to $499,999
- 68$500,000 to $749,999
- 21$750,000 to $999,999
- 29$1,000,000 or more

Distribution of rent paid by renters
![Distribution of rent paid by renters]()
- 13$100 to $199
- 8$200 to $299
- 3$400 to $499
- 2$700 to $799
- 9$800 to $899
- 3$900 to $999
- 37$1,000 to $1,249
- 22$1,250 to $1,499
- 60$1,500 to $1,999
- 18$2,000 or more

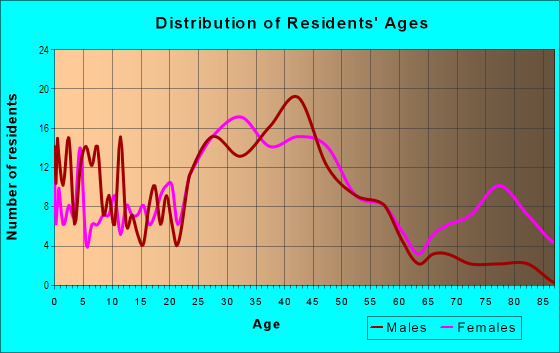
| Males: | 376 |
| Females: | 352 |
Males:
| This neighborhood: | 42.8 years |
| Whole city: | 42.1 years |
| This neighborhood: | 46.9 years |
| Whole city: | 42.7 years |
Average household size:
| Downtown (Heritage District): | 2.5 people |
| Libertyville: | 2.6 people |
Percentage of family households:
| Downtown (Heritage District): | 57.8% |
| Libertyville: | 54.8% |
| Here: | 63.9% |
| Libertyville: | 65.0% |
Percentage of married-couple families with children (among all households):
| Downtown (Heritage District): | 33.1% |
| Libertyville: | 32.5% |
Percentage of single-mother households (among all households):
| Downtown (Heritage District): | 5.9% |
| Libertyville: | 3.6% |
Percentage of never married males 15 years old and over:
Percentage of never married females 15 years old and over:
| Downtown (Heritage District): | 16.8% |
| Libertyville: | 12.6% |
Percentage of never married females 15 years old and over:
| Downtown (Heritage District): | 11.7% |
| village: | 12.0% |
Percentage of people that speak English not well or not at all:
| Downtown (Heritage District): | 1.3% |
| Libertyville: | 1.2% |
Percentage of people born in this state:
Percentage of people born in another U.S. state:
Percentage of native residents but born outside the U.S.:
Percentage of foreign born residents:
| Here: | 58.8% |
| Libertyville: | 56.3% |
Percentage of people born in another U.S. state:
| Downtown (Heritage District): | 29.9% |
| Libertyville: | 32.7% |
Percentage of native residents but born outside the U.S.:
| Here: | 1.0% |
| village: | 0.9% |
Percentage of foreign born residents:
| Here: | 10.3% |
| Libertyville: | 10.0% |

Owner-occupied
Renter-occupied


- Rooms in owner-occupied houses and condos in Downtown <
> - 11 room
- 22 rooms
- 113 rooms
- 64 rooms
- 175 rooms
- 276 rooms
- 247 rooms
- 398 rooms
- 869+ rooms

- Rooms in renter-occupied apartments in Downtown <
> - 161 room
- 162 rooms
- 133 rooms
- 324 rooms
- 125 rooms
- 146 rooms
- 07 rooms
- 108 rooms
- 69+ rooms
Owner-occupied
Renter-occupied

- Bedrooms in owner-occupied houses and condos in Downtown <
> - 1no bedroom
- 21 bedroom
- 292 bedrooms
- 733 bedrooms
- 884 bedrooms
- 225+ bedrooms

- Bedrooms in renter-occupied apartments in Downtown <
> - 16no bedroom
- 311 bedroom
- 542 bedrooms
- 93 bedrooms
- 44 bedrooms
- 35+ bedrooms
Average number of cars or other vehicles available in houses/condos:
Average number of cars or other vehicles available in apartments:
| This neighborhood: | 2.6 |
| Libertyville: | 2.1 |
Average number of cars or other vehicles available in apartments:
| Here: | 1.9 |
| village: | 1.2 |
Percentage of units with a mortgage:
| Downtown (Heritage District): | 67.3% |
| Libertyville: | 69.1% |
Average estimated value of detached houses in 2022 (68.4% of all units):
| Downtown (Heritage District): | $626,534 |
| Illinois: | $310,164 |

- Year house built in Downtown <
> - 52020 or later
- 82010 to 2019
- 382000 to 2009
- 101990 to 1999
- 201980 to 1989
- 561970 to 1979
- 241960 to 1969
- 391950 to 1959
- 361940 to 1949
- 741939 or earlier

City-data.com crime index for village in 2020 (higher means more crime):
| City: | 51.0 |
| U.S. average: | 219.5 |
Travel time to work (commute)
![Travel time to work (commute)]()
- 12Less than 5 minutes
- 325 to 9 minutes
- 5310 to 14 minutes
- 4715 to 19 minutes
- 5220 to 24 minutes
- 2225 to 29 minutes
- 3930 to 34 minutes
- 635 to 39 minutes
- 440 to 44 minutes
- 2545 to 59 minutes
- 1860 to 89 minutes
- 790 or more minutes

Means of transportation to work
![Means of transportation to work]()
- 63.2%257Drove a car alone
- 5.7%23Carpooled
- 1.0%4Bus
- 4.2%17Long-distance train or commuter rail
- 1.2%5Bicycle
- 2.0%8Walked
- 1.7%7Other means
- 24.1%98Worked at home

Time leaving home to go to work
![Time leaving home to go to work]()
- 612:00 a.m. to 4:59 a.m.
- 15:00 a.m. to 5:29 a.m.
- 195:30 a.m. to 5:59 a.m.
- 316:00 a.m. to 6:29 a.m.
- 216:30 a.m. to 6:59 a.m.
- 377:00 a.m. to 7:29 a.m.
- 347:30 a.m. to 7:59 a.m.
- 438:00 a.m. to 8:29 a.m.
- 268:30 a.m. to 8:59 a.m.
- 419:00 a.m. to 9:59 a.m.
- 1510:00 a.m. to 10:59 a.m.
- 611:00 a.m. to 11:59 a.m.
- 1212:00 p.m. to 3:59 p.m.
- 214:00 p.m. to 11:59 p.m.

Occupations of males:
- Percentage of males in management occupations (except farmers):
Here: 23.6% village: 29.3%
- Percentage of males in business and financial operations occupations:
Here: 14.1% village: 10.9%
- Percentage of males in computer and mathematical occupations:
Here: 3.3% village: 6.0%
- Percentage of males in architecture and engineering occupations:
Here: 12.0% village: 7.7%
- Percentage of males in life, physical, and social science occupations:
Here: 1.6% village: 2.6%
- Percentage of males in community and social services occupations:
Here: 1.1% village: 0.8%
- Percentage of males in legal occupations:
Here: 1.1% village: 2.2%
- Percentage of males in education, training, and library occupations:
Here: 3.6% village: 3.4%
- Percentage of males in arts, design, entertainment, sports, and media occupations:
Here: 3.9% village: 1.4%
- Percentage of males in healthcare practitioners and technical occupations:
Here: 6.3% village: 3.4%
- Percentage of males in service occupations:
Here: 9.7% village: 6.2%
- Percentage of males in sales and office occupations:
Here: 10.5% village: 17.1%
- Percentage of males in construction, extraction, and maintenance occupations:
Here: 2.0% village: 1.6%
- Percentage of males in material moving occupations:
Here: 3.0% village: 2.6%
Occupations of females:
- Percentage of females in management occupations (except farmers):
Here: 23.8% village: 21.8%
- Percentage of females in business and financial operations occupations:
Here: 6.7% village: 9.2%
- Percentage of females in architecture and engineering occupations:
Here: 4.3% village: 1.9%
- Percentage of females in life, physical, and social science occupations:
Here: 1.2% village: 2.9%
- Percentage of females in community and social services occupations:
Here: 4.1% village: 1.8%
- Percentage of females in education, training, and library occupations:
Here: 11.2% village: 14.9%
- Percentage of females in healthcare practitioners and technical occupations:
Here: 6.1% village: 8.2%
- Percentage of females in service occupations:
Here: 13.8% village: 10.1%
- Percentage of females in sales and office occupations:
Here: 27.2% village: 19.1%
Percentage of people 16-64 in Armed Forces:
| Downtown (Heritage District): | 0.2% |
| Libertyville: | 0.2% |
Education in this neighborhood (subdivision or community):
- Percentage of people 3 years and older in K-12 schools:
Downtown (Heritage District): 21.4% Libertyville: 21.2%
- Percentage of people 3 years and older in undergraduate colleges:
Downtown (Heritage District): 6.3% Libertyville: 3.3%
- Percentage of people 3 years and older in grad. or professional schools:
Downtown (Heritage District): 2.5% Libertyville: 2.1%
- Percentage of students K-12 enrolled in private schools:
Downtown (Heritage District): 30.5% Libertyville: 11.6%
Percentage of population below poverty level:
| Downtown (Heritage District): | 7.5% |
| Libertyville: | 3.1% |
Median year owner moved in (as recorded in 2022):
| Downtown (Heritage District): | 2008 |
| Libertyville: | 2009 |
Percentage of married-couple families with both working:
| Downtown (Heritage District): | 62.1% |
| Libertyville: | 69.2% |

- 75.6%Utility gas
- 13.2%Electricity
- 4.7%Other fuel
- 3.4%Bottled, tank, or LP gas
- 1.7%No fuel used
- 1.3%Wood
Highways in this neighborhood:
E Park Ave (State Rte 176, Mechanics Grove Rd)
Length: 0.59 miles
Direction: E-W
Address range: 146 to 517
Direction: E-W
Address range: 146 to 517
State Rte 21 (N Milwaukee Ave)
Length: 0.52 miles
Direction: N-S
Address range: 100 to 729
Direction: N-S
Address range: 100 to 729
W Park Ave (State Rte 176, Mechanics Grove Rd)
Length: 0.51 miles
Direction: E-W
Address range: 219 to 498
Direction: E-W
Address range: 219 to 498
Roads and streets:
E Church St
Length: 0.73 miles
Direction: E-W
Address range: 100 to 899
Direction: E-W
Address range: 100 to 899
Broadway
Length: 0.66 miles
Direction: E-W
Address range: 100 to 699
Direction: E-W
Address range: 100 to 699
Hurlburt Ct
Length: 0.62 miles
Direction: E-W
Address range: 100 to 799
Direction: E-W
Address range: 100 to 799
Brainerd Ave
Length: 0.55 miles
Directions: N-S, SW-NE
Address range: 115 to 699
Directions: N-S, SW-NE
Address range: 115 to 699
North Ave
Length: 0.38 miles
Directions: E-W, SE-NW
Address range: 300 to 699
Directions: E-W, SE-NW
Address range: 300 to 699
Newberry Ave
Length: 0.33 miles
Direction: E-W
Address range: 100 to 299
Direction: E-W
Address range: 100 to 299
1st St (N 1st St)
Length: 0.32 miles
Direction: N-S
Address range: 300 to 700
Direction: N-S
Address range: 300 to 700
W Maple Ave
Length: 0.31 miles
Direction: E-W
Address range: 100 to 333
Direction: E-W
Address range: 100 to 333
School St
Length: 0.30 miles
Directions: E-W, N-S
Address range: 100 to 536
Directions: E-W, N-S
Address range: 100 to 536
E Cook Ave
Length: 0.28 miles
Direction: E-W
Address range: 1 to 299
Direction: E-W
Address range: 1 to 299
N 4th St
Length: 0.28 miles
Direction: N-S
Address range: 100 to 399
Direction: N-S
Address range: 100 to 399
N 5th St
Length: 0.28 miles
Direction: N-S
Address range: 101 to 399
Direction: N-S
Address range: 101 to 399
N 2nd St
Length: 0.28 miles
Direction: N-S
Address range: 100 to 398
Direction: N-S
Address range: 100 to 398
N 3rd St
Length: 0.28 miles
Direction: N-S
Address range: 100 to 345
Direction: N-S
Address range: 100 to 345
2nd St
Length: 0.21 miles
Direction: N-S
Address range: 400 to 673
Direction: N-S
Address range: 400 to 673
N 1st St
Length: 0.17 miles
Direction: N-S
Address range: 100 to 233
Direction: N-S
Address range: 100 to 233
Park Pl
Length: 0.17 miles
Direction: N-S
Address range: 100 to 299
Direction: N-S
Address range: 100 to 299
Grant Ct
Length: 0.17 miles
Direction: E-W
Address range: 300 to 399
Direction: E-W
Address range: 300 to 399
E Maple Ave
Length: 0.15 miles
Direction: E-W
Address range: 100 to 199
Direction: E-W
Address range: 100 to 199
W Church St
Length: 0.15 miles
Direction: E-W
Address range: 100 to 199
Direction: E-W
Address range: 100 to 199
W Cook Ave
Length: 0.14 miles
Direction: E-W
Address range: 100 to 199
Direction: E-W
Address range: 100 to 199
Jackson Ave
Length: 0.14 miles
Directions: E-W, SE-NW
Address range: 300 to 399
Directions: E-W, SE-NW
Address range: 300 to 399
Lake St
Length: 0.13 miles
Direction: E-W
Address range: 100 to 199
Direction: E-W
Address range: 100 to 199
N Stewart Ave
Length: 0.13 miles
Directions: N-S, SW-NE
Address range: 100 to 299
Directions: N-S, SW-NE
Address range: 100 to 299
Douglas Ave
Length: 0.12 miles
Direction: N-S
Address range: 120 to 132
Direction: N-S
Address range: 120 to 132
Wright Ct
Length: 0.11 miles
Direction: N-S
Direction: N-S
3rd St
Length: 0.08 miles
Direction: N-S
Address range: 400 to 599
Direction: N-S
Address range: 400 to 599
Railroad features:
Metra (Soo Line RR (Nirc))
Length: 0.50 miles
Direction: E-W
Direction: E-W