Downtown neighborhood in Lombard, Illinois (IL), 60148 detailed profile
Settings
X


Business Search - 14 Million verified businesses
Area: 0.229 square miles
Population: 1,352
Population density:
| Downtown: | 5,896 people per square mile |
| Lombard: | 4,549 people per square mile |

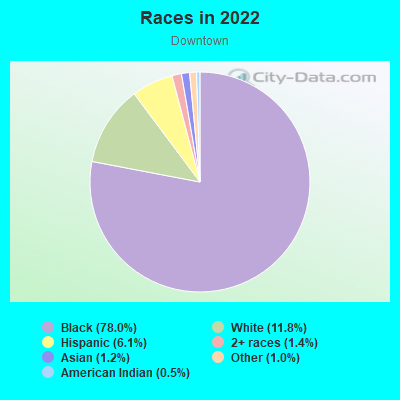
- 1,11575.6%White
- 1329.0%Black
- 1228.3%Hispanic or Latino
- 886.0%Two or more races
- 151.0%Asian
- 20.1%Some other race
Median household income in 2022:
| Downtown: | $100,882 |
| Lombard: | $95,509 |
Distribution of median household income
![Distribution of median household income]()
- 19Less than $10,000
- 24$10,000 to $19,999
- 56$20,000 to $29,999
- 28$30,000 to $39,999
- 60$40,000 to $49,999
- 29$50,000 to $59,999
- 82$60,000 to $74,999
- 84$75,000 to $99,999
- 83$100,000 to $124,999
- 102$125,000 to $149,999
- 23$150,000 to $199,999
- 79$200,000 or more

Distribution of owner-occupied house/condo value
![Distribution of owner-occupied house/condo value]()
- 7Less than $50,000
- 24$50,000 to $99,999
- 36$100,000 to $149,999
- 35$150,000 to $199,999
- 53$200,000 to $249,999
- 53$250,000 to $299,999
- 90$300,000 to $399,999
- 58$400,000 to $499,999
- 101$500,000 to $749,999
- 22$750,000 to $999,999
- 15$1,000,000 or more

Distribution of rent paid by renters
![Distribution of rent paid by renters]()
- 30$600 to $699
- 13$700 to $799
- 5$800 to $899
- 15$900 to $999
- 111$1,000 to $1,249
- 49$1,250 to $1,499
- 37$1,500 to $1,999
- 80$2,000 or more

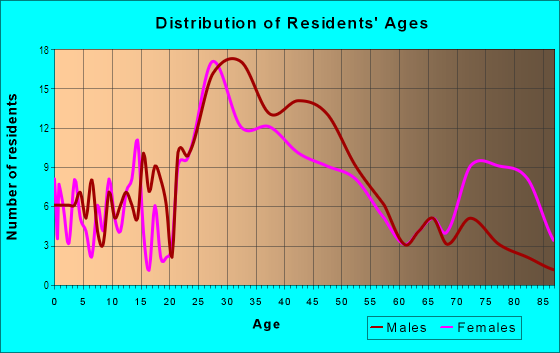
| Males: | 646 |
| Females: | 705 |
Males:
| This neighborhood: | 40.2 years |
| Whole city: | 37.2 years |
| This neighborhood: | 41.3 years |
| Whole city: | 38.3 years |
Average household size:
| Downtown: | 13.3 people |
| Lombard: | 2.5 people |
Percentage of family households:
| Downtown: | 51.8% |
| Lombard: | 49.2% |
| Here: | 49.9% |
| Lombard: | 51.7% |
Percentage of married-couple families with children (among all households):
| Downtown: | 34.3% |
| Lombard: | 31.9% |
Percentage of single-mother households (among all households):
| Downtown: | 6.4% |
| Lombard: | 5.6% |
Percentage of never married males 15 years old and over:
Percentage of never married females 15 years old and over:
| Downtown: | 16.3% |
| Lombard: | 16.6% |
Percentage of never married females 15 years old and over:
| Downtown: | 14.1% |
| village: | 15.3% |
Percentage of people that speak English not well or not at all:
| Downtown: | 0.6% |
| Lombard: | 1.8% |
Percentage of people born in this state:
Percentage of people born in another U.S. state:
Percentage of native residents but born outside the U.S.:
Percentage of foreign born residents:
| Here: | 78.0% |
| Lombard: | 68.9% |
Percentage of people born in another U.S. state:
| Downtown: | 16.7% |
| Lombard: | 14.0% |
Percentage of native residents but born outside the U.S.:
| Here: | 0.4% |
| village: | 0.9% |
Percentage of foreign born residents:
| Here: | 4.8% |
| Lombard: | 16.2% |
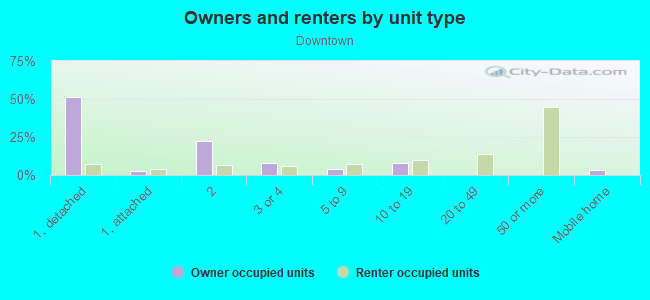
Owner-occupied
Renter-occupied

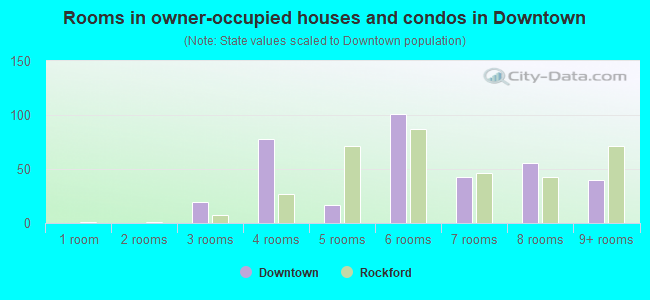
- Rooms in owner-occupied houses and condos in Downtown
- 01 room
- 02 rooms
- 143 rooms
- 344 rooms
- 315 rooms
- 446 rooms
- 897 rooms
- 728 rooms
- 619+ rooms
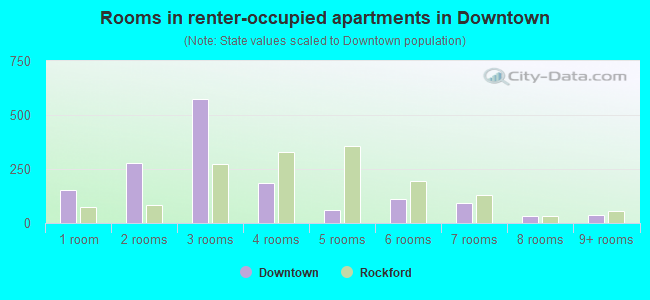
- Rooms in renter-occupied apartments in Downtown
- 51 room
- 342 rooms
- 93 rooms
- 1634 rooms
- 665 rooms
- 126 rooms
- 107 rooms
- 138 rooms
- 169+ rooms
Owner-occupied
Renter-occupied
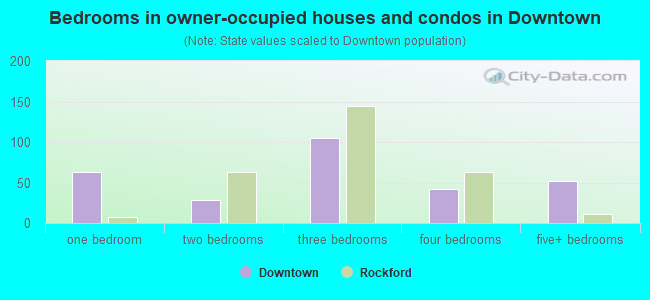
- Bedrooms in owner-occupied houses and condos in Downtown
- 0no bedroom
- 231 bedroom
- 732 bedrooms
- 1283 bedrooms
- 1094 bedrooms
- 145+ bedrooms
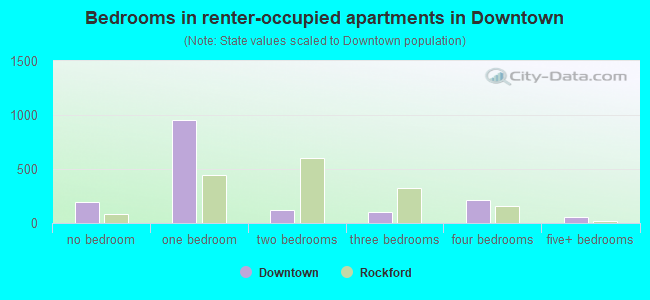
- Bedrooms in renter-occupied apartments in Downtown
- 11no bedroom
- 331 bedroom
- 1452 bedrooms
- 253 bedrooms
- 154 bedrooms
- 05+ bedrooms
Average number of cars or other vehicles available in houses/condos:
Average number of cars or other vehicles available in apartments:
| This neighborhood: | 1.4 |
| Lombard: | 2.0 |
Average number of cars or other vehicles available in apartments:
| Here: | 1.7 |
| village: | 1.4 |
Percentage of units with a mortgage:
| Downtown: | 70.5% |
| Lombard: | 65.7% |
Average estimated value of detached houses in 2022 (51.4% of all units):
| Downtown: | $398,883 |
| Illinois: | $310,164 |
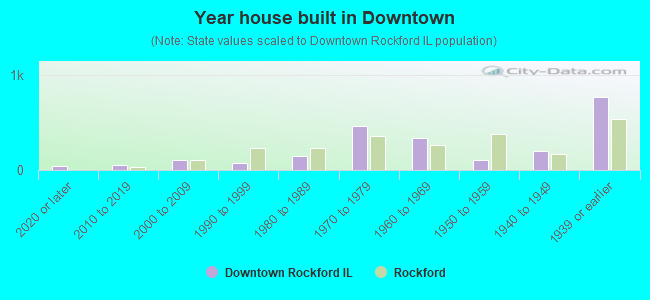
- Year house built in Downtown
- 02020 or later
- 1182010 to 2019
- 262000 to 2009
- 621990 to 1999
- 381980 to 1989
- 1211970 to 1979
- 791960 to 1969
- 1081950 to 1959
- 741940 to 1949
- 1401939 or earlier
City-data.com crime index for village in 2020 (higher means more crime):
| City: | 109.0 |
| U.S. average: | 219.5 |
Travel time to work (commute)
![Travel time to work (commute)]()
- 3Less than 5 minutes
- 1035 to 9 minutes
- 14610 to 14 minutes
- 12715 to 19 minutes
- 15420 to 24 minutes
- 14525 to 29 minutes
- 10830 to 34 minutes
- 3835 to 39 minutes
- 2540 to 44 minutes
- 7345 to 59 minutes
- 3860 to 89 minutes
- 1290 or more minutes

Means of transportation to work
![Means of transportation to work]()
- 72.0%557Drove a car alone
- 4.0%31Carpooled
- 17.6%136Long-distance train or commuter rail
- 1.4%11Taxi
- 5.8%45Walked
- 0.8%6Other means
- 20.9%162Worked at home

Time leaving home to go to work
![Time leaving home to go to work]()
- 912:00 a.m. to 4:59 a.m.
- 215:00 a.m. to 5:29 a.m.
- 545:30 a.m. to 5:59 a.m.
- 1326:00 a.m. to 6:29 a.m.
- 1036:30 a.m. to 6:59 a.m.
- 1467:00 a.m. to 7:29 a.m.
- 1827:30 a.m. to 7:59 a.m.
- 818:00 a.m. to 8:29 a.m.
- 1268:30 a.m. to 8:59 a.m.
- 119:00 a.m. to 9:59 a.m.
- 2010:00 a.m. to 10:59 a.m.
- 1911:00 a.m. to 11:59 a.m.
- 3612:00 p.m. to 3:59 p.m.
- 614:00 p.m. to 11:59 p.m.

Occupations of males:
- Percentage of males in management occupations (except farmers):
Here: 17.0% village: 17.8%
- Percentage of males in business and financial operations occupations:
Here: 3.5% village: 7.5%
- Percentage of males in architecture and engineering occupations:
Here: 14.6% village: 4.2%
- Percentage of males in life, physical, and social science occupations:
Here: 3.0% village: 1.2%
- Percentage of males in arts, design, entertainment, sports, and media occupations:
Here: 1.7% village: 1.9%
- Percentage of males in service occupations:
Here: 11.2% village: 11.4%
- Percentage of males in sales and office occupations:
Here: 27.4% village: 14.5%
- Percentage of males in farming, fishing, and forestry occupations:
Here: 1.8% village: 0.2%
- Percentage of males in construction, extraction, and maintenance occupations:
Here: 5.5% village: 5.4%
- Percentage of males in production occupations:
Here: 1.7% village: 5.0%
- Percentage of males in transportation occupations:
Here: 5.2% village: 3.8%
- Percentage of males in material moving occupations:
Here: 3.7% village: 4.5%
Occupations of females:
- Percentage of females in management occupations (except farmers):
Here: 12.8% village: 13.5%
- Percentage of females in business and financial operations occupations:
Here: 4.0% village: 9.3%
- Percentage of females in computer and mathematical occupations:
Here: 1.2% village: 2.5%
- Percentage of females in life, physical, and social science occupations:
Here: 6.8% village: 1.2%
- Percentage of females in community and social services occupations:
Here: 4.1% village: 2.2%
- Percentage of females in education, training, and library occupations:
Here: 14.8% village: 11.0%
- Percentage of females in healthcare practitioners and technical occupations:
Here: 20.2% village: 12.6%
- Percentage of females in service occupations:
Here: 10.4% village: 12.8%
- Percentage of females in sales and office occupations:
Here: 23.9% village: 29.1%
- Percentage of females in transportation occupations:
Here: 1.1% village: 0.9%
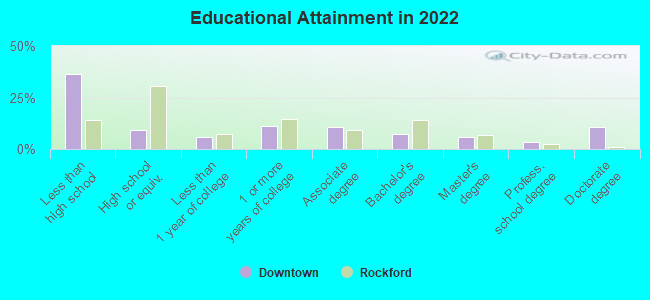
Education in this neighborhood (subdivision or community):
- Percentage of people 3 years and older in K-12 schools:
Downtown: 27.7% Lombard: 14.6%
- Percentage of people 3 years and older in undergraduate colleges:
Downtown: 5.7% Lombard: 5.1%
- Percentage of people 3 years and older in grad. or professional schools:
Downtown: 1.8% Lombard: 2.5%
- Percentage of students K-12 enrolled in private schools:
Downtown: 26.7% Lombard: 13.9%
Percentage of population below poverty level:
| Downtown: | 4.8% |
| Lombard: | 7.1% |
Median year owner moved in (as recorded in 2022):
| Downtown: | 2010 |
| Lombard: | 2007 |
Percentage of married-couple families with both working:
| Downtown: | 108.4% |
| Lombard: | 77.3% |
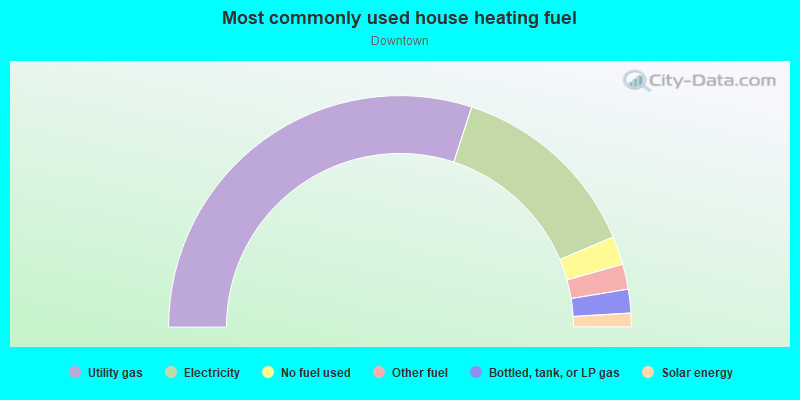
- 78.0%Utility gas
- 16.3%Electricity
- 2.8%Bottled, tank, or LP gas
- 2.8%No fuel used
Roads and streets:
W Grove St
Length: 0.44 miles
Directions: E-W, SE-NW
Address range: 1 to 314
Directions: E-W, SE-NW
Address range: 1 to 314
E Parkside Ave
Length: 0.41 miles
Direction: E-W
Address range: 1 to 230
Direction: E-W
Address range: 1 to 230
E Saint Charles Rd
Length: 0.40 miles
Direction: E-W
Address range: 1 to 232
Direction: E-W
Address range: 1 to 232
Michael McGuire Dr
Length: 0.40 miles
Directions: E-W, SW-NE
Directions: E-W, SW-NE
W Saint Charles Rd
Length: 0.40 miles
Direction: E-W
Address range: 1 to 298
Direction: E-W
Address range: 1 to 298
W Parkside Ave
Length: 0.39 miles
Direction: E-W
Address range: 1 to 247
Direction: E-W
Address range: 1 to 247
W Maple St
Length: 0.38 miles
Direction: E-W
Address range: 1 to 299
Direction: E-W
Address range: 1 to 299
E Grove St
Length: 0.30 miles
Direction: E-W
Address range: 1 to 153
Direction: E-W
Address range: 1 to 153
S Charlotte St
Length: 0.25 miles
Direction: N-S
Address range: 1 to 199
Direction: N-S
Address range: 1 to 199
Elizabeth St
Length: 0.25 miles
Directions: N-S, SE-NW
Address range: 1 to 99
Directions: N-S, SE-NW
Address range: 1 to 99
S Main St
Length: 0.23 miles
Direction: N-S
Address range: 1 to 199
Direction: N-S
Address range: 1 to 199
N Lincoln Ave
Length: 0.21 miles
Direction: N-S
Address range: 1 to 99
Direction: N-S
Address range: 1 to 99
S Park Ave
Length: 0.20 miles
Direction: N-S
Address range: 1 to 199
Direction: N-S
Address range: 1 to 199
N Park Ave
Length: 0.16 miles
Direction: N-S
Address range: 1 to 99
Direction: N-S
Address range: 1 to 99
Orchard Ter
Length: 0.16 miles
Directions: E-W, N-S
Address range: 33 to 117
Directions: E-W, N-S
Address range: 33 to 117
E Maple St
Length: 0.15 miles
Direction: E-W
Address range: 1 to 99
Direction: E-W
Address range: 1 to 99
S Elizabeth St
Length: 0.15 miles
Direction: N-S
Address range: 1 to 199
Direction: N-S
Address range: 1 to 199
N Main St
Length: 0.13 miles
Direction: N-S
Address range: 1 to 99
Direction: N-S
Address range: 1 to 99
N Charlotte St
Length: 0.10 miles
Direction: N-S
Address range: 2 to 99
Direction: N-S
Address range: 2 to 99
N Garfield St
Length: 0.08 miles
Direction: N-S
Address range: 1 to 35
Direction: N-S
Address range: 1 to 35
N Martha St
Length: 0.06 miles
Direction: N-S
Address range: 1 to 25
Direction: N-S
Address range: 1 to 25
Lincoln Ave
Length: 0.05 miles
Direction: SE-NW
Direction: SE-NW
Railroad features:
Union Pacific RR
Length: 2.40 miles
Direction: E-W
Direction: E-W
Chicago and North Western RR
Length: 0.80 miles
Direction: E-W
Direction: E-W