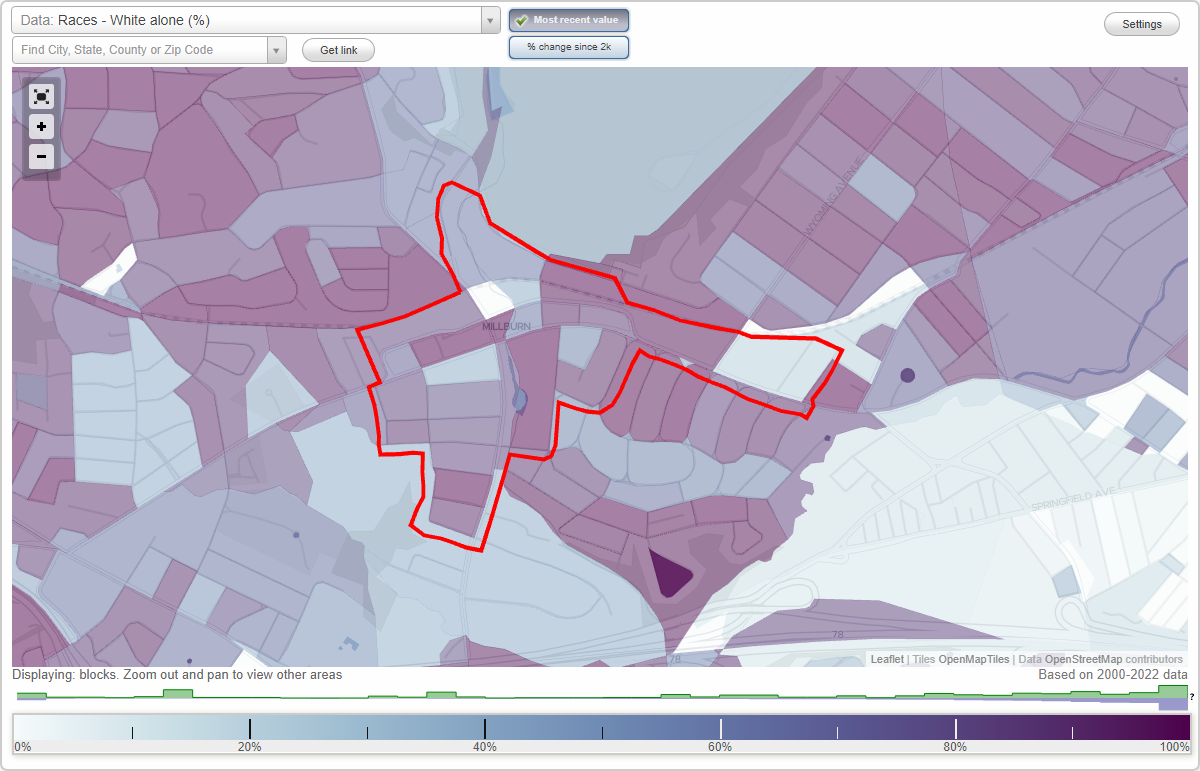
Downtown (Millburn Center) neighborhood in Millburn, New Jersey (NJ), 07041 detailed profile
Settings
X

Business Search - 14 Million verified businesses
Area: 0.324 square miles
Population: 1,886
Population density:
| Downtown (Millburn Center): | 5,816 people per square mile |
| Millburn: | 2,106 people per square mile |

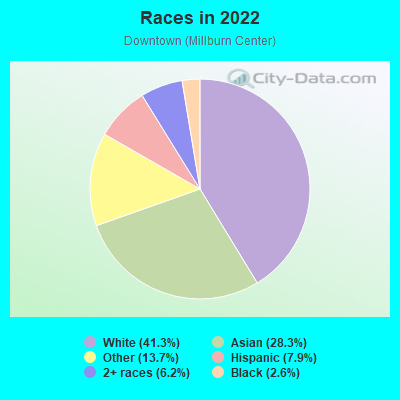
- 83541.3%White
- 57228.3%Asian
- 27713.7%Some other race
- 1607.9%Hispanic or Latino
- 1256.2%Two or more races
- 532.6%Black
Median household income in 2022:
| Downtown (Millburn Center): | $224,834 |
| New Jersey: | $96,346 |
Distribution of median household income
![Distribution of median household income]()
- 46Less than $10,000
- 62$10,000 to $19,999
- 35$20,000 to $29,999
- 62$30,000 to $39,999
- 55$40,000 to $49,999
- 57$50,000 to $59,999
- 61$60,000 to $74,999
- 71$75,000 to $99,999
- 64$100,000 to $124,999
- 27$125,000 to $149,999
- 62$150,000 to $199,999
- 333$200,000 or more

Distribution of owner-occupied house/condo value
![Distribution of owner-occupied house/condo value]()
- 1Less than $50,000
- 33$100,000 to $149,999
- 3$150,000 to $199,999
- 16$200,000 to $249,999
- 11$250,000 to $299,999
- 27$300,000 to $399,999
- 46$400,000 to $499,999
- 125$500,000 to $749,999
- 117$750,000 to $999,999
- 192$1,000,000 or more

Distribution of rent paid by renters
![Distribution of rent paid by renters]()
- 28$800 to $899
- 14$1,000 to $1,249
- 41$1,250 to $1,499
- 127$1,500 to $1,999
- 199$2,000 or more

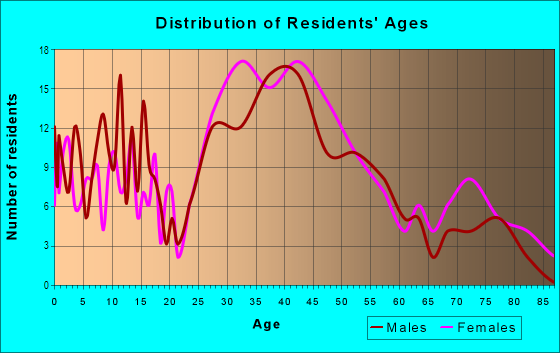
| Males: | 900 |
| Females: | 986 |
| Males: | 40.2 years |
| Females: | 41.7 years |
Average household size:
| Downtown (Millburn Center): | 8.5 people |
| New Jersey: | 2.6 people |
Percentage of family households:
| Downtown (Millburn Center): | 66.5% |
| New Jersey: | 47.0% |
| Here: | 62.1% |
| New Jersey: | 49.9% |
Percentage of married-couple families with children (among all households):
| Downtown (Millburn Center): | 26.7% |
| New Jersey: | 51.5% |
Percentage of single-mother households (among all households):
| Downtown (Millburn Center): | 5.9% |
| New Jersey: | 7.6% |
Percentage of never married males 15 years old and over:
Percentage of never married females 15 years old and over:
| Downtown (Millburn Center): | 12.5% |
| New Jersey: | 18.2% |
Percentage of never married females 15 years old and over:
| Downtown (Millburn Center): | 17.6% |
| New Jersey: | 16.6% |
Percentage of people that speak English not well or not at all:
| Downtown (Millburn Center): | 4.8% |
| New Jersey: | 6.5% |
Percentage of people born in this state:
Percentage of people born in another U.S. state:
Percentage of native residents but born outside the U.S.:
Percentage of foreign born residents:
| Here: | 28.3% |
| New Jersey: | 50.7% |
Percentage of people born in another U.S. state:
| Downtown (Millburn Center): | 29.7% |
| New Jersey: | 23.4% |
Percentage of native residents but born outside the U.S.:
| Here: | 2.0% |
| New Jersey: | 2.4% |
Percentage of foreign born residents:
| Here: | 39.9% |
| New Jersey: | 23.5% |
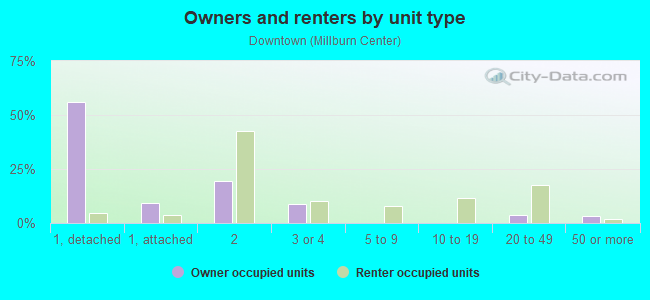
Owner-occupied
Renter-occupied

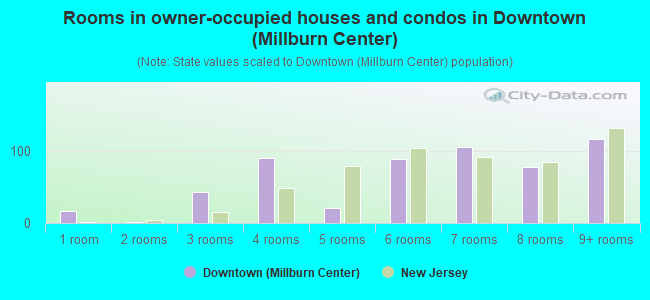
- Rooms in owner-occupied houses and condos in Downtown <
> - 161 room
- 12 rooms
- 433 rooms
- 904 rooms
- 215 rooms
- 896 rooms
- 1057 rooms
- 778 rooms
- 1169+ rooms
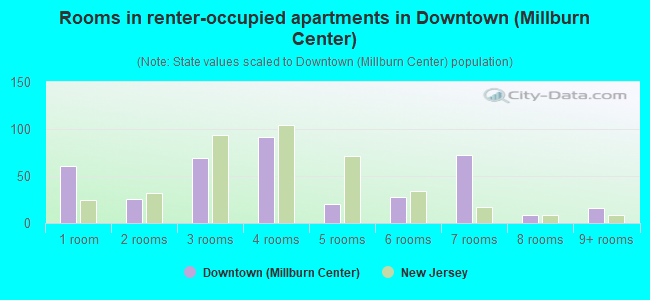
- Rooms in renter-occupied apartments in Downtown <
> - 611 room
- 262 rooms
- 693 rooms
- 924 rooms
- 205 rooms
- 286 rooms
- 727 rooms
- 98 rooms
- 169+ rooms
Owner-occupied
Renter-occupied
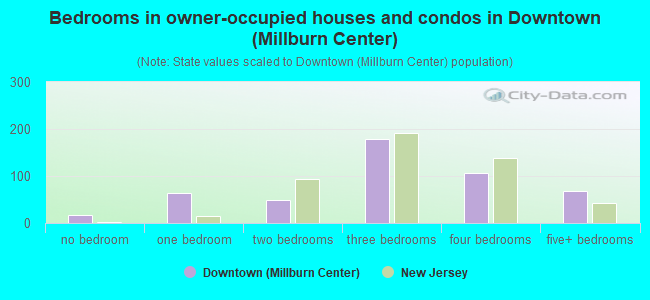
- Bedrooms in owner-occupied houses and condos in Downtown <
> - 16no bedroom
- 641 bedroom
- 492 bedrooms
- 1793 bedrooms
- 1064 bedrooms
- 695+ bedrooms
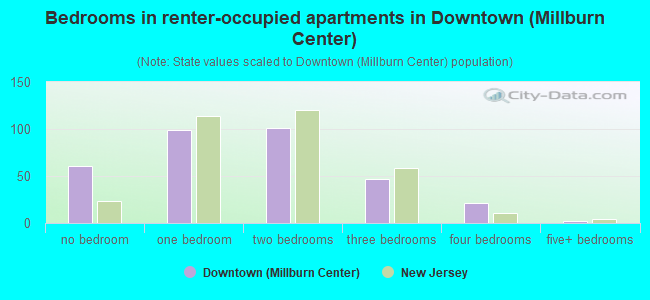
- Bedrooms in renter-occupied apartments in Downtown <
> - 61no bedroom
- 991 bedroom
- 1012 bedrooms
- 473 bedrooms
- 214 bedrooms
- 25+ bedrooms
Average number of cars or other vehicles available in houses/condos:
Average number of cars or other vehicles available in apartments:
| This neighborhood: | 2.0 |
| New Jersey: | 2.0 |
Average number of cars or other vehicles available in apartments:
| Here: | 1.4 |
| New Jersey: | 1.1 |
Percentage of units with a mortgage:
| Downtown (Millburn Center): | 58.5% |
| New Jersey: | 63.3% |
Average estimated value of detached houses in 2022 (51.1% of all units):
| Downtown (Millburn Center): | $932,046 |
| New Jersey: | $537,591 |
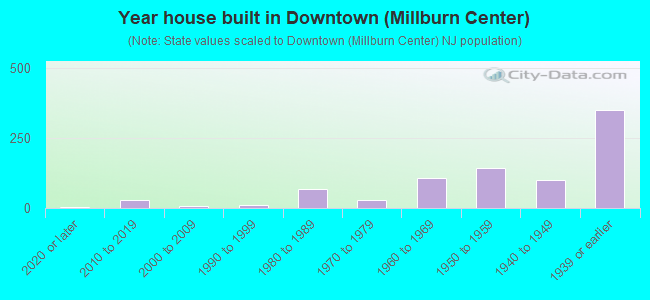
- Year house built in Downtown <
> - 42020 or later
- 292010 to 2019
- 82000 to 2009
- 111990 to 1999
- 661980 to 1989
- 281970 to 1979
- 1081960 to 1969
- 1421950 to 1959
- 991940 to 1949
- 3491939 or earlier
City-data.com crime index for place in 2020 (higher means more crime):
| City: | 75.7 |
| U.S. average: | 219.5 |
Travel time to work (commute)
![Travel time to work (commute)]()
- 27Less than 5 minutes
- 335 to 9 minutes
- 2810 to 14 minutes
- 3615 to 19 minutes
- 2420 to 24 minutes
- 1725 to 29 minutes
- 9730 to 34 minutes
- 2735 to 39 minutes
- 5340 to 44 minutes
- 5345 to 59 minutes
- 18260 to 89 minutes
- 3690 or more minutes

Means of transportation to work
![Means of transportation to work]()
- 46.9%440Drove a car alone
- 3.4%32Carpooled
- 0.1%1Bus
- 8.0%75Subway or elevated rail
- 12.7%119Long-distance train or commuter rail
- 3.9%37Light rail, streetcar or trolley
- 4.3%40Ferryboat
- 2.7%25Motorcycle
- 4.7%44Walked
- 1.7%16Other means
- 25.6%240Worked at home

Time leaving home to go to work
![Time leaving home to go to work]()
- 1312:00 a.m. to 4:59 a.m.
- 15:00 a.m. to 5:29 a.m.
- 85:30 a.m. to 5:59 a.m.
- 366:00 a.m. to 6:29 a.m.
- 696:30 a.m. to 6:59 a.m.
- 1177:00 a.m. to 7:29 a.m.
- 1307:30 a.m. to 7:59 a.m.
- 808:00 a.m. to 8:29 a.m.
- 538:30 a.m. to 8:59 a.m.
- 549:00 a.m. to 9:59 a.m.
- 610:00 a.m. to 10:59 a.m.
- 1011:00 a.m. to 11:59 a.m.
- 1112:00 p.m. to 3:59 p.m.
- 104:00 p.m. to 11:59 p.m.

Occupations of males:
- Percentage of males in management occupations (except farmers):
Here: 24.2% New Jersey: 13.9%
- Percentage of males in business and financial operations occupations:
Here: 8.7% New Jersey: 6.9%
- Percentage of males in computer and mathematical occupations:
Here: 9.4% New Jersey: 6.5%
- Percentage of males in architecture and engineering occupations:
Here: 1.8% New Jersey: 3.1%
- Percentage of males in legal occupations:
Here: 2.1% New Jersey: 1.5%
- Percentage of males in education, training, and library occupations:
Here: 13.5% New Jersey: 3.6%
- Percentage of males in arts, design, entertainment, sports, and media occupations:
Here: 8.4% New Jersey: 2.0%
- Percentage of males in healthcare practitioners and technical occupations:
Here: 3.5% New Jersey: 3.2%
- Percentage of males in service occupations:
Here: 4.1% New Jersey: 12.9%
- Percentage of males in sales and office occupations:
Here: 9.4% New Jersey: 15.3%
- Percentage of males in construction, extraction, and maintenance occupations:
Here: 1.6% New Jersey: 8.1%
- Percentage of males in production occupations:
Here: 8.6% New Jersey: 4.8%
- Percentage of males in transportation occupations:
Here: 4.2% New Jersey: 6.5%
Occupations of females:
- Percentage of females in management occupations (except farmers):
Here: 25.5% New Jersey: 10.4%
- Percentage of females in business and financial operations occupations:
Here: 10.9% New Jersey: 7.3%
- Percentage of females in computer and mathematical occupations:
Here: 5.9% New Jersey: 2.4%
- Percentage of females in architecture and engineering occupations:
Here: 1.5% New Jersey: 0.6%
- Percentage of females in life, physical, and social science occupations:
Here: 6.0% New Jersey: 1.4%
- Percentage of females in legal occupations:
Here: 2.9% New Jersey: 1.6%
- Percentage of females in education, training, and library occupations:
Here: 3.6% New Jersey: 11.4%
- Percentage of females in healthcare practitioners and technical occupations:
Here: 7.1% New Jersey: 9.6%
- Percentage of females in service occupations:
Here: 11.8% New Jersey: 17.2%
- Percentage of females in sales and office occupations:
Here: 17.7% New Jersey: 26.7%
- Percentage of females in production occupations:
Here: 2.2% New Jersey: 2.7%
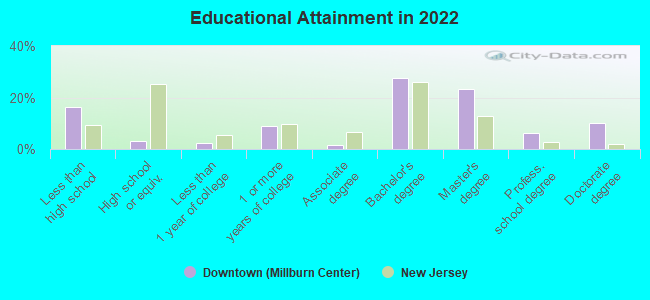
Education in this neighborhood (subdivision or community):
- Percentage of people 3 years and older in K-12 schools:
Downtown (Millburn Center): 26.0% New Jersey: 16.6%
- Percentage of people 3 years and older in undergraduate colleges:
Downtown (Millburn Center): 2.5% New Jersey: 4.9%
- Percentage of people 3 years and older in grad. or professional schools:
Downtown (Millburn Center): 1.9% New Jersey: 1.6%
- Percentage of students K-12 enrolled in private schools:
Downtown (Millburn Center): 33.5% New Jersey: 12.7%
Percentage of population below poverty level:
| Downtown (Millburn Center): | 6.2% |
| New Jersey: | 9.7% |
Median year owner moved in (as recorded in 2022):
| Downtown (Millburn Center): | 2010 |
| New Jersey: | 2008 |
Percentage of married-couple families with both working:
| Downtown (Millburn Center): | 87.9% |
| New Jersey: | 72.0% |
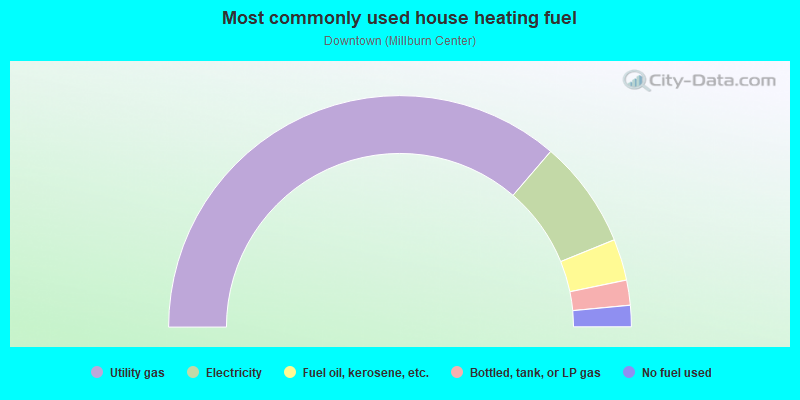
- 72.6%Utility gas
- 15.1%Electricity
- 5.8%Fuel oil, kerosene, etc.
- 3.5%Bottled, tank, or LP gas
- 3.0%No fuel used
Roads and streets:
Millburn Ave (Rte 527)
Length: 1.23 miles
Direction: E-W
Address range: 173 to 403
Direction: E-W
Address range: 173 to 403
Essex St
Length: 0.83 miles
Directions: E-W, N-S, SE-NW, SW-NE
Address range: 1 to 470
Directions: E-W, N-S, SE-NW, SW-NE
Address range: 1 to 470
Main St (Rte 577)
Length: 0.60 miles
Directions: N-S, SE-NW, SW-NE
Address range: 1 to 225
Directions: N-S, SE-NW, SW-NE
Address range: 1 to 225
Spring St
Length: 0.48 miles
Directions: E-W, N-S, SE-NW
Address range: 1 to 171
Directions: E-W, N-S, SE-NW
Address range: 1 to 171
Church St
Length: 0.34 miles
Direction: E-W
Address range: 1 to 86
Direction: E-W
Address range: 1 to 86
Rector St
Length: 0.33 miles
Direction: E-W
Address range: 1 to 99
Direction: E-W
Address range: 1 to 99
Wittingham Ter
Length: 0.28 miles
Direction: N-S
Address range: 1 to 81
Direction: N-S
Address range: 1 to 81
Willow St
Length: 0.26 miles
Directions: E-W, N-S, SE-NW
Address range: 1 to 99
Directions: E-W, N-S, SE-NW
Address range: 1 to 99
Taylor St
Length: 0.22 miles
Direction: E-W
Address range: 1 to 46
Direction: E-W
Address range: 1 to 46
Parkview Dr
Length: 0.19 miles
Directions: E-W, SW-NE
Address range: 1 to 38
Directions: E-W, SW-NE
Address range: 1 to 38
Wyoming Ave
Length: 0.18 miles
Directions: E-W, N-S, SE-NW, SW-NE
Address range: 470 to 504
Directions: E-W, N-S, SE-NW, SW-NE
Address range: 470 to 504
Mountainview Rd
Length: 0.17 miles
Directions: E-W, SW-NE
Address range: 76 to 116
Directions: E-W, SW-NE
Address range: 76 to 116
Lackawanna Pl
Length: 0.16 miles
Directions: N-S, SW-NE
Address range: 2 to 24
Directions: N-S, SW-NE
Address range: 2 to 24
Meeker Pl
Length: 0.16 miles
Direction: E-W
Address range: 1 to 37
Direction: E-W
Address range: 1 to 37
Locust Ave
Length: 0.15 miles
Direction: SW-NE
Address range: 1 to 43
Direction: SW-NE
Address range: 1 to 43
Ridgewood Rd
Length: 0.15 miles
Direction: E-W
Address range: 942 to 962
Direction: E-W
Address range: 942 to 962
Rawley Pl
Length: 0.15 miles
Directions: N-S, SW-NE
Address range: 1 to 64
Directions: N-S, SW-NE
Address range: 1 to 64
Douglas St
Length: 0.13 miles
Directions: N-S, SE-NW, SW-NE
Address range: 1 to 25
Directions: N-S, SE-NW, SW-NE
Address range: 1 to 25
Wittkop Pl
Length: 0.08 miles
Direction: E-W
Address range: 1 to 26
Direction: E-W
Address range: 1 to 26
Myrtle Ave
Length: 0.08 miles
Directions: E-W, N-S, SE-NW, SW-NE
Address range: 136 to 145
Directions: E-W, N-S, SE-NW, SW-NE
Address range: 136 to 145
Blaine St
Length: 0.05 miles
Direction: N-S
Address range: 31 to 59
Direction: N-S
Address range: 31 to 59
Essex County 630
Length: 0.05 miles
Direction: E-W
Direction: E-W
Holmes St
Length: 0.05 miles
Direction: N-S
Address range: 1 to 22
Direction: N-S
Address range: 1 to 22
Rte 527 (Old Short Hills Rd)
Length: 0.04 miles
Direction: SE-NW
Address range: 1 to 8
Direction: SE-NW
Address range: 1 to 8
Railroad features:
Erie-Lackawanna RR
Length: 0.22 miles
Direction: E-W
Direction: E-W
Other features:
Rahway River West Br
Length: 0.43 miles
Directions: N-S, SE-NW, SW-NE
Directions: N-S, SE-NW, SW-NE