Dream Valley neighborhood in West Fork, Arkansas (AR), 72774 detailed profile
Settings
X


Business Search - 14 Million verified businesses
Area: 0.006 square miles
Median household income in 2022:
| Dream Valley: | $69,583 |
| West Fork: | $68,108 |
Distribution of median household income
![Distribution of median household income]()
- 1Less than $10,000
- 1$10,000 to $19,999
- 1$20,000 to $29,999
- 1$30,000 to $39,999
- 1$40,000 to $49,999
- 1$50,000 to $59,999
- 1$60,000 to $74,999
- 1$75,000 to $99,999
- 1$100,000 to $124,999
- 1$125,000 to $149,999
- 1$150,000 to $199,999
- 1$200,000 or more

Distribution of owner-occupied house/condo value
![Distribution of owner-occupied house/condo value]()
- 1Less than $50,000
- 1$50,000 to $99,999
- 1$100,000 to $149,999
- 1$150,000 to $199,999
- 1$200,000 to $249,999
- 1$250,000 to $299,999
- 1$300,000 to $399,999
- 1$400,000 to $499,999

Distribution of rent paid by renters
![Distribution of rent paid by renters]()
- 1$500 to $599
- 1$600 to $699

Median rent in 2022:
| Dream Valley: | $618 |
| West Fork: | $688 |
Average household size:
| Dream Valley: | 2.3 people |
| West Fork: | 2.7 people |
Percentage of family households:
| Dream Valley: | 56.5% |
| West Fork: | 53.2% |
| Here: | 56.5% |
| West Fork: | 51.9% |
Percentage of never married males 15 years old and over:
Percentage of never married females 15 years old and over:
| Dream Valley: | 12.5% |
| West Fork: | 16.2% |
Percentage of never married females 15 years old and over:
| Dream Valley: | 8.1% |
| city: | 7.6% |
Average number of cars or other vehicles available in houses/condos:
Average number of cars or other vehicles available in apartments:
| This neighborhood: | 2.2 |
| West Fork: | 2.0 |
Average number of cars or other vehicles available in apartments:
| Here: | 1.2 |
| city: | 2.2 |
Percentage of units with a mortgage:
| Dream Valley: | 41.5% |
| West Fork: | 62.3% |
City-data.com crime index for city in 2020 (higher means more crime):
| City: | 172.2 |
| U.S. average: | 219.5 |
Means of transportation to work
![Means of transportation to work]()

Occupations of males:
- Percentage of males in management occupations (except farmers):
Here: 12.5% city: 6.6%
- Percentage of males in architecture and engineering occupations:
Here: 3.7% city: 0.8%
- Percentage of males in education, training, and library occupations:
Here: 6.8% city: 2.8%
- Percentage of males in arts, design, entertainment, sports, and media occupations:
Here: 3.7% city: 3.1%
- Percentage of males in healthcare practitioners and technical occupations:
Here: 2.0% city: 3.1%
- Percentage of males in service occupations:
Here: 11.8% city: 26.1%
- Percentage of males in sales and office occupations:
Here: 11.5% city: 10.4%
- Percentage of males in construction, extraction, and maintenance occupations:
Here: 26.7% city: 16.0%
- Percentage of males in production occupations:
Here: 5.4% city: 8.6%
- Percentage of males in transportation occupations:
Here: 4.1% city: 9.7%
- Percentage of males in material moving occupations:
Here: 3.7% city: 4.3%
Occupations of females:
- Percentage of females in management occupations (except farmers):
Here: 6.4% city: 17.5%
- Percentage of females in business and financial operations occupations:
Here: 5.2% city: 2.4%
- Percentage of females in computer and mathematical occupations:
Here: 6.4% city: 2.9%
- Percentage of females in legal occupations:
Here: 3.1% city: 0.0%
- Percentage of females in education, training, and library occupations:
Here: 12.3% city: 11.0%
- Percentage of females in arts, design, entertainment, sports, and media occupations:
Here: 1.5% city: 0.7%
- Percentage of females in healthcare practitioners and technical occupations:
Here: 12.6% city: 7.4%
- Percentage of females in service occupations:
Here: 26.4% city: 21.1%
- Percentage of females in sales and office occupations:
Here: 25.2% city: 24.3%
Percentage of married-couple families with both working:
| Dream Valley: | 80.2% |
| West Fork: | 75.2% |
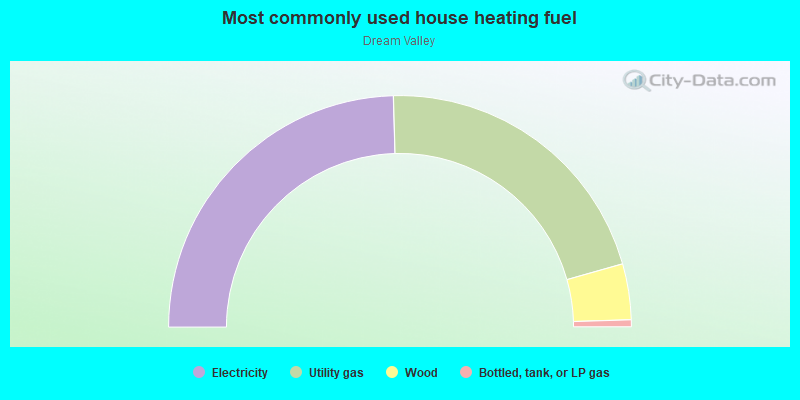
- 49.1%Electricity
- 42.1%Utility gas
- 7.8%Wood
- 1.0%Bottled, tank, or LP gas