Dunwoody Townhomes neighborhood in Atlanta, Georgia (GA), 30350 detailed profile
Settings
X


Business Search - 14 Million verified businesses
Area: 0.085 square miles
Population: 615
Population density:
| Dunwoody Townhomes: | 7,249 people per square mile |
| Atlanta: | 3,788 people per square mile |

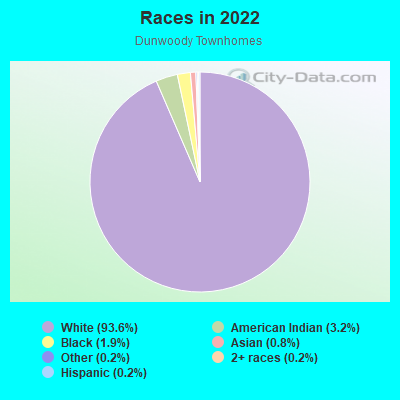
- 58293.6%White
- 203.2%American Indian
- 121.9%Black
- 50.8%Asian
- 10.2%Some other race
- 10.2%Two or more races
- 10.2%Hispanic or Latino
Median household income in 2022:
| Dunwoody Townhomes: | $116,427 |
| Atlanta: | $83,251 |
Distribution of median household income
![Distribution of median household income]()
- 16Less than $10,000
- 5$10,000 to $19,999
- 19$20,000 to $29,999
- 2$30,000 to $39,999
- 12$40,000 to $49,999
- 14$50,000 to $59,999
- 9$60,000 to $74,999
- 1$75,000 to $99,999
- 16$100,000 to $124,999
- 2$125,000 to $149,999
- 7$150,000 to $199,999
- 142$200,000 or more

Distribution of owner-occupied house/condo value
![Distribution of owner-occupied house/condo value]()
- 6Less than $50,000
- 2$50,000 to $99,999
- 2$100,000 to $149,999
- 3$150,000 to $199,999
- 1$200,000 to $249,999
- 6$250,000 to $299,999
- 9$300,000 to $399,999
- 7$400,000 to $499,999
- 50$500,000 to $749,999
- 83$750,000 to $999,999
- 94$1,000,000 or more

Distribution of rent paid by renters
![Distribution of rent paid by renters]()
- 9$1,000 to $1,249
- 6$1,250 to $1,499
- 5$1,500 to $1,999
- 10$2,000 or more

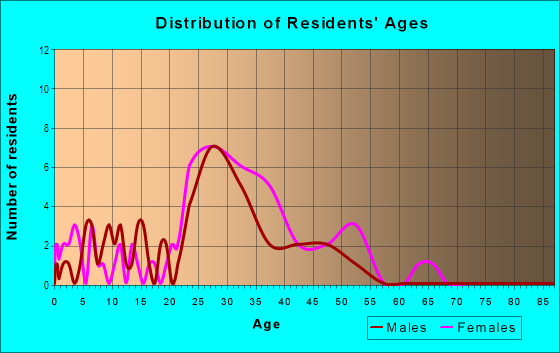
| Males: | 344 |
| Females: | 270 |
Males:
| This neighborhood: | 31.6 years |
| Whole city: | 33.7 years |
| This neighborhood: | 42.0 years |
| Whole city: | 34.3 years |
Average household size:
| Dunwoody Townhomes: | 2.4 people |
| Atlanta: | 2.0 people |
Percentage of family households:
| Dunwoody Townhomes: | 62.5% |
| Atlanta: | 31.6% |
| Here: | 76.2% |
| Atlanta: | 24.9% |
Percentage of married-couple families with children (among all households):
| Dunwoody Townhomes: | 35.9% |
| Atlanta: | 23.2% |
Percentage of single-mother households (among all households):
| Dunwoody Townhomes: | 1.1% |
| Atlanta: | 22.0% |
Percentage of never married males 15 years old and over:
Percentage of never married females 15 years old and over:
| Dunwoody Townhomes: | 5.1% |
| Atlanta: | 28.0% |
Percentage of never married females 15 years old and over:
| Dunwoody Townhomes: | 11.9% |
| city: | 26.3% |
Percentage of people that speak English not well or not at all:
| Dunwoody Townhomes: | 1.4% |
| Atlanta: | 1.0% |
Percentage of people born in this state:
Percentage of people born in another U.S. state:
Percentage of native residents but born outside the U.S.:
Percentage of foreign born residents:
| Here: | 27.6% |
| Atlanta: | 46.3% |
Percentage of people born in another U.S. state:
| Dunwoody Townhomes: | 64.7% |
| Atlanta: | 43.2% |
Percentage of native residents but born outside the U.S.:
| Here: | 0.7% |
| city: | 2.0% |
Percentage of foreign born residents:
| Here: | 7.0% |
| Atlanta: | 8.5% |
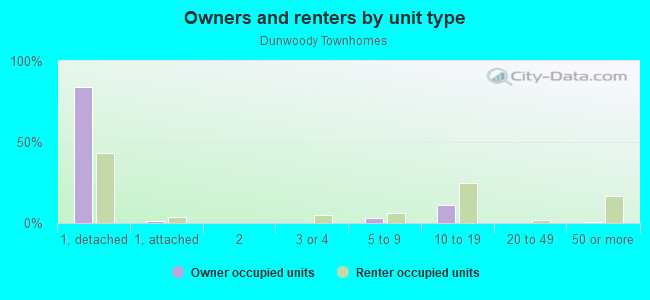
Owner-occupied
Renter-occupied

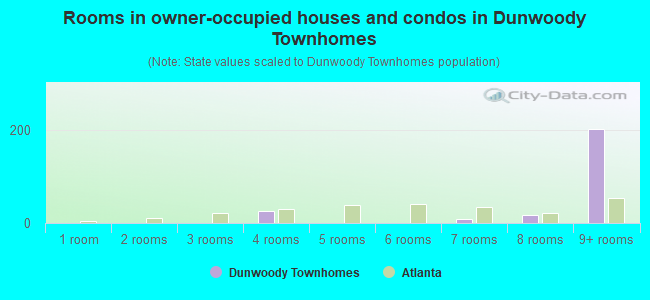
- Rooms in owner-occupied houses and condos in Dunwoody Townhomes
- 01 room
- 02 rooms
- 13 rooms
- 264 rooms
- 15 rooms
- 06 rooms
- 97 rooms
- 178 rooms
- 2039+ rooms
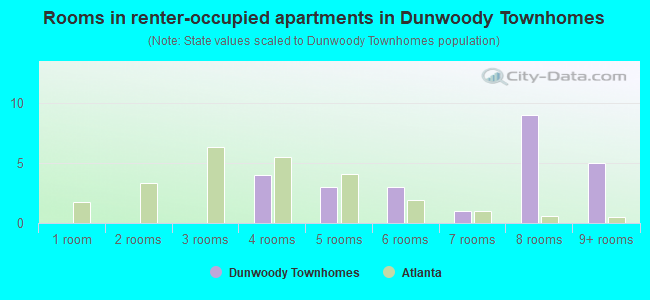
- Rooms in renter-occupied apartments in Dunwoody Townhomes
- 01 room
- 02 rooms
- 03 rooms
- 44 rooms
- 35 rooms
- 36 rooms
- 17 rooms
- 98 rooms
- 59+ rooms
Owner-occupied
Renter-occupied
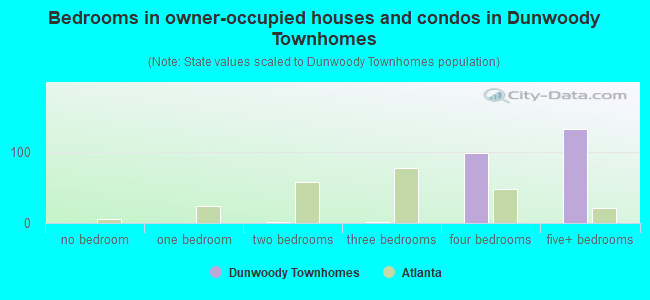
- Bedrooms in owner-occupied houses and condos in Dunwoody Townhomes
- 0no bedroom
- 01 bedroom
- 22 bedrooms
- 13 bedrooms
- 994 bedrooms
- 1325+ bedrooms
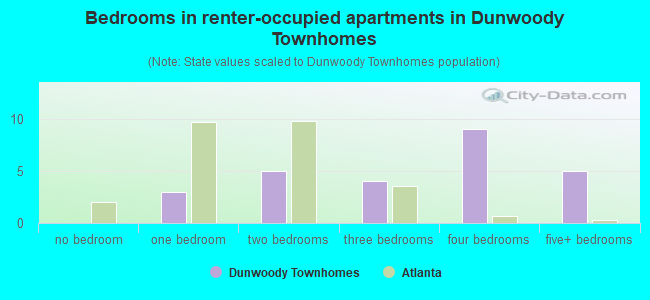
- Bedrooms in renter-occupied apartments in Dunwoody Townhomes
- 0no bedroom
- 31 bedroom
- 52 bedrooms
- 43 bedrooms
- 94 bedrooms
- 55+ bedrooms
Average number of cars or other vehicles available in houses/condos:
Average number of cars or other vehicles available in apartments:
| This neighborhood: | 0.0 |
| Atlanta: | 1.6 |
Average number of cars or other vehicles available in apartments:
| Here: | 1.4 |
| city: | 1.0 |
Percentage of units with a mortgage:
| Dunwoody Townhomes: | 71.4% |
| Atlanta: | 72.0% |
Average estimated value of detached houses in 2022 (98.7% of all units):
| Dunwoody Townhomes: | $1,295,082 |
| Atlanta: | $673,143 |
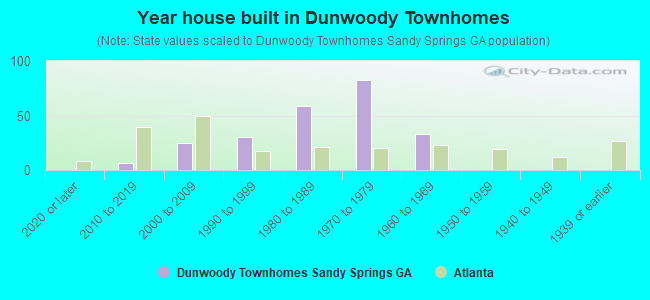
- Year house built in Dunwoody Townhomes
- 02020 or later
- 62010 to 2019
- 252000 to 2009
- 301990 to 1999
- 591980 to 1989
- 831970 to 1979
- 331960 to 1969
- 01950 to 1959
- 01940 to 1949
- 01939 or earlier
City-data.com crime index for city in 2020 (higher means more crime):
| City: | 140.2 |
| U.S. average: | 219.5 |
Travel time to work (commute)
![Travel time to work (commute)]()
- 7Less than 5 minutes
- 285 to 9 minutes
- 910 to 14 minutes
- 3515 to 19 minutes
- 6720 to 24 minutes
- 1925 to 29 minutes
- 5730 to 34 minutes
- 535 to 39 minutes
- 240 to 44 minutes
- 2145 to 59 minutes
- 1160 to 89 minutes
- 990 or more minutes

Means of transportation to work
![Means of transportation to work]()
- 65.9%194Drove a car alone
- 2.7%8Carpooled
- 2.7%8Subway or elevated rail
- 1.0%3Taxi
- 1.0%3Walked
- 3.7%11Other means
- 27.2%80Worked at home

Time leaving home to go to work
![Time leaving home to go to work]()
- 212:00 a.m. to 4:59 a.m.
- 95:00 a.m. to 5:29 a.m.
- 115:30 a.m. to 5:59 a.m.
- 176:00 a.m. to 6:29 a.m.
- 146:30 a.m. to 6:59 a.m.
- 587:00 a.m. to 7:29 a.m.
- 307:30 a.m. to 7:59 a.m.
- 468:00 a.m. to 8:29 a.m.
- 348:30 a.m. to 8:59 a.m.
- 219:00 a.m. to 9:59 a.m.
- 710:00 a.m. to 10:59 a.m.
- 111:00 a.m. to 11:59 a.m.
- 1612:00 p.m. to 3:59 p.m.
- 34:00 p.m. to 11:59 p.m.

Occupations of males:
- Percentage of males in management occupations (except farmers):
Here: 22.7% city: 16.5%
- Percentage of males in business and financial operations occupations:
Here: 9.8% city: 10.8%
- Percentage of males in computer and mathematical occupations:
Here: 4.5% city: 8.5%
- Percentage of males in architecture and engineering occupations:
Here: 3.4% city: 4.2%
- Percentage of males in legal occupations:
Here: 2.7% city: 3.3%
- Percentage of males in healthcare practitioners and technical occupations:
Here: 11.9% city: 3.4%
- Percentage of males in service occupations:
Here: 3.3% city: 11.5%
- Percentage of males in sales and office occupations:
Here: 24.4% city: 15.1%
- Percentage of males in production occupations:
Here: 11.1% city: 1.9%
- Percentage of males in material moving occupations:
Here: 5.7% city: 4.3%
Occupations of females:
- Percentage of females in management occupations (except farmers):
Here: 14.5% city: 14.0%
- Percentage of females in business and financial operations occupations:
Here: 9.7% city: 10.8%
- Percentage of females in architecture and engineering occupations:
Here: 3.3% city: 1.4%
- Percentage of females in life, physical, and social science occupations:
Here: 4.2% city: 1.9%
- Percentage of females in community and social services occupations:
Here: 9.9% city: 2.5%
- Percentage of females in legal occupations:
Here: 3.7% city: 3.1%
- Percentage of females in education, training, and library occupations:
Here: 19.2% city: 8.9%
- Percentage of females in arts, design, entertainment, sports, and media occupations:
Here: 5.6% city: 4.9%
- Percentage of females in healthcare practitioners and technical occupations:
Here: 18.0% city: 7.6%
- Percentage of females in sales and office occupations:
Here: 49.4% city: 21.9%
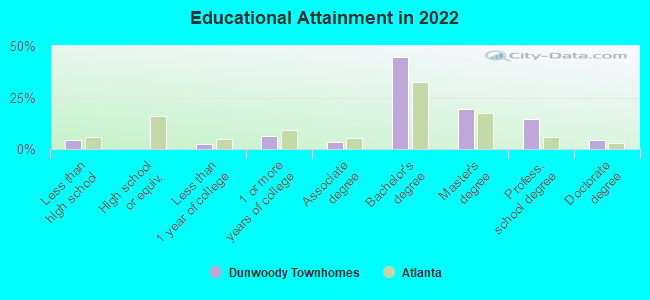
Education in this neighborhood (subdivision or community):
- Percentage of people 3 years and older in K-12 schools:
Dunwoody Townhomes: 16.0% Atlanta: 12.5%
- Percentage of people 3 years and older in undergraduate colleges:
Dunwoody Townhomes: 3.6% Atlanta: 8.9%
- Percentage of people 3 years and older in grad. or professional schools:
Dunwoody Townhomes: 1.5% Atlanta: 3.3%
- Percentage of students K-12 enrolled in private schools:
Dunwoody Townhomes: 44.7% Atlanta: 22.5%
Percentage of population below poverty level:
| Dunwoody Townhomes: | 9.1% |
| Atlanta: | 17.3% |
Median year owner moved in (as recorded in 2022):
| Dunwoody Townhomes: | 2015 |
| Atlanta: | 2015 |
Percentage of married-couple families with both working:
| Dunwoody Townhomes: | 90.1% |
| Atlanta: | 79.0% |
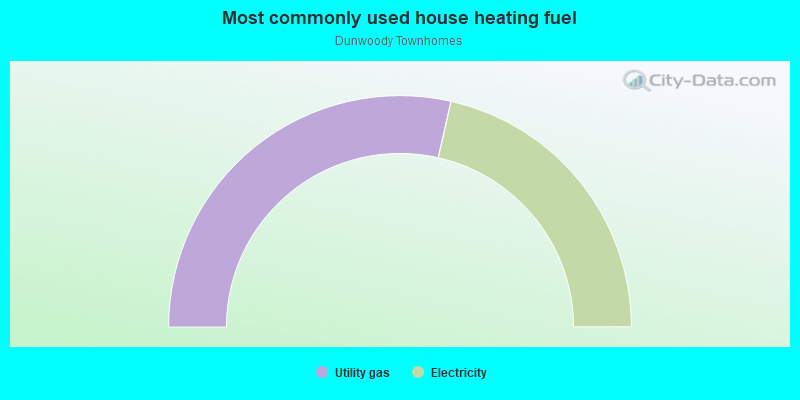
- 57.1%Utility gas
- 42.9%Electricity
Roads and streets:
Roberts Dr
Length: 0.38 miles
Directions: N-S, SE-NW, SW-NE
Address range: 8603 to 9226
Directions: N-S, SE-NW, SW-NE
Address range: 8603 to 9226
Long Beach Cir
Length: 0.26 miles
Directions: E-W, N-S, SE-NW, SW-NE
Address range: 8700 to 8899
Directions: E-W, N-S, SE-NW, SW-NE
Address range: 8700 to 8899
Applegate Ln
Length: 0.15 miles
Directions: E-W, N-S, SE-NW
Address range: 8786 to 8899
Directions: E-W, N-S, SE-NW
Address range: 8786 to 8899