East Blithedale Corridor neighborhood in Mill Valley, California (CA), 94941 detailed profile
Settings
X


Business Search - 14 Million verified businesses
Area: 0.128 square miles
Population: 729
Population density:
| East Blithedale Corridor: | 5,717 people per square mile |
| Mill Valley: | 3,010 people per square mile |

- 67988.3%White
- 384.9%Some other race
- 222.9%Two or more races
- 192.5%Asian
- 101.3%Hispanic or Latino
- 10.1%Black

Median household income in 2022:
| East Blithedale Corridor: | $200,842 |
| Mill Valley: | $202,986 |
Distribution of median household income
![Distribution of median household income]()
- 18Less than $10,000
- 38$10,000 to $19,999
- 16$20,000 to $29,999
- 22$30,000 to $39,999
- 11$40,000 to $49,999
- 25$50,000 to $59,999
- 11$60,000 to $74,999
- 35$75,000 to $99,999
- 20$100,000 to $124,999
- 17$125,000 to $149,999
- 46$150,000 to $199,999
- 142$200,000 or more

Distribution of owner-occupied house/condo value
![Distribution of owner-occupied house/condo value]()
- 10Less than $50,000
- 7$150,000 to $199,999
- 3$300,000 to $399,999
- 13$500,000 to $749,999
- 38$750,000 to $999,999
- 166$1,000,000 or more

Distribution of rent paid by renters
![Distribution of rent paid by renters]()
- 6$200 to $299
- 33$900 to $999
- 41$1,000 to $1,249
- 16$1,250 to $1,499
- 41$1,500 to $1,999
- 90$2,000 or more

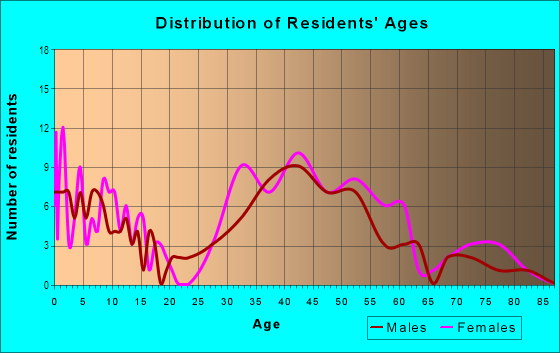
| Males: | 339 |
| Females: | 389 |
Males:
| This neighborhood: | 41.4 years |
| Whole city: | 46.4 years |
| This neighborhood: | 47.0 years |
| Whole city: | 47.3 years |
Average household size:
| East Blithedale Corridor: | 2.6 people |
| Mill Valley: | 2.5 people |
Percentage of family households:
| East Blithedale Corridor: | 55.0% |
| Mill Valley: | 47.2% |
| Here: | 57.1% |
| Mill Valley: | 56.3% |
Percentage of married-couple families with children (among all households):
| East Blithedale Corridor: | 36.4% |
| Mill Valley: | 32.4% |
Percentage of single-mother households (among all households):
| East Blithedale Corridor: | 3.2% |
| Mill Valley: | 5.6% |
Percentage of never married males 15 years old and over:
Percentage of never married females 15 years old and over:
| East Blithedale Corridor: | 10.7% |
| Mill Valley: | 14.9% |
Percentage of never married females 15 years old and over:
| East Blithedale Corridor: | 18.7% |
| city: | 13.2% |
Percentage of people that speak English not well or not at all:
| East Blithedale Corridor: | 0.3% |
| Mill Valley: | 0.6% |
Percentage of people born in this state:
Percentage of people born in another U.S. state:
Percentage of native residents but born outside the U.S.:
Percentage of foreign born residents:
| Here: | 39.4% |
| Mill Valley: | 42.0% |
Percentage of people born in another U.S. state:
| East Blithedale Corridor: | 40.4% |
| Mill Valley: | 37.9% |
Percentage of native residents but born outside the U.S.:
| Here: | 4.0% |
| city: | 3.5% |
Percentage of foreign born residents:
| Here: | 16.2% |
| Mill Valley: | 16.6% |

Owner-occupied
Renter-occupied


- Rooms in owner-occupied houses and condos in East Blithedale Corridor
- 01 room
- 42 rooms
- 63 rooms
- 94 rooms
- 545 rooms
- 446 rooms
- 257 rooms
- 248 rooms
- 349+ rooms

- Rooms in renter-occupied apartments in East Blithedale Corridor
- 71 room
- 372 rooms
- 213 rooms
- 604 rooms
- 185 rooms
- 106 rooms
- 407 rooms
- 88 rooms
- 19+ rooms
Owner-occupied
Renter-occupied

- Bedrooms in owner-occupied houses and condos in East Blithedale Corridor
- 0no bedroom
- 101 bedroom
- 302 bedrooms
- 783 bedrooms
- 544 bedrooms
- 125+ bedrooms

- Bedrooms in renter-occupied apartments in East Blithedale Corridor
- 7no bedroom
- 561 bedroom
- 512 bedrooms
- 123 bedrooms
- 414 bedrooms
- 05+ bedrooms
Average number of cars or other vehicles available in houses/condos:
Average number of cars or other vehicles available in apartments:
| This neighborhood: | 1.7 |
| Mill Valley: | 2.1 |
Average number of cars or other vehicles available in apartments:
| Here: | 1.5 |
| city: | 1.3 |
Percentage of units with a mortgage:
| East Blithedale Corridor: | 66.3% |
| Mill Valley: | 69.0% |
Average estimated value of detached houses in 2022 (77.6% of all units):
| East Blithedale Corridor: | $2,451,714 |
| California: | $988,808 |

- Year house built in East Blithedale Corridor
- 112020 or later
- 312010 to 2019
- 42000 to 2009
- 11990 to 1999
- 471980 to 1989
- 271970 to 1979
- 361960 to 1969
- 361950 to 1959
- 931940 to 1949
- 1221939 or earlier

City-data.com crime index for city in 2020 (higher means more crime):
| City: | 112.2 |
| U.S. average: | 219.5 |
Travel time to work (commute)
![Travel time to work (commute)]()
- 5Less than 5 minutes
- 425 to 9 minutes
- 2210 to 14 minutes
- 5915 to 19 minutes
- 2020 to 24 minutes
- 525 to 29 minutes
- 1730 to 34 minutes
- 435 to 39 minutes
- 840 to 44 minutes
- 3945 to 59 minutes
- 1560 to 89 minutes
- 590 or more minutes

Means of transportation to work
![Means of transportation to work]()
- 54.5%214Drove a car alone
- 5.9%23Carpooled
- 5.6%22Bus
- 3.1%12Bicycle
- 9.2%36Walked
- 0.3%1Other means
- 26.0%102Worked at home

Time leaving home to go to work
![Time leaving home to go to work]()
- 1712:00 a.m. to 4:59 a.m.
- 65:00 a.m. to 5:29 a.m.
- 165:30 a.m. to 5:59 a.m.
- 106:00 a.m. to 6:29 a.m.
- 66:30 a.m. to 6:59 a.m.
- 397:00 a.m. to 7:29 a.m.
- 317:30 a.m. to 7:59 a.m.
- 338:00 a.m. to 8:29 a.m.
- 308:30 a.m. to 8:59 a.m.
- 259:00 a.m. to 9:59 a.m.
- 1910:00 a.m. to 10:59 a.m.
- 1111:00 a.m. to 11:59 a.m.
- 712:00 p.m. to 3:59 p.m.
- 24:00 p.m. to 11:59 p.m.

Occupations of males:
- Percentage of males in management occupations (except farmers):
Here: 25.8% city: 28.2%
- Percentage of males in business and financial operations occupations:
Here: 13.8% city: 8.7%
- Percentage of males in computer and mathematical occupations:
Here: 7.0% city: 6.1%
- Percentage of males in architecture and engineering occupations:
Here: 5.0% city: 5.1%
- Percentage of males in legal occupations:
Here: 4.3% city: 5.9%
- Percentage of males in education, training, and library occupations:
Here: 1.7% city: 1.6%
- Percentage of males in arts, design, entertainment, sports, and media occupations:
Here: 9.8% city: 6.4%
- Percentage of males in healthcare practitioners and technical occupations:
Here: 3.0% city: 6.5%
- Percentage of males in service occupations:
Here: 10.3% city: 4.6%
- Percentage of males in sales and office occupations:
Here: 14.9% city: 18.4%
- Percentage of males in production occupations:
Here: 2.6% city: 2.3%
Occupations of females:
- Percentage of females in management occupations (except farmers):
Here: 20.5% city: 22.1%
- Percentage of females in business and financial operations occupations:
Here: 4.1% city: 9.4%
- Percentage of females in computer and mathematical occupations:
Here: 2.8% city: 2.2%
- Percentage of females in architecture and engineering occupations:
Here: 1.4% city: 1.5%
- Percentage of females in life, physical, and social science occupations:
Here: 7.3% city: 3.3%
- Percentage of females in community and social services occupations:
Here: 1.5% city: 2.8%
- Percentage of females in legal occupations:
Here: 9.8% city: 3.7%
- Percentage of females in education, training, and library occupations:
Here: 10.3% city: 12.8%
- Percentage of females in arts, design, entertainment, sports, and media occupations:
Here: 7.9% city: 8.3%
- Percentage of females in healthcare practitioners and technical occupations:
Here: 1.2% city: 12.4%
- Percentage of females in service occupations:
Here: 12.7% city: 7.5%
- Percentage of females in sales and office occupations:
Here: 17.3% city: 11.9%
- Percentage of females in production occupations:
Here: 2.0% city: 1.1%
- Percentage of females in transportation occupations:
Here: 1.2% city: 0.7%
Education in this neighborhood (subdivision or community):
- Percentage of people 3 years and older in K-12 schools:
East Blithedale Corridor: 25.0% Mill Valley: 18.4%
- Percentage of people 3 years and older in undergraduate colleges:
East Blithedale Corridor: 4.3% Mill Valley: 2.6%
- Percentage of people 3 years and older in grad. or professional schools:
East Blithedale Corridor: 8.6% Mill Valley: 1.8%
- Percentage of students K-12 enrolled in private schools:
East Blithedale Corridor: 53.1% Mill Valley: 32.0%
Percentage of population below poverty level:
| East Blithedale Corridor: | 4.1% |
| Mill Valley: | 4.6% |
Median year owner moved in (as recorded in 2022):
| East Blithedale Corridor: | 2003 |
| Mill Valley: | 2003 |
Percentage of married-couple families with both working:
| East Blithedale Corridor: | 107.2% |
| Mill Valley: | 61.5% |

- 73.8%Utility gas
- 20.0%Electricity
- 2.5%No fuel used
- 1.9%Solar energy
- 1.7%Bottled, tank, or LP gas
Roads and streets:
E Blithedale Ave
Length: 0.93 miles
Directions: E-W, N-S, SE-NW
Address range: 280 to 629
Directions: E-W, N-S, SE-NW
Address range: 280 to 629
Elm Ave
Length: 0.30 miles
Directions: N-S, SE-NW, SW-NE
Address range: 2 to 299
Directions: N-S, SE-NW, SW-NE
Address range: 2 to 299
Matilda Ave
Length: 0.24 miles
Direction: SE-NW
Address range: 1 to 99
Direction: SE-NW
Address range: 1 to 99
Nelson Ave
Length: 0.17 miles
Directions: N-S, SW-NE
Address range: 33 to 199
Directions: N-S, SW-NE
Address range: 33 to 199
Locust Ave
Length: 0.17 miles
Directions: E-W, SW-NE
Address range: 138 to 199
Directions: E-W, SW-NE
Address range: 138 to 199
Amicita Ave
Length: 0.16 miles
Directions: E-W, SW-NE
Address range: 70 to 299
Directions: E-W, SW-NE
Address range: 70 to 299
Sidney St
Length: 0.15 miles
Directions: E-W, N-S, SW-NE
Address range: 1 to 99
Directions: E-W, N-S, SW-NE
Address range: 1 to 99
Juanita Ave
Length: 0.14 miles
Direction: SE-NW
Address range: 1 to 99
Direction: SE-NW
Address range: 1 to 99
Alto Ave
Length: 0.13 miles
Direction: SE-NW
Direction: SE-NW
Alvarado Ave
Length: 0.12 miles
Directions: N-S, SE-NW
Address range: 1 to 59
Directions: N-S, SE-NW
Address range: 1 to 59
Hilarita Ave
Length: 0.11 miles
Directions: E-W, SW-NE
Address range: 45 to 99
Directions: E-W, SW-NE
Address range: 45 to 99
Altamont Ave
Length: 0.09 miles
Direction: SE-NW
Address range: 1 to 399
Direction: SE-NW
Address range: 1 to 399
East Dr
Length: 0.08 miles
Directions: N-S, SW-NE
Address range: 1 to 99
Directions: N-S, SW-NE
Address range: 1 to 99
Alta Vista Ave
Length: 0.08 miles
Direction: E-W
Address range: 1 to 31
Direction: E-W
Address range: 1 to 31
Euterpe St
Length: 0.08 miles
Directions: E-W, SE-NW
Address range: 1 to 99
Directions: E-W, SE-NW
Address range: 1 to 99
E Manor Dr
Length: 0.07 miles
Direction: E-W
Address range: 1 to 13
Direction: E-W
Address range: 1 to 13
Carmelita Ave
Length: 0.07 miles
Direction: N-S
Address range: 1 to 33
Direction: N-S
Address range: 1 to 33
Manor Ter
Length: 0.06 miles
Directions: E-W, N-S, SE-NW
Address range: 1 to 99
Directions: E-W, N-S, SE-NW
Address range: 1 to 99
Thalia St
Length: 0.05 miles
Direction: N-S
Address range: 1 to 25
Direction: N-S
Address range: 1 to 25
Mesa Ave
Length: 0.05 miles
Direction: SW-NE
Address range: 1 to 20
Direction: SW-NE
Address range: 1 to 20
Cam Alto
Length: 0.03 miles
Directions: N-S, SW-NE
Address range: 177 to 199
Directions: N-S, SW-NE
Address range: 177 to 199
Ryan Ave
Length: 0.02 miles
Direction: N-S
Address range: 116 to 199
Direction: N-S
Address range: 116 to 199