East Main Street Addition neighborhood in Grand Junction, Colorado (CO), 81501 detailed profile
Settings
X


Business Search - 14 Million verified businesses
Area: 0.076 square miles
Population: 868
Population density:
| East Main Street Addition: | 11,478 people per square mile |
| Grand Junction: | 2,209 people per square mile |

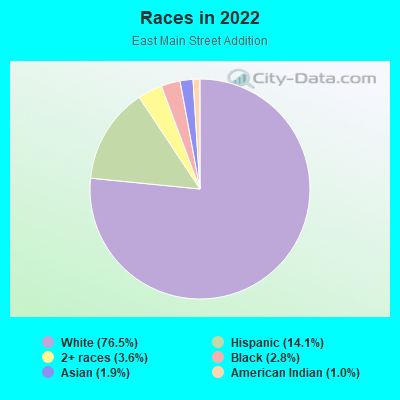
- 67776.5%White
- 12514.1%Hispanic or Latino
- 323.6%Two or more races
- 252.8%Black
- 171.9%Asian
- 91.0%American Indian
Median household income in 2022:
| East Main Street Addition: | $62,946 |
| Grand Junction: | $61,458 |
Distribution of median household income
![Distribution of median household income]()
- 19Less than $10,000
- 36$10,000 to $19,999
- 32$20,000 to $29,999
- 28$30,000 to $39,999
- 52$40,000 to $49,999
- 62$50,000 to $59,999
- 49$60,000 to $74,999
- 61$75,000 to $99,999
- 14$100,000 to $124,999
- 21$125,000 to $149,999
- 26$150,000 to $199,999
- 33$200,000 or more

Distribution of owner-occupied house/condo value
![Distribution of owner-occupied house/condo value]()
- 42Less than $50,000
- 1$50,000 to $99,999
- 11$100,000 to $149,999
- 22$150,000 to $199,999
- 80$200,000 to $249,999
- 21$250,000 to $299,999
- 70$300,000 to $399,999
- 39$400,000 to $499,999
- 5$750,000 to $999,999
- 2$1,000,000 or more

Distribution of rent paid by renters
![Distribution of rent paid by renters]()
- 17$100 to $199
- 14$200 to $299
- 3$300 to $399
- 7$400 to $499
- 6$500 to $599
- 7$600 to $699
- 66$700 to $799
- 16$800 to $899
- 8$900 to $999
- 13$1,000 to $1,249
- 24$1,250 to $1,499
- 29$1,500 to $1,999

Median rent in 2022:
| East Main Street Addition: | $797 |
| Grand Junction: | $1,037 |
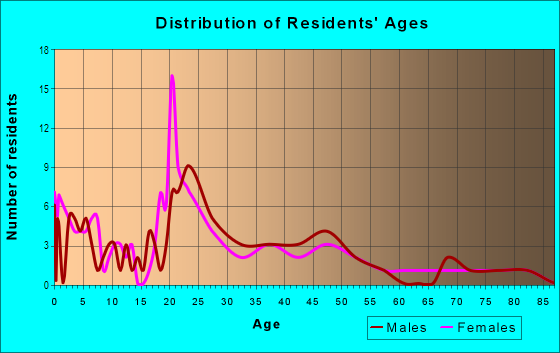
| Males: | 482 |
| Females: | 386 |
Males:
| This neighborhood: | 34.9 years |
| Whole city: | 35.2 years |
| This neighborhood: | 34.6 years |
| Whole city: | 41.4 years |
Average household size:
| East Main Street Addition: | 2.3 people |
| Grand Junction: | 2.3 people |
Percentage of family households:
| East Main Street Addition: | 39.6% |
| Grand Junction: | 41.5% |
| Here: | 32.8% |
| Grand Junction: | 44.5% |
Percentage of married-couple families with children (among all households):
| East Main Street Addition: | 30.5% |
| Grand Junction: | 30.4% |
Percentage of single-mother households (among all households):
| East Main Street Addition: | 15.0% |
| Grand Junction: | 7.7% |
Percentage of never married males 15 years old and over:
Percentage of never married females 15 years old and over:
| East Main Street Addition: | 28.9% |
| Grand Junction: | 20.7% |
Percentage of never married females 15 years old and over:
| East Main Street Addition: | 15.9% |
| city: | 15.0% |
Percentage of people that speak English not well or not at all:
| East Main Street Addition: | 0.4% |
| Grand Junction: | 0.8% |
Percentage of people born in this state:
Percentage of people born in another U.S. state:
Percentage of native residents but born outside the U.S.:
Percentage of foreign born residents:
| Here: | 52.8% |
| Grand Junction: | 47.4% |
Percentage of people born in another U.S. state:
| East Main Street Addition: | 39.4% |
| Grand Junction: | 47.0% |
Percentage of native residents but born outside the U.S.:
| Here: | 1.0% |
| city: | 1.0% |
Percentage of foreign born residents:
| Here: | 6.7% |
| Grand Junction: | 4.7% |
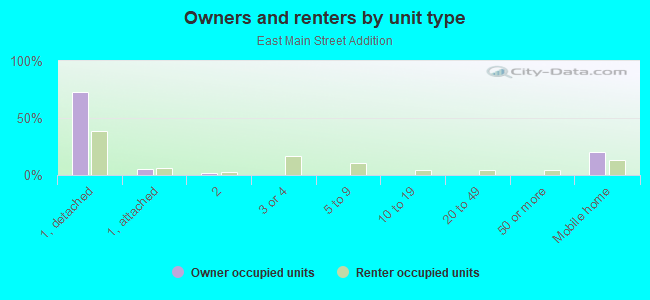
Owner-occupied
Renter-occupied

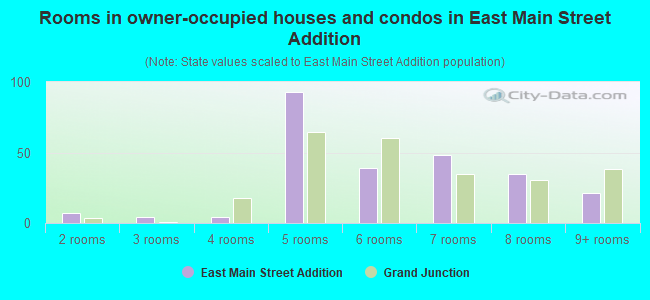
- Rooms in owner-occupied houses and condos in East Main Street Addition
- 01 room
- 72 rooms
- 43 rooms
- 44 rooms
- 935 rooms
- 396 rooms
- 487 rooms
- 358 rooms
- 219+ rooms
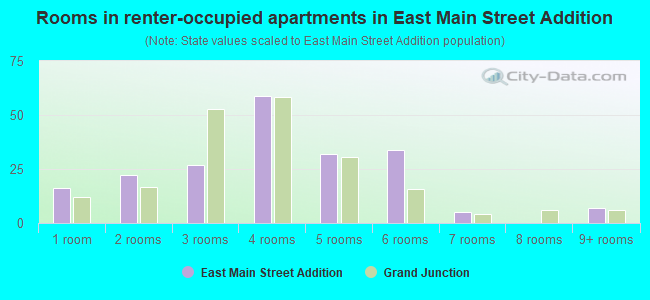
- Rooms in renter-occupied apartments in East Main Street Addition
- 161 room
- 222 rooms
- 273 rooms
- 594 rooms
- 325 rooms
- 346 rooms
- 57 rooms
- 08 rooms
- 79+ rooms
Owner-occupied
Renter-occupied
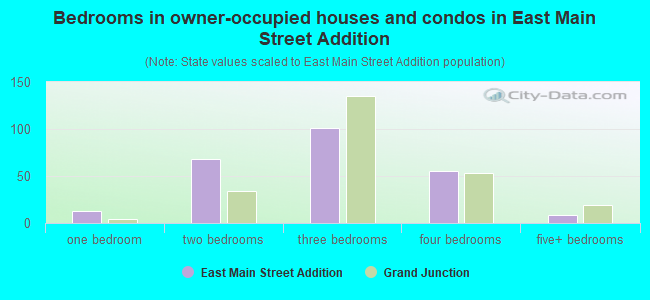
- Bedrooms in owner-occupied houses and condos in East Main Street Addition
- 0no bedroom
- 131 bedroom
- 682 bedrooms
- 1013 bedrooms
- 554 bedrooms
- 85+ bedrooms
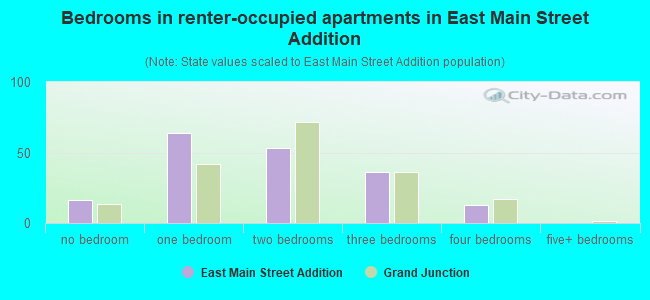
- Bedrooms in renter-occupied apartments in East Main Street Addition
- 16no bedroom
- 641 bedroom
- 532 bedrooms
- 363 bedrooms
- 134 bedrooms
- 05+ bedrooms
Average number of cars or other vehicles available in houses/condos:
Average number of cars or other vehicles available in apartments:
| This neighborhood: | 2.1 |
| Grand Junction: | 2.2 |
Average number of cars or other vehicles available in apartments:
| Here: | 1.5 |
| city: | 1.3 |
Percentage of units with a mortgage:
| East Main Street Addition: | 68.8% |
| Grand Junction: | 65.2% |
Average estimated value of detached houses in 2022 (78.3% of all units):
| East Main Street Addition: | $246,986 |
| Grand Junction: | $357,130 |
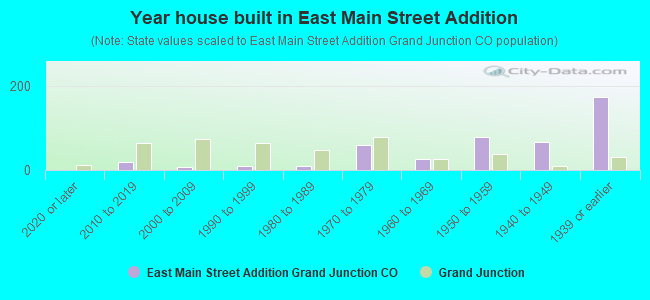
- Year house built in East Main Street Addition
- 02020 or later
- 182010 to 2019
- 72000 to 2009
- 91990 to 1999
- 101980 to 1989
- 581970 to 1979
- 261960 to 1969
- 771950 to 1959
- 671940 to 1949
- 1721939 or earlier
City-data.com crime index for city in 2020 (higher means more crime):
| City: | 384.0 |
| U.S. average: | 219.5 |
Travel time to work (commute)
![Travel time to work (commute)]()
- 10Less than 5 minutes
- 925 to 9 minutes
- 15410 to 14 minutes
- 11115 to 19 minutes
- 5320 to 24 minutes
- 125 to 29 minutes
- 1430 to 34 minutes
- 140 to 44 minutes
- 1945 to 59 minutes
- 260 to 89 minutes
- 290 or more minutes

Means of transportation to work
![Means of transportation to work]()
- 60.1%304Drove a car alone
- 8.9%45Carpooled
- 0.8%4Bus
- 11.1%56Bicycle
- 3.8%19Walked
- 2.2%11Other means
- 13.2%67Worked at home

Time leaving home to go to work
![Time leaving home to go to work]()
- 1912:00 a.m. to 4:59 a.m.
- 85:00 a.m. to 5:29 a.m.
- 205:30 a.m. to 5:59 a.m.
- 106:00 a.m. to 6:29 a.m.
- 396:30 a.m. to 6:59 a.m.
- 627:00 a.m. to 7:29 a.m.
- 777:30 a.m. to 7:59 a.m.
- 258:00 a.m. to 8:29 a.m.
- 688:30 a.m. to 8:59 a.m.
- 259:00 a.m. to 9:59 a.m.
- 2410:00 a.m. to 10:59 a.m.
- 1511:00 a.m. to 11:59 a.m.
- 2212:00 p.m. to 3:59 p.m.
- 344:00 p.m. to 11:59 p.m.

Occupations of males:
- Percentage of males in management occupations (except farmers):
Here: 13.0% city: 11.9%
- Percentage of males in business and financial operations occupations:
Here: 4.2% city: 2.7%
- Percentage of males in computer and mathematical occupations:
Here: 8.4% city: 2.6%
- Percentage of males in architecture and engineering occupations:
Here: 2.0% city: 3.0%
- Percentage of males in community and social services occupations:
Here: 1.7% city: 2.6%
- Percentage of males in education, training, and library occupations:
Here: 4.2% city: 3.4%
- Percentage of males in arts, design, entertainment, sports, and media occupations:
Here: 7.1% city: 2.8%
- Percentage of males in healthcare practitioners and technical occupations:
Here: 1.2% city: 4.1%
- Percentage of males in service occupations:
Here: 16.0% city: 15.2%
- Percentage of males in sales and office occupations:
Here: 18.1% city: 14.3%
- Percentage of males in construction, extraction, and maintenance occupations:
Here: 2.1% city: 10.5%
- Percentage of males in production occupations:
Here: 2.6% city: 6.0%
- Percentage of males in transportation occupations:
Here: 5.7% city: 7.4%
- Percentage of males in material moving occupations:
Here: 7.1% city: 3.8%
Occupations of females:
- Percentage of females in management occupations (except farmers):
Here: 1.7% city: 9.3%
- Percentage of females in business and financial operations occupations:
Here: 8.2% city: 4.7%
- Percentage of females in life, physical, and social science occupations:
Here: 15.2% city: 1.5%
- Percentage of females in education, training, and library occupations:
Here: 15.0% city: 9.5%
- Percentage of females in arts, design, entertainment, sports, and media occupations:
Here: 2.1% city: 1.5%
- Percentage of females in healthcare practitioners and technical occupations:
Here: 11.6% city: 13.3%
- Percentage of females in service occupations:
Here: 25.4% city: 20.7%
- Percentage of females in sales and office occupations:
Here: 15.8% city: 28.2%
- Percentage of females in farming, fishing, and forestry occupations:
Here: 1.4% city: 0.2%
- Percentage of females in construction, extraction, and maintenance occupations:
Here: 1.4% city: 0.5%
- Percentage of females in production occupations:
Here: 1.2% city: 1.9%
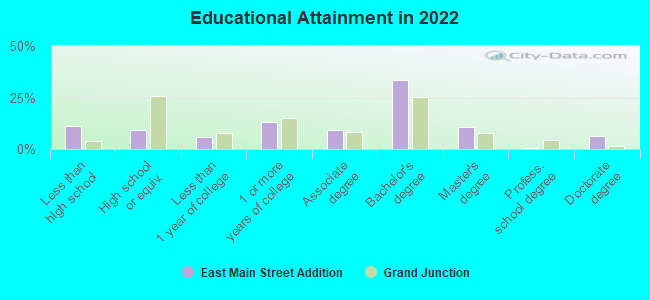
Education in this neighborhood (subdivision or community):
- Percentage of people 3 years and older in K-12 schools:
East Main Street Addition: 16.2% Grand Junction: 13.5%
- Percentage of people 3 years and older in undergraduate colleges:
East Main Street Addition: 10.4% Grand Junction: 8.2%
- Percentage of people 3 years and older in grad. or professional schools:
East Main Street Addition: 0.9% Grand Junction: 0.8%
- Percentage of students K-12 enrolled in private schools:
East Main Street Addition: 34.1% Grand Junction: 12.8%
Percentage of population below poverty level:
| East Main Street Addition: | 14.0% |
| Grand Junction: | 14.1% |
Median year owner moved in (as recorded in 2022):
Median year renter moved in (as recorded in 2022):
| East Main Street Addition: | 2012 |
| Grand Junction: | 2013 |
Median year renter moved in (as recorded in 2022):
| East Main Street Addition: | 2018 |
| Grand Junction: | 2021 |
Percentage of married-couple families with both working:
| East Main Street Addition: | 79.0% |
| Grand Junction: | 62.1% |
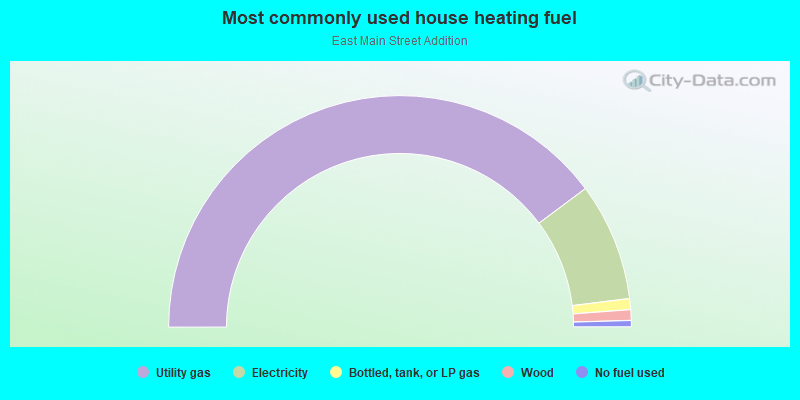
- 79.6%Utility gas
- 16.5%Electricity
- 1.5%Bottled, tank, or LP gas
- 1.5%Wood
- 0.9%No fuel used
Roads and streets:
Rood Ave
Length: 0.32 miles
Direction: E-W
Address range: 1700 to 2099
Direction: E-W
Address range: 1700 to 2099
White Ave
Length: 0.32 miles
Direction: E-W
Address range: 1700 to 2099
Direction: E-W
Address range: 1700 to 2099
Main St
Length: 0.16 miles
Direction: E-W
Address range: 1700 to 1899
Direction: E-W
Address range: 1700 to 1899
N 17th St
Length: 0.14 miles
Direction: N-S
Address range: 100 to 299
Direction: N-S
Address range: 100 to 299
21st St
Length: 0.07 miles
Direction: N-S
Address range: 200 to 299
Direction: N-S
Address range: 200 to 299
N 19th St
Length: 0.07 miles
Direction: N-S
Address range: 200 to 299
Direction: N-S
Address range: 200 to 299
S 17th St
Length: 0.04 miles
Direction: N-S
Direction: N-S