East Market St. A neighborhood in Greensboro, North Carolina (NC), 27401, 27406 detailed profile
Settings
X


Business Search - 14 Million verified businesses
Area: 0.121 square miles
Population: 1,239
Population density:
| East Market St. A: | 10,214 people per square mile |
| Greensboro: | 2,876 people per square mile |

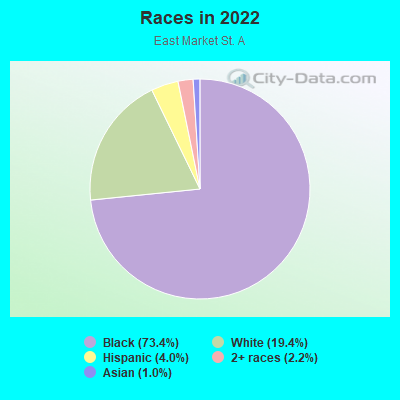
- 90673.4%Black
- 24019.4%White
- 494.0%Hispanic or Latino
- 272.2%Two or more races
- 121.0%Asian
- 10.08%Some other race
Median household income in 2022:
| East Market St. A: | $28,819 |
| Greensboro: | $55,120 |
Distribution of median household income
![Distribution of median household income]()
- 14Less than $10,000
- 10$10,000 to $19,999
- 34$20,000 to $29,999
- 18$30,000 to $39,999
- 12$40,000 to $49,999
- 6$50,000 to $59,999
- 4$60,000 to $74,999
- 6$75,000 to $99,999
- 5$100,000 to $124,999
- 5$125,000 to $149,999
- 2$150,000 to $199,999

Distribution of owner-occupied house/condo value
![Distribution of owner-occupied house/condo value]()
- 3Less than $50,000
- 4$50,000 to $99,999
- 9$100,000 to $149,999
- 6$150,000 to $199,999
- 8$300,000 to $399,999

Distribution of rent paid by renters
![Distribution of rent paid by renters]()
- 8$100 to $199
- 3$300 to $399
- 3$400 to $499
- 39$500 to $599
- 28$600 to $699
- 10$700 to $799
- 4$800 to $899
- 3$1,000 to $1,249
- 2$1,250 to $1,499

Median rent in 2022:
| East Market St. A: | $595 |
| Greensboro: | $915 |
| Males: | 525 |
| Females: | 713 |
Males:
| This neighborhood: | 19.5 years |
| Whole city: | 32.4 years |
| This neighborhood: | 19.4 years |
| Whole city: | 35.3 years |
Average household size:
| East Market St. A: | 22.0 people |
| Greensboro: | 2.3 people |
Percentage of family households:
| East Market St. A: | 38.3% |
| Greensboro: | 43.6% |
| Here: | 12.8% |
| Greensboro: | 36.2% |
Percentage of married-couple families with children (among all households):
| East Market St. A: | 2.9% |
| Greensboro: | 22.4% |
Percentage of single-mother households (among all households):
| East Market St. A: | 5.9% |
| Greensboro: | 15.5% |
Percentage of never married males 15 years old and over:
Percentage of never married females 15 years old and over:
| East Market St. A: | 39.7% |
| Greensboro: | 20.8% |
Percentage of never married females 15 years old and over:
| East Market St. A: | 53.6% |
| city: | 23.9% |
Percentage of people that speak English not well or not at all:
| East Market St. A: | 2.0% |
| Greensboro: | 2.7% |
Percentage of people born in this state:
Percentage of people born in another U.S. state:
Percentage of native residents but born outside the U.S.:
Percentage of foreign born residents:
| Here: | 59.1% |
| Greensboro: | 52.7% |
Percentage of people born in another U.S. state:
| East Market St. A: | 32.1% |
| Greensboro: | 33.7% |
Percentage of native residents but born outside the U.S.:
| Here: | 0.2% |
| city: | 1.6% |
Percentage of foreign born residents:
| Here: | 8.6% |
| Greensboro: | 12.0% |
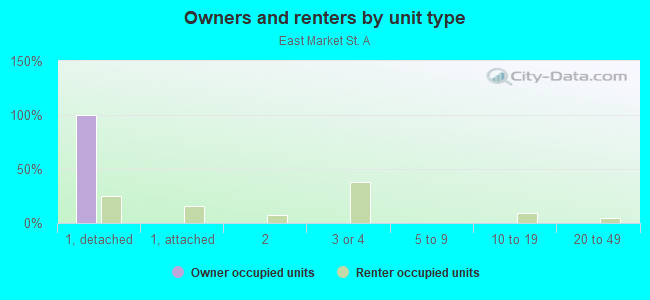
Owner-occupied
Renter-occupied

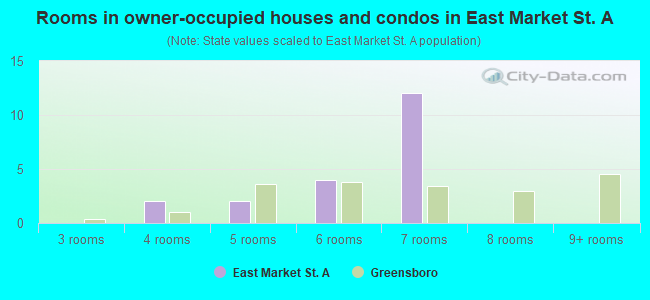
- Rooms in owner-occupied houses and condos in East Market St. A
- 01 room
- 02 rooms
- 03 rooms
- 24 rooms
- 25 rooms
- 46 rooms
- 127 rooms
- 08 rooms
- 09+ rooms
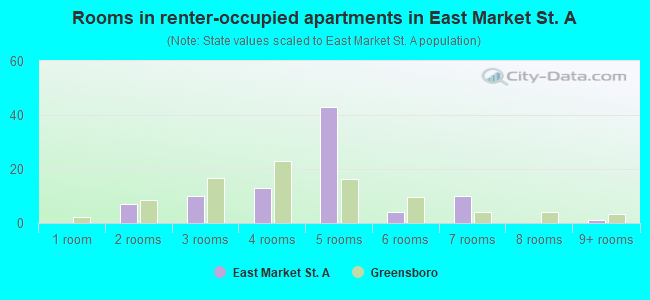
- Rooms in renter-occupied apartments in East Market St. A
- 01 room
- 72 rooms
- 103 rooms
- 134 rooms
- 435 rooms
- 46 rooms
- 107 rooms
- 08 rooms
- 19+ rooms
Owner-occupied
Renter-occupied
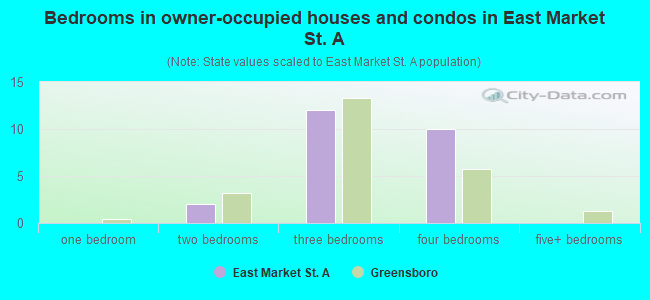
- Bedrooms in owner-occupied houses and condos in East Market St. A
- 0no bedroom
- 01 bedroom
- 22 bedrooms
- 123 bedrooms
- 104 bedrooms
- 05+ bedrooms
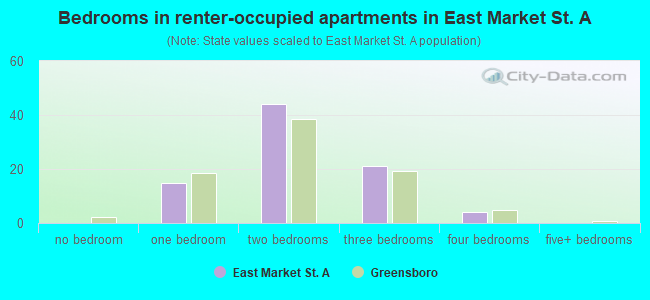
- Bedrooms in renter-occupied apartments in East Market St. A
- 0no bedroom
- 151 bedroom
- 442 bedrooms
- 213 bedrooms
- 44 bedrooms
- 05+ bedrooms
Average number of cars or other vehicles available in houses/condos:
Average number of cars or other vehicles available in apartments:
| This neighborhood: | 1.5 |
| Greensboro: | 2.0 |
Average number of cars or other vehicles available in apartments:
| Here: | 1.1 |
| city: | 1.4 |
Percentage of units with a mortgage:
| East Market St. A: | 9.5% |
| Greensboro: | 67.4% |
Average estimated value of detached houses in 2022 (51.3% of all units):
| East Market St. A: | $192,260 |
| Greensboro: | $297,193 |
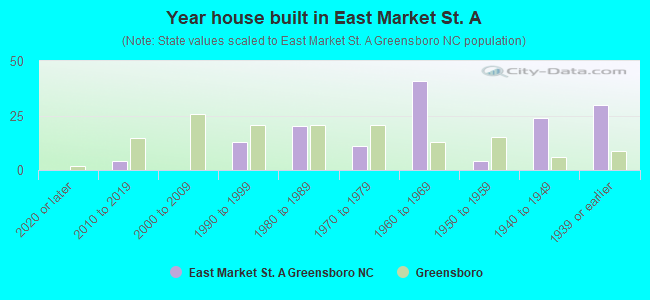
- Year house built in East Market St. A
- 02020 or later
- 42010 to 2019
- 02000 to 2009
- 131990 to 1999
- 201980 to 1989
- 111970 to 1979
- 411960 to 1969
- 41950 to 1959
- 241940 to 1949
- 301939 or earlier
City-data.com crime index for city in 2020 (higher means more crime):
| City: | 435.6 |
| U.S. average: | 219.5 |
Travel time to work (commute)
![Travel time to work (commute)]()
- 3Less than 5 minutes
- 475 to 9 minutes
- 2810 to 14 minutes
- 3715 to 19 minutes
- 1720 to 24 minutes
- 430 to 34 minutes
- 845 to 59 minutes

Means of transportation to work
![Means of transportation to work]()
- 43.3%129Drove a car alone
- 10.1%30Carpooled
- 10.8%32Bus
- 1.3%4Taxi
- 1.3%4Bicycle
- 23.2%69Walked
- 4.0%12Other means
- 4.7%14Worked at home

Time leaving home to go to work
![Time leaving home to go to work]()
- 612:00 a.m. to 4:59 a.m.
- 135:00 a.m. to 5:29 a.m.
- 56:00 a.m. to 6:29 a.m.
- 36:30 a.m. to 6:59 a.m.
- 127:00 a.m. to 7:29 a.m.
- 107:30 a.m. to 7:59 a.m.
- 98:00 a.m. to 8:29 a.m.
- 58:30 a.m. to 8:59 a.m.
- 69:00 a.m. to 9:59 a.m.
- 610:00 a.m. to 10:59 a.m.
- 411:00 a.m. to 11:59 a.m.
- 3312:00 p.m. to 3:59 p.m.
- 224:00 p.m. to 11:59 p.m.

Occupations of males:
- Percentage of males in business and financial operations occupations:
Here: 3.1% city: 4.8%
- Percentage of males in computer and mathematical occupations:
Here: 2.0% city: 3.9%
- Percentage of males in architecture and engineering occupations:
Here: 2.0% city: 3.1%
- Percentage of males in community and social services occupations:
Here: 1.7% city: 1.4%
- Percentage of males in legal occupations:
Here: 1.4% city: 0.8%
- Percentage of males in education, training, and library occupations:
Here: 2.9% city: 4.0%
- Percentage of males in arts, design, entertainment, sports, and media occupations:
Here: 1.1% city: 1.5%
- Percentage of males in service occupations:
Here: 28.9% city: 14.3%
- Percentage of males in sales and office occupations:
Here: 30.9% city: 17.1%
- Percentage of males in construction, extraction, and maintenance occupations:
Here: 3.7% city: 6.0%
- Percentage of males in production occupations:
Here: 2.3% city: 7.5%
- Percentage of males in transportation occupations:
Here: 4.6% city: 6.8%
- Percentage of males in material moving occupations:
Here: 17.7% city: 9.6%
Occupations of females:
- Percentage of females in life, physical, and social science occupations:
Here: 2.6% city: 1.0%
- Percentage of females in education, training, and library occupations:
Here: 22.3% city: 10.3%
- Percentage of females in service occupations:
Here: 32.5% city: 19.4%
- Percentage of females in sales and office occupations:
Here: 38.0% city: 29.0%
- Percentage of females in production occupations:
Here: 2.5% city: 5.2%
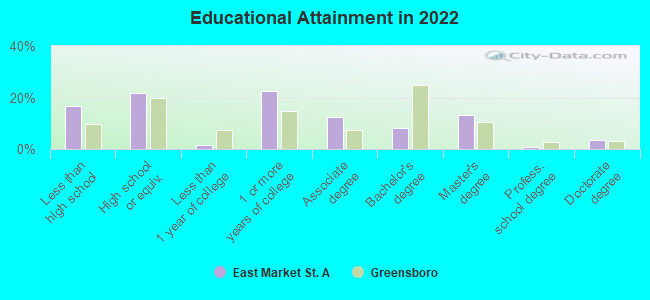
Education in this neighborhood (subdivision or community):
- Percentage of people 3 years and older in K-12 schools:
East Market St. A: 3.5% Greensboro: 17.6%
- Percentage of people 3 years and older in undergraduate colleges:
East Market St. A: 85.8% Greensboro: 11.2%
- Percentage of people 3 years and older in grad. or professional schools:
East Market St. A: 1.1% Greensboro: 2.6%
- Percentage of students K-12 enrolled in private schools:
East Market St. A: 0.0% Greensboro: 13.3%
Percentage of population below poverty level:
| East Market St. A: | 50.9% |
| Greensboro: | 21.9% |
Median year owner moved in (as recorded in 2022):
Median year renter moved in (as recorded in 2022):
| East Market St. A: | 1989 |
| Greensboro: | 2010 |
Median year renter moved in (as recorded in 2022):
| East Market St. A: | 2014 |
| Greensboro: | 2020 |
Percentage of married-couple families with both working:
| East Market St. A: | 0.0% |
| Greensboro: | 70.9% |
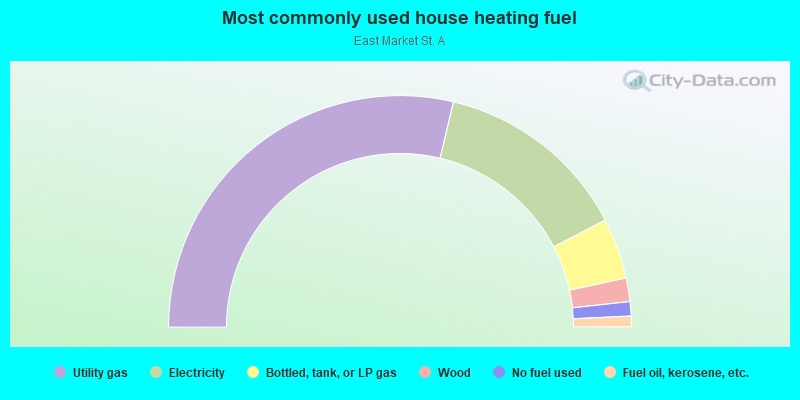
- 57.5%Utility gas
- 27.3%Electricity
- 8.5%Bottled, tank, or LP gas
- 3.3%Wood
- 2.0%No fuel used
- 1.5%Fuel oil, kerosene, etc.
Roads and streets:
E Market St
Length: 0.60 miles
Directions: E-W, N-S, SE-NW, SW-NE
Address range: 544 to 935
Directions: E-W, N-S, SE-NW, SW-NE
Address range: 544 to 935
S Murrow Blvd
Length: 0.39 miles
Direction: N-S
Address range: 101 to 299
Direction: N-S
Address range: 101 to 299
E Washington St
Length: 0.34 miles
Directions: E-W, N-S, SE-NW, SW-NE
Address range: 400 to 899
Directions: E-W, N-S, SE-NW, SW-NE
Address range: 400 to 899
Medley St
Length: 0.17 miles
Directions: E-W, N-S, SW-NE
Address range: 825 to 899
Directions: E-W, N-S, SW-NE
Address range: 825 to 899
S Lyndon St
Length: 0.15 miles
Direction: N-S
Address range: 100 to 299
Direction: N-S
Address range: 100 to 299
Pastor Anderson Dr (Pastor Anderson Way)
Length: 0.12 miles
Direction: N-S
Address range: 100 to 177
Direction: N-S
Address range: 100 to 177
E Friendly Ave
Length: 0.12 miles
Directions: E-W, SE-NW
Address range: 588 to 693
Directions: E-W, SE-NW
Address range: 588 to 693
S Dudley St
Length: 0.09 miles
Directions: N-S, SE-NW
Address range: 100 to 199
Directions: N-S, SE-NW
Address range: 100 to 199
Railroad features:
Southern Rlwy
Length: 0.52 miles
Directions: E-W, SE-NW
Directions: E-W, SE-NW
Norfolk Southern Rlwy
Length: 0.33 miles
Directions: E-W, N-S, SW-NE
Directions: E-W, N-S, SW-NE