East Village neighborhood in San Diego, California (CA), 92101 detailed profile
Settings
X


Business Search - 14 Million verified businesses
Area: 0.540 square miles
Population: 5,356
Population density:
| East Village: | 9,915 people per square mile |
| San Diego: | 4,258 people per square mile |

- 3,24659.1%Hispanic or Latino
- 1,55428.3%White
- 2604.7%Black
- 1132.1%Some other race
- 1112.0%Native Hawaiian and Other
Pacific Islander - 1112.0%Two or more races
- 951.7%Asian

Median household income in 2022:
| East Village: | $66,626 |
| San Diego: | $100,010 |
Distribution of median household income
![Distribution of median household income]()
- 288Less than $10,000
- 183$10,000 to $19,999
- 186$20,000 to $29,999
- 231$30,000 to $39,999
- 295$40,000 to $49,999
- 201$50,000 to $59,999
- 746$60,000 to $74,999
- 289$75,000 to $99,999
- 156$100,000 to $124,999
- 245$125,000 to $149,999
- 122$150,000 to $199,999
- 183$200,000 or more

Distribution of owner-occupied house/condo value
![Distribution of owner-occupied house/condo value]()
- 52$50,000 to $99,999
- 58$250,000 to $299,999
- 104$400,000 to $499,999
- 303$500,000 to $749,999
- 114$750,000 to $999,999
- 137$1,000,000 or more

Distribution of rent paid by renters
![Distribution of rent paid by renters]()
- 45Less than $100
- 43$500 to $599
- 113$600 to $699
- 105$700 to $799
- 161$800 to $899
- 170$900 to $999
- 668$1,000 to $1,249
- 151$1,250 to $1,499
- 359$1,500 to $1,999
- 641$2,000 or more

Median rent in 2022:
| East Village: | $1,443 |
| San Diego: | $1,971 |
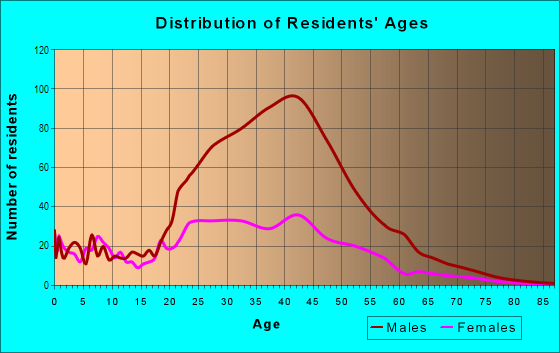
| Males: | 2,926 |
| Females: | 2,430 |
Males:
| This neighborhood: | 37.7 years |
| Whole city: | 35.4 years |
| This neighborhood: | 43.2 years |
| Whole city: | 37.2 years |
Average household size:
| East Village: | 2.2 people |
| San Diego: | 2.5 people |
Percentage of family households:
| East Village: | 27.2% |
| San Diego: | 41.7% |
| Here: | 17.5% |
| San Diego: | 43.2% |
Percentage of married-couple families with children (among all households):
| East Village: | 27.8% |
| San Diego: | 27.8% |
Percentage of single-mother households (among all households):
| East Village: | 21.2% |
| San Diego: | 7.9% |
Percentage of never married males 15 years old and over:
Percentage of never married females 15 years old and over:
| East Village: | 38.8% |
| San Diego: | 23.4% |
Percentage of never married females 15 years old and over:
| East Village: | 18.9% |
| city: | 18.8% |
Percentage of people that speak English not well or not at all:
| East Village: | 2.7% |
| San Diego: | 5.9% |
Percentage of people born in this state:
Percentage of people born in another U.S. state:
Percentage of native residents but born outside the U.S.:
Percentage of foreign born residents:
| Here: | 43.3% |
| San Diego: | 48.1% |
Percentage of people born in another U.S. state:
| East Village: | 23.3% |
| San Diego: | 24.9% |
Percentage of native residents but born outside the U.S.:
| Here: | 10.9% |
| city: | 2.4% |
Percentage of foreign born residents:
| Here: | 22.6% |
| San Diego: | 24.6% |

Owner-occupied
Renter-occupied


- Rooms in owner-occupied houses and condos in East Village
- 01 room
- 482 rooms
- 933 rooms
- 984 rooms
- 1505 rooms
- 716 rooms
- 647 rooms
- 388 rooms
- 1059+ rooms

- Rooms in renter-occupied apartments in East Village
- 2131 room
- 1132 rooms
- 7973 rooms
- 6214 rooms
- 1255 rooms
- 3266 rooms
- 487 rooms
- 298 rooms
- 539+ rooms
Owner-occupied
Renter-occupied

- Bedrooms in owner-occupied houses and condos in East Village
- 0no bedroom
- 631 bedroom
- 882 bedrooms
- 3063 bedrooms
- 504 bedrooms
- 255+ bedrooms

- Bedrooms in renter-occupied apartments in East Village
- 194no bedroom
- 1,0891 bedroom
- 4882 bedrooms
- 2163 bedrooms
- 1644 bedrooms
- 325+ bedrooms
Average number of cars or other vehicles available in houses/condos:
Average number of cars or other vehicles available in apartments:
| This neighborhood: | 2.2 |
| San Diego: | 2.1 |
Average number of cars or other vehicles available in apartments:
| Here: | 1.5 |
| city: | 1.6 |
Percentage of units with a mortgage:
| East Village: | 68.8% |
| San Diego: | 69.2% |

- Year house built in East Village
- 02020 or later
- 312010 to 2019
- 1342000 to 2009
- 2741990 to 1999
- 1981980 to 1989
- 1071970 to 1979
- 1181960 to 1969
- 911950 to 1959
- 1831940 to 1949
- 1,9031939 or earlier

City-data.com crime index for city in 2020 (higher means more crime):
| City: | 197.8 |
| U.S. average: | 219.5 |
Travel time to work (commute)
![Travel time to work (commute)]()
- 106Less than 5 minutes
- 6245 to 9 minutes
- 71510 to 14 minutes
- 1,01815 to 19 minutes
- 54720 to 24 minutes
- 14025 to 29 minutes
- 43130 to 34 minutes
- 2135 to 39 minutes
- 7440 to 44 minutes
- 19045 to 59 minutes
- 33660 to 89 minutes
- 8890 or more minutes

Means of transportation to work
![Means of transportation to work]()
- 71.8%2,861Drove a car alone
- 8.0%320Carpooled
- 8.4%333Bus
- 4.8%192Taxi
- 2.8%113Bicycle
- 2.4%96Walked
- 2.8%113Other means
- 4.6%184Worked at home

Time leaving home to go to work
![Time leaving home to go to work]()
- 23312:00 a.m. to 4:59 a.m.
- 1245:00 a.m. to 5:29 a.m.
- 1485:30 a.m. to 5:59 a.m.
- 6326:00 a.m. to 6:29 a.m.
- 3736:30 a.m. to 6:59 a.m.
- 5227:00 a.m. to 7:29 a.m.
- 2407:30 a.m. to 7:59 a.m.
- 3478:00 a.m. to 8:29 a.m.
- 3308:30 a.m. to 8:59 a.m.
- 4029:00 a.m. to 9:59 a.m.
- 21710:00 a.m. to 10:59 a.m.
- 5411:00 a.m. to 11:59 a.m.
- 36612:00 p.m. to 3:59 p.m.
- 4464:00 p.m. to 11:59 p.m.

Occupations of males:
- Percentage of males in management occupations (except farmers):
Here: 11.0% city: 12.7%
- Percentage of males in business and financial operations occupations:
Here: 1.6% city: 6.6%
- Percentage of males in computer and mathematical occupations:
Here: 1.8% city: 8.8%
- Percentage of males in architecture and engineering occupations:
Here: 2.8% city: 6.5%
- Percentage of males in education, training, and library occupations:
Here: 2.2% city: 3.8%
- Percentage of males in arts, design, entertainment, sports, and media occupations:
Here: 1.6% city: 2.9%
- Percentage of males in healthcare practitioners and technical occupations:
Here: 3.1% city: 3.8%
- Percentage of males in service occupations:
Here: 32.2% city: 14.6%
- Percentage of males in sales and office occupations:
Here: 16.9% city: 13.9%
- Percentage of males in farming, fishing, and forestry occupations:
Here: 1.1% city: 0.2%
- Percentage of males in construction, extraction, and maintenance occupations:
Here: 7.7% city: 5.9%
- Percentage of males in production occupations:
Here: 4.4% city: 4.6%
- Percentage of males in transportation occupations:
Here: 3.3% city: 3.9%
- Percentage of males in material moving occupations:
Here: 10.1% city: 3.3%
Occupations of females:
- Percentage of females in management occupations (except farmers):
Here: 2.0% city: 10.2%
- Percentage of females in business and financial operations occupations:
Here: 4.6% city: 9.0%
- Percentage of females in computer and mathematical occupations:
Here: 2.5% city: 3.3%
- Percentage of females in legal occupations:
Here: 3.0% city: 1.8%
- Percentage of females in education, training, and library occupations:
Here: 9.1% city: 8.2%
- Percentage of females in arts, design, entertainment, sports, and media occupations:
Here: 4.0% city: 2.9%
- Percentage of females in healthcare practitioners and technical occupations:
Here: 1.9% city: 9.7%
- Percentage of females in service occupations:
Here: 23.5% city: 19.9%
- Percentage of females in sales and office occupations:
Here: 24.7% city: 22.0%
- Percentage of females in production occupations:
Here: 2.0% city: 2.8%
- Percentage of females in material moving occupations:
Here: 23.2% city: 1.5%
Percentage of people 16-64 in Armed Forces:
| East Village: | 5.1% |
| San Diego: | 4.0% |
Education in this neighborhood (subdivision or community):
- Percentage of people 3 years and older in K-12 schools:
East Village: 12.5% San Diego: 13.8%
- Percentage of people 3 years and older in undergraduate colleges:
East Village: 7.7% San Diego: 8.5%
- Percentage of people 3 years and older in grad. or professional schools:
East Village: 3.2% San Diego: 2.3%
- Percentage of students K-12 enrolled in private schools:
East Village: 37.7% San Diego: 13.6%
Percentage of population below poverty level:
| East Village: | 5.2% |
| San Diego: | 11.3% |
Median year renter moved in (as recorded in 2022):
| East Village: | 2012 |
| San Diego: | 2020 |
Percentage of married-couple families with both working:
| East Village: | 125.8% |
| San Diego: | 66.0% |

- 48.7%Electricity
- 38.9%Utility gas
- 8.3%No fuel used
- 2.2%Solar energy
- 1.9%Wood
Limited-access highways (interstate or state) in this neighborhood:
San Diego Fwy (I- 5)
Length: 0.98 miles
Direction: N-S
Direction: N-S
Roads and streets:
16th St
Length: 0.87 miles
Direction: N-S
Address range: 1 to 1199
Direction: N-S
Address range: 1 to 1199
13th St
Length: 0.83 miles
Direction: N-S
Address range: 1 to 1099
Direction: N-S
Address range: 1 to 1099
17th St
Length: 0.82 miles
Directions: N-S, SE-NW
Address range: 1 to 1199
Directions: N-S, SE-NW
Address range: 1 to 1199
14th St
Length: 0.78 miles
Direction: N-S
Address range: 1 to 1099
Direction: N-S
Address range: 1 to 1099
Imperial Ave
Length: 0.74 miles
Directions: E-W, N-S, SE-NW
Address range: 620 to 1799
Directions: E-W, N-S, SE-NW
Address range: 620 to 1799
J St
Length: 0.73 miles
Direction: E-W
Address range: 700 to 1799
Direction: E-W
Address range: 700 to 1799
Island Ave
Length: 0.73 miles
Direction: E-W
Address range: 700 to 1799
Direction: E-W
Address range: 700 to 1799
K St
Length: 0.67 miles
Directions: E-W, SW-NE
Address range: 700 to 1699
Directions: E-W, SW-NE
Address range: 700 to 1699
15th St
Length: 0.65 miles
Direction: N-S
Address range: 1 to 1099
Direction: N-S
Address range: 1 to 1099
F St
Length: 0.59 miles
Directions: E-W, N-S
Address range: 1000 to 1799
Directions: E-W, N-S
Address range: 1000 to 1799
L St
Length: 0.56 miles
Direction: E-W
Address range: 700 to 1599
Direction: E-W
Address range: 700 to 1599
Market St
Length: 0.54 miles
Direction: E-W
Address range: 1000 to 1799
Direction: E-W
Address range: 1000 to 1799
G St
Length: 0.53 miles
Directions: E-W, N-S
Address range: 1000 to 1799
Directions: E-W, N-S
Address range: 1000 to 1799
12th Ave
Length: 0.51 miles
Direction: N-S
Address range: 600 to 1299
Direction: N-S
Address range: 600 to 1299
N 10th Ave
Length: 0.42 miles
Directions: N-S, SE-NW, SW-NE
Address range: 100 to 599
Directions: N-S, SE-NW, SW-NE
Address range: 100 to 599
N 11th Ave
Length: 0.42 miles
Directions: N-S, SE-NW, SW-NE
Address range: 1 to 599
Directions: N-S, SE-NW, SW-NE
Address range: 1 to 599
Broadway
Length: 0.41 miles
Direction: E-W
Address range: 1191 to 1823
Direction: E-W
Address range: 1191 to 1823
C St
Length: 0.41 miles
Direction: E-W
Address range: 1200 to 1829
Direction: E-W
Address range: 1200 to 1829
B St
Length: 0.41 miles
Direction: E-W
Address range: 1200 to 1814
Direction: E-W
Address range: 1200 to 1814
N 12th Ave
Length: 0.40 miles
Directions: N-S, SW-NE
Address range: 1 to 599
Directions: N-S, SW-NE
Address range: 1 to 599
E St
Length: 0.38 miles
Directions: E-W, SE-NW
Address range: 1188 to 1725
Directions: E-W, SE-NW
Address range: 1188 to 1725
9th Ave
Length: 0.37 miles
Directions: N-S, SE-NW, SW-NE
Address range: 1 to 499
Directions: N-S, SE-NW, SW-NE
Address range: 1 to 499
Commercial St
Length: 0.35 miles
Direction: E-W
Address range: 1300 to 1799
Direction: E-W
Address range: 1300 to 1799
7th Ave
Length: 0.32 miles
Direction: N-S
Address range: 100 to 551
Direction: N-S
Address range: 100 to 551
8th Ave
Length: 0.29 miles
Direction: N-S
Address range: 100 to 499
Direction: N-S
Address range: 100 to 499
11th Ave
Length: 0.15 miles
Direction: N-S
Address range: 600 to 799
Direction: N-S
Address range: 600 to 799
10th Ave
Length: 0.15 miles
Direction: N-S
Address range: 600 to 799
Direction: N-S
Address range: 600 to 799
National Ave
Length: 0.12 miles
Directions: N-S, SE-NW
Address range: 1300 to 1399
Directions: N-S, SE-NW
Address range: 1300 to 1399
Pershing Rd
Length: 0.06 miles
Direction: SW-NE
Direction: SW-NE
06th Ave
Length: 0.03 miles
Direction: N-S
Direction: N-S
Railroad features:
San Diego and Arizona Eastern Rlwy
Length: 0.41 miles
Directions: E-W, N-S, SE-NW, SW-NE
Directions: E-W, N-S, SE-NW, SW-NE
San Diego and Arizona Eastern Rlwy (San Diego Trolley)
Length: 0.39 miles
Directions: E-W, SE-NW
Directions: E-W, SE-NW
Lrt-Bayside
Length: 0.03 miles
Direction: SE-NW
Direction: SE-NW