Eastview neighborhood in White Plains, New York (NY), 10601 detailed profile
Settings
X


Business Search - 14 Million verified businesses
Area: 0.099 square miles
Population: 1,492
Population density:
| Eastview: | 15,035 people per square mile |
| White Plains: | 6,063 people per square mile |

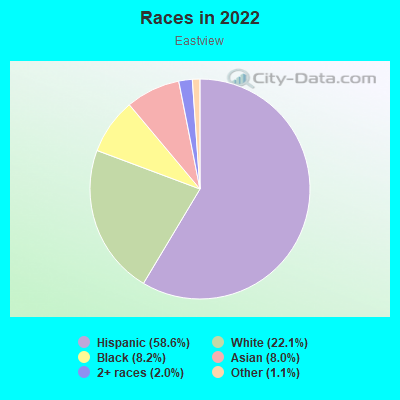
- 88858.6%Hispanic or Latino
- 33522.1%White
- 1258.2%Black
- 1218.0%Asian
- 302.0%Two or more races
- 171.1%Some other race
Median household income in 2022:
| Eastview: | $84,496 |
| White Plains: | $109,551 |
Distribution of median household income
![Distribution of median household income]()
- 102Less than $10,000
- 34$10,000 to $19,999
- 60$20,000 to $29,999
- 59$30,000 to $39,999
- 36$40,000 to $49,999
- 55$50,000 to $59,999
- 56$60,000 to $74,999
- 73$75,000 to $99,999
- 69$100,000 to $124,999
- 41$125,000 to $149,999
- 61$150,000 to $199,999
- 97$200,000 or more

Distribution of owner-occupied house/condo value
![Distribution of owner-occupied house/condo value]()
- 33Less than $50,000
- 16$50,000 to $99,999
- 3$100,000 to $149,999
- 7$150,000 to $199,999
- 1$200,000 to $249,999
- 3$250,000 to $299,999
- 13$300,000 to $399,999
- 31$400,000 to $499,999
- 67$500,000 to $749,999
- 45$750,000 to $999,999
- 26$1,000,000 or more

Distribution of rent paid by renters
![Distribution of rent paid by renters]()
- 3Less than $100
- 5$100 to $199
- 66$200 to $299
- 2$400 to $499
- 1$500 to $599
- 8$600 to $699
- 21$700 to $799
- 3$800 to $899
- 40$900 to $999
- 41$1,000 to $1,249
- 55$1,250 to $1,499
- 107$1,500 to $1,999
- 182$2,000 or more

Median rent in 2022:
| Eastview: | $2,001 |
| White Plains: | $1,882 |
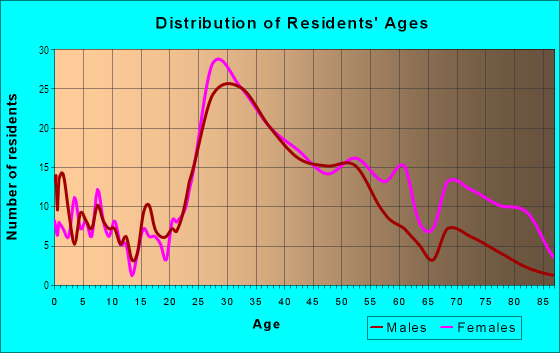
| Males: | 747 |
| Females: | 744 |
Males:
| This neighborhood: | 36.5 years |
| Whole city: | 39.3 years |
| This neighborhood: | 38.9 years |
| Whole city: | 43.5 years |
Average household size:
| Eastview: | 2.1 people |
| White Plains: | 2.4 people |
Percentage of family households:
| Eastview: | 38.0% |
| White Plains: | 39.3% |
| Here: | 38.8% |
| White Plains: | 45.6% |
Percentage of married-couple families with children (among all households):
| Eastview: | 35.8% |
| White Plains: | 30.7% |
Percentage of single-mother households (among all households):
| Eastview: | 3.8% |
| White Plains: | 7.0% |
Percentage of never married males 15 years old and over:
Percentage of never married females 15 years old and over:
| Eastview: | 16.8% |
| White Plains: | 17.7% |
Percentage of never married females 15 years old and over:
| Eastview: | 16.2% |
| city: | 19.7% |
Percentage of people that speak English not well or not at all:
| Eastview: | 17.9% |
| White Plains: | 8.0% |
Percentage of people born in this state:
Percentage of people born in another U.S. state:
Percentage of native residents but born outside the U.S.:
Percentage of foreign born residents:
| Here: | 51.1% |
| White Plains: | 55.2% |
Percentage of people born in another U.S. state:
| Eastview: | 11.0% |
| White Plains: | 11.7% |
Percentage of native residents but born outside the U.S.:
| Here: | 3.2% |
| city: | 2.3% |
Percentage of foreign born residents:
| Here: | 34.7% |
| White Plains: | 30.9% |
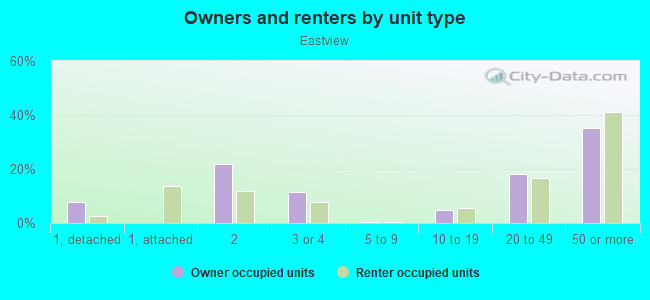
Owner-occupied
Renter-occupied

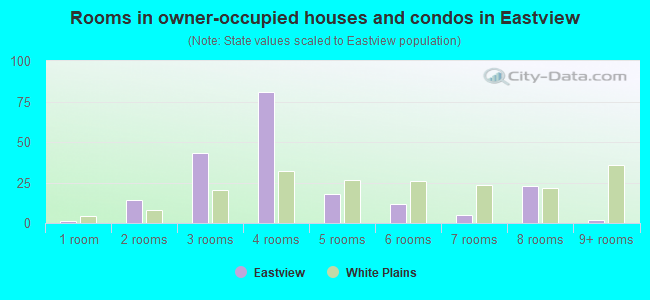
- Rooms in owner-occupied houses and condos in Eastview
- 11 room
- 142 rooms
- 433 rooms
- 814 rooms
- 185 rooms
- 126 rooms
- 57 rooms
- 238 rooms
- 29+ rooms
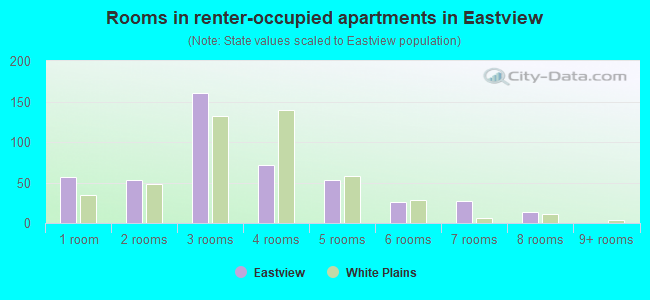
- Rooms in renter-occupied apartments in Eastview
- 571 room
- 532 rooms
- 1603 rooms
- 724 rooms
- 535 rooms
- 266 rooms
- 277 rooms
- 148 rooms
- 09+ rooms
Owner-occupied
Renter-occupied
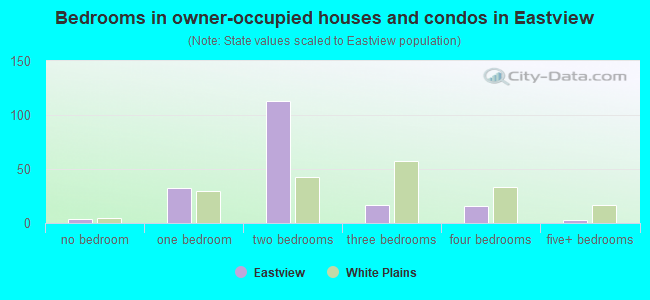
- Bedrooms in owner-occupied houses and condos in Eastview
- 4no bedroom
- 321 bedroom
- 1132 bedrooms
- 173 bedrooms
- 164 bedrooms
- 35+ bedrooms
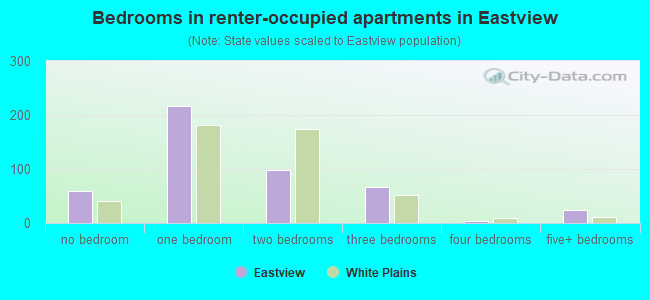
- Bedrooms in renter-occupied apartments in Eastview
- 59no bedroom
- 2171 bedroom
- 982 bedrooms
- 663 bedrooms
- 34 bedrooms
- 255+ bedrooms
Average number of cars or other vehicles available in houses/condos:
Average number of cars or other vehicles available in apartments:
| This neighborhood: | 1.3 |
| White Plains: | 1.8 |
Average number of cars or other vehicles available in apartments:
| Here: | 1.2 |
| city: | 1.1 |
Percentage of units with a mortgage:
| Eastview: | 58.5% |
| White Plains: | 58.0% |
Average estimated '22 value of housing units in 5-or-more-unit structures (42.1% of all units):
| Eastview: | $790,164 |
| New York: | $912,009 |
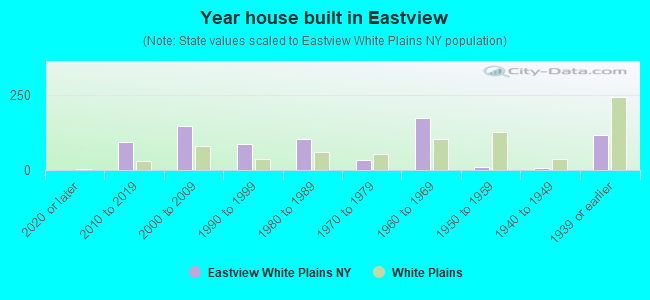
- Year house built in Eastview
- 02020 or later
- 952010 to 2019
- 1482000 to 2009
- 861990 to 1999
- 1021980 to 1989
- 331970 to 1979
- 1751960 to 1969
- 111950 to 1959
- 71940 to 1949
- 1161939 or earlier
City-data.com crime index for city in 2020 (higher means more crime):
| City: | 109.1 |
| U.S. average: | 219.5 |
Travel time to work (commute)
![Travel time to work (commute)]()
- 5Less than 5 minutes
- 95 to 9 minutes
- 2310 to 14 minutes
- 4615 to 19 minutes
- 5620 to 24 minutes
- 2225 to 29 minutes
- 2330 to 34 minutes
- 435 to 39 minutes
- 1440 to 44 minutes
- 3645 to 59 minutes
- 3160 to 89 minutes
- 390 or more minutes

Means of transportation to work
![Means of transportation to work]()
- 60.8%398Drove a car alone
- 9.8%64Carpooled
- 6.7%44Bus
- 4.9%32Long-distance train or commuter rail
- 1.2%8Light rail, streetcar or trolley
- 0.2%1Bicycle
- 9.2%60Walked
- 1.1%7Other means
- 10.7%70Worked at home

Time leaving home to go to work
![Time leaving home to go to work]()
- 112:00 a.m. to 4:59 a.m.
- 105:00 a.m. to 5:29 a.m.
- 115:30 a.m. to 5:59 a.m.
- 136:00 a.m. to 6:29 a.m.
- 146:30 a.m. to 6:59 a.m.
- 457:00 a.m. to 7:29 a.m.
- 417:30 a.m. to 7:59 a.m.
- 348:00 a.m. to 8:29 a.m.
- 228:30 a.m. to 8:59 a.m.
- 189:00 a.m. to 9:59 a.m.
- 1810:00 a.m. to 10:59 a.m.
- 411:00 a.m. to 11:59 a.m.
- 212:00 p.m. to 3:59 p.m.
- 154:00 p.m. to 11:59 p.m.

Occupations of males:
- Percentage of males in management occupations (except farmers):
Here: 11.8% city: 13.4%
- Percentage of males in business and financial operations occupations:
Here: 17.1% city: 9.8%
- Percentage of males in computer and mathematical occupations:
Here: 2.5% city: 5.6%
- Percentage of males in life, physical, and social science occupations:
Here: 3.1% city: 1.8%
- Percentage of males in legal occupations:
Here: 3.7% city: 4.8%
- Percentage of males in education, training, and library occupations:
Here: 6.7% city: 4.6%
- Percentage of males in healthcare practitioners and technical occupations:
Here: 2.7% city: 3.9%
- Percentage of males in service occupations:
Here: 19.0% city: 15.5%
- Percentage of males in sales and office occupations:
Here: 7.9% city: 14.1%
- Percentage of males in construction, extraction, and maintenance occupations:
Here: 14.4% city: 7.2%
- Percentage of males in transportation occupations:
Here: 2.6% city: 3.9%
- Percentage of males in material moving occupations:
Here: 1.1% city: 2.0%
Occupations of females:
- Percentage of females in management occupations (except farmers):
Here: 7.4% city: 9.8%
- Percentage of females in community and social services occupations:
Here: 5.1% city: 3.0%
- Percentage of females in legal occupations:
Here: 5.1% city: 4.4%
- Percentage of females in education, training, and library occupations:
Here: 10.4% city: 12.2%
- Percentage of females in arts, design, entertainment, sports, and media occupations:
Here: 2.9% city: 2.9%
- Percentage of females in healthcare practitioners and technical occupations:
Here: 16.5% city: 11.2%
- Percentage of females in service occupations:
Here: 18.2% city: 22.1%
- Percentage of females in sales and office occupations:
Here: 23.1% city: 20.9%
- Percentage of females in production occupations:
Here: 2.5% city: 0.8%
- Percentage of females in material moving occupations:
Here: 2.0% city: 0.4%
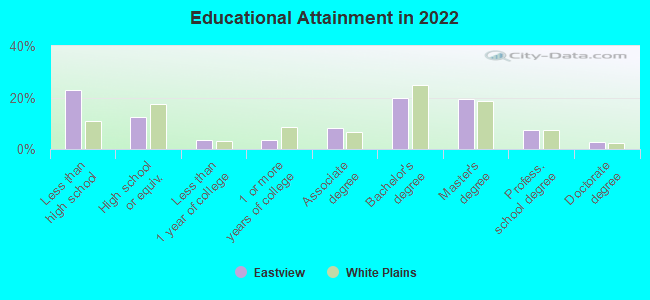
Education in this neighborhood (subdivision or community):
- Percentage of people 3 years and older in K-12 schools:
Eastview: 13.4% White Plains: 13.2%
- Percentage of people 3 years and older in undergraduate colleges:
Eastview: 3.8% White Plains: 5.0%
- Percentage of people 3 years and older in grad. or professional schools:
Eastview: 3.5% White Plains: 1.8%
- Percentage of students K-12 enrolled in private schools:
Eastview: 27.8% White Plains: 19.8%
Percentage of population below poverty level:
| Eastview: | 15.2% |
| White Plains: | 10.0% |
Median year owner moved in (as recorded in 2022):
Median year renter moved in (as recorded in 2022):
| Eastview: | 2012 |
| White Plains: | 2006 |
Median year renter moved in (as recorded in 2022):
| Eastview: | 2016 |
| White Plains: | 2015 |
Percentage of married-couple families with both working:
| Eastview: | 49.9% |
| White Plains: | 77.5% |
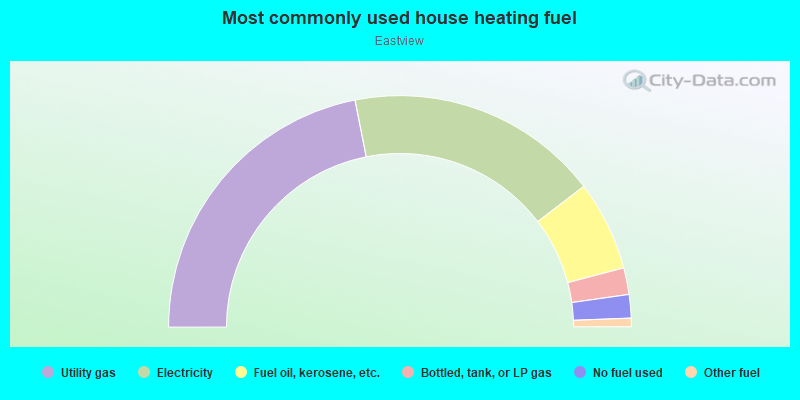
- 43.8%Utility gas
- 35.4%Electricity
- 12.6%Fuel oil, kerosene, etc.
- 3.7%Bottled, tank, or LP gas
- 3.3%No fuel used
- 1.2%Other fuel
Highways in this neighborhood:
State Hwy 119 (Westchester Ave)
Length: 0.53 miles
Directions: E-W, N-S, SE-NW
Address range: 1 to 188
Directions: E-W, N-S, SE-NW
Address range: 1 to 188
State Hwy 22 (S Broadway)
Length: 0.03 miles
Direction: SE-NW
Direction: SE-NW
State Hwy 22 (22, Armory Pl)
Length: 0.02 miles
Directions: N-S, SE-NW
Directions: N-S, SE-NW
Roads and streets:
Main St
Length: 0.39 miles
Direction: SW-NE
Address range: 279 to 399
Direction: SW-NE
Address range: 279 to 399
S Kersica Ave
Length: 0.32 miles
Directions: N-S, SE-NW
Address range: 14 to 199
Directions: N-S, SE-NW
Address range: 14 to 199
Franklin Ave
Length: 0.22 miles
Directions: E-W, N-S, SW-NE
Address range: 1 to 99
Directions: E-W, N-S, SW-NE
Address range: 1 to 99
Amherst Pl
Length: 0.14 miles
Directions: N-S, SE-NW
Address range: 1 to 99
Directions: N-S, SE-NW
Address range: 1 to 99
Windsor Ter
Length: 0.12 miles
Direction: SE-NW
Address range: 1 to 99
Direction: SE-NW
Address range: 1 to 99
Broad Pkwy
Length: 0.12 miles
Directions: E-W, SE-NW, SW-NE
Address range: 1 to 99
Directions: E-W, SE-NW, SW-NE
Address range: 1 to 99
Eastview Ave
Length: 0.05 miles
Direction: SE-NW
Direction: SE-NW
Armory Pl
Length: 0.03 miles
Directions: E-W, SW-NE
Directions: E-W, SW-NE