Eastwood neighborhood in Lakeland, Florida (FL), 33813 detailed profile
Settings
X


Business Search - 14 Million verified businesses
Area: 0.016 square miles
Population: 4,531
Population density:
| Eastwood: | 286,061 people per square mile |
| Lakeland: | 2,619 people per square mile |

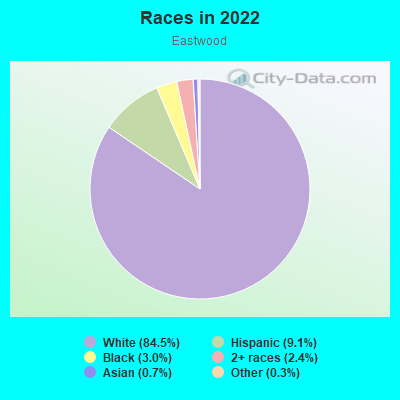
- 3,95684.5%White
- 4279.1%Hispanic or Latino
- 1403.0%Black
- 1132.4%Two or more races
- 340.7%Asian
- 120.3%Some other race
Median household income in 2022:
| Eastwood: | $55,411 |
| Lakeland: | $58,524 |
Distribution of median household income
![Distribution of median household income]()
- 38Less than $10,000
- 481$10,000 to $19,999
- 51$20,000 to $29,999
- 152$30,000 to $39,999
- 413$40,000 to $49,999
- 163$50,000 to $59,999
- 163$60,000 to $74,999
- 31$75,000 to $99,999
- 239$100,000 to $124,999
- 379$125,000 to $149,999
- 80$150,000 to $199,999
- 163$200,000 or more

Distribution of owner-occupied house/condo value
![Distribution of owner-occupied house/condo value]()
- 34Less than $50,000
- 10$50,000 to $99,999
- 91$100,000 to $149,999
- 87$150,000 to $199,999
- 720$200,000 to $249,999
- 194$250,000 to $299,999
- 724$300,000 to $399,999
- 171$400,000 to $499,999
- 141$500,000 to $749,999
- 23$750,000 to $999,999
- 42$1,000,000 or more

Distribution of rent paid by renters
![Distribution of rent paid by renters]()
- 84$1,500 to $1,999
- 17$2,000 or more

| Males: | 2,415 |
| Females: | 2,116 |
Males:
| This neighborhood: | 45.4 years |
| Whole city: | 36.6 years |
| This neighborhood: | 62.2 years |
| Whole city: | 43.9 years |
Average household size:
| Eastwood: | 25.7 people |
| Lakeland: | 2.2 people |
Percentage of family households:
| Eastwood: | 35.5% |
| Lakeland: | 37.2% |
| Here: | 40.9% |
| Lakeland: | 39.0% |
Percentage of married-couple families with children (among all households):
| Eastwood: | 13.8% |
| Lakeland: | 28.4% |
Percentage of single-mother households (among all households):
| Eastwood: | 34.7% |
| Lakeland: | 9.0% |
Percentage of never married males 15 years old and over:
Percentage of never married females 15 years old and over:
| Eastwood: | 16.4% |
| Lakeland: | 17.7% |
Percentage of never married females 15 years old and over:
| Eastwood: | 8.3% |
| city: | 17.5% |
Percentage of people born in this state:
Percentage of people born in another U.S. state:
Percentage of native residents but born outside the U.S.:
Percentage of foreign born residents:
| Here: | 39.1% |
| Lakeland: | 44.9% |
Percentage of people born in another U.S. state:
| Eastwood: | 48.1% |
| Lakeland: | 39.1% |
Percentage of native residents but born outside the U.S.:
| Here: | 5.5% |
| city: | 6.1% |
Percentage of foreign born residents:
| Here: | 7.3% |
| Lakeland: | 10.0% |
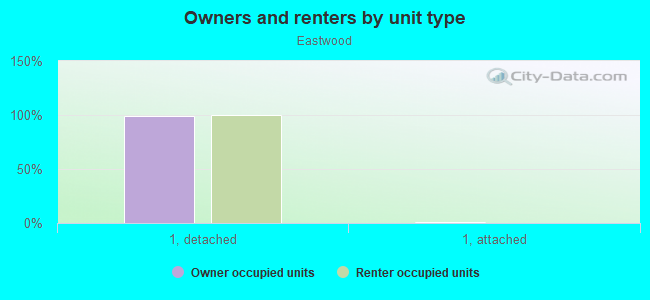
Owner-occupied
Renter-occupied

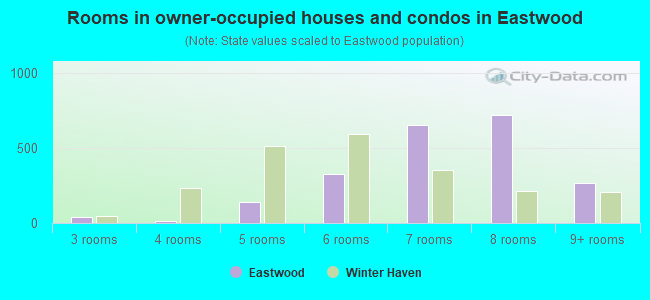
- Rooms in owner-occupied houses and condos in Eastwood
- 01 room
- 02 rooms
- 413 rooms
- 154 rooms
- 1405 rooms
- 3256 rooms
- 6517 rooms
- 7198 rooms
- 2659+ rooms
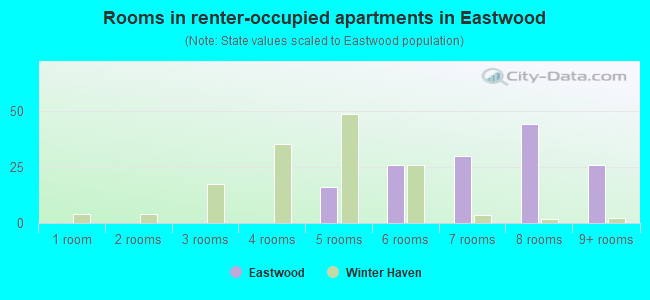
- Rooms in renter-occupied apartments in Eastwood
- 01 room
- 02 rooms
- 03 rooms
- 04 rooms
- 165 rooms
- 266 rooms
- 307 rooms
- 448 rooms
- 269+ rooms
Owner-occupied
Renter-occupied
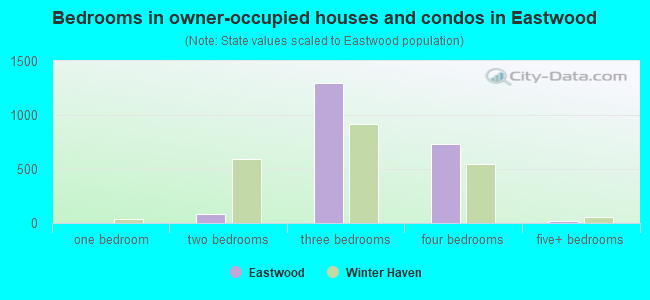
- Bedrooms in owner-occupied houses and condos in Eastwood
- 0no bedroom
- 01 bedroom
- 872 bedrooms
- 1,2983 bedrooms
- 7344 bedrooms
- 225+ bedrooms
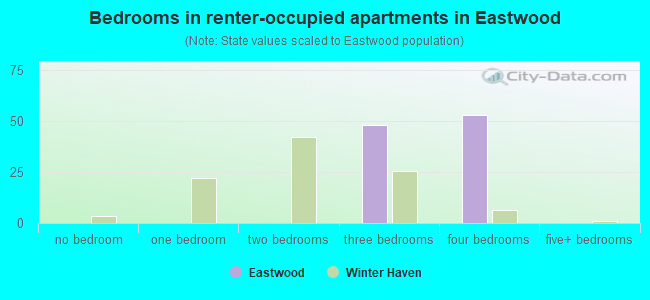
- Bedrooms in renter-occupied apartments in Eastwood
- 0no bedroom
- 01 bedroom
- 02 bedrooms
- 483 bedrooms
- 534 bedrooms
- 05+ bedrooms
Average number of cars or other vehicles available in houses/condos:
Average number of cars or other vehicles available in apartments:
| This neighborhood: | 1.8 |
| Lakeland: | 1.8 |
Average number of cars or other vehicles available in apartments:
| Here: | 4.9 |
| city: | 1.1 |
Percentage of units with a mortgage:
| Eastwood: | 51.1% |
| Lakeland: | 50.4% |
Average estimated value of detached houses in 2022 (100.0% of all units):
| Eastwood: | $314,022 |
| Lakeland: | $231,452 |
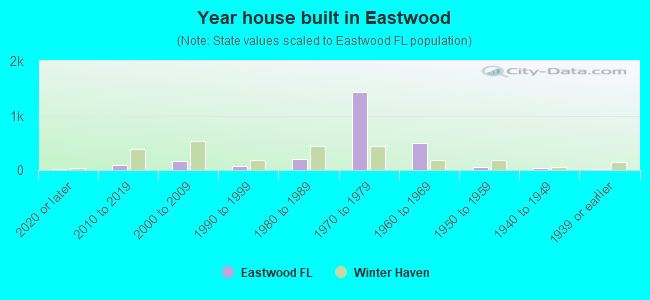
- Year house built in Eastwood
- 242020 or later
- 832010 to 2019
- 1572000 to 2009
- 751990 to 1999
- 1931980 to 1989
- 1,4381970 to 1979
- 4881960 to 1969
- 531950 to 1959
- 451940 to 1949
- 121939 or earlier
City-data.com crime index for city in 2020 (higher means more crime):
| City: | 242.4 |
| U.S. average: | 219.5 |
Travel time to work (commute)
![Travel time to work (commute)]()
- 31Less than 5 minutes
- 865 to 9 minutes
- 22210 to 14 minutes
- 25215 to 19 minutes
- 22420 to 24 minutes
- 17425 to 29 minutes
- 47430 to 34 minutes
- 8935 to 39 minutes
- 9740 to 44 minutes
- 29945 to 59 minutes
- 21160 to 89 minutes
- 990 or more minutes

Means of transportation to work
![Means of transportation to work]()
- 95.3%1,927Drove a car alone
- 11.6%235Carpooled
- 0.9%19Bicycle
- 0.9%19Walked
- 0.9%19Other means
- 4.6%94Worked at home

Time leaving home to go to work
![Time leaving home to go to work]()
- 12312:00 a.m. to 4:59 a.m.
- 845:00 a.m. to 5:29 a.m.
- 1425:30 a.m. to 5:59 a.m.
- 3296:00 a.m. to 6:29 a.m.
- 1886:30 a.m. to 6:59 a.m.
- 2787:00 a.m. to 7:29 a.m.
- 1767:30 a.m. to 7:59 a.m.
- 2118:00 a.m. to 8:29 a.m.
- 1988:30 a.m. to 8:59 a.m.
- 699:00 a.m. to 9:59 a.m.
- 6010:00 a.m. to 10:59 a.m.
- 1311:00 a.m. to 11:59 a.m.
- 12812:00 p.m. to 3:59 p.m.
- 1124:00 p.m. to 11:59 p.m.

Occupations of males:
- Percentage of males in management occupations (except farmers):
Here: 19.9% city: 8.9%
- Percentage of males in business and financial operations occupations:
Here: 5.3% city: 5.6%
- Percentage of males in computer and mathematical occupations:
Here: 2.7% city: 4.1%
- Percentage of males in community and social services occupations:
Here: 1.2% city: 1.9%
- Percentage of males in education, training, and library occupations:
Here: 1.9% city: 2.6%
- Percentage of males in arts, design, entertainment, sports, and media occupations:
Here: 5.6% city: 1.6%
- Percentage of males in healthcare practitioners and technical occupations:
Here: 3.6% city: 3.6%
- Percentage of males in service occupations:
Here: 11.1% city: 15.7%
- Percentage of males in sales and office occupations:
Here: 5.0% city: 14.7%
- Percentage of males in farming, fishing, and forestry occupations:
Here: 1.6% city: 0.4%
- Percentage of males in construction, extraction, and maintenance occupations:
Here: 4.0% city: 7.2%
- Percentage of males in production occupations:
Here: 15.6% city: 6.6%
- Percentage of males in transportation occupations:
Here: 23.6% city: 8.5%
- Percentage of males in material moving occupations:
Here: 1.5% city: 8.3%
Occupations of females:
- Percentage of females in management occupations (except farmers):
Here: 26.8% city: 6.9%
- Percentage of females in business and financial operations occupations:
Here: 5.1% city: 5.1%
- Percentage of females in computer and mathematical occupations:
Here: 5.4% city: 2.8%
- Percentage of females in education, training, and library occupations:
Here: 10.2% city: 7.7%
- Percentage of females in healthcare practitioners and technical occupations:
Here: 8.9% city: 9.8%
- Percentage of females in service occupations:
Here: 40.8% city: 21.0%
- Percentage of females in sales and office occupations:
Here: 39.5% city: 31.9%
- Percentage of females in production occupations:
Here: 2.5% city: 2.2%
- Percentage of females in transportation occupations:
Here: 5.7% city: 1.4%
- Percentage of females in material moving occupations:
Here: 2.9% city: 3.0%
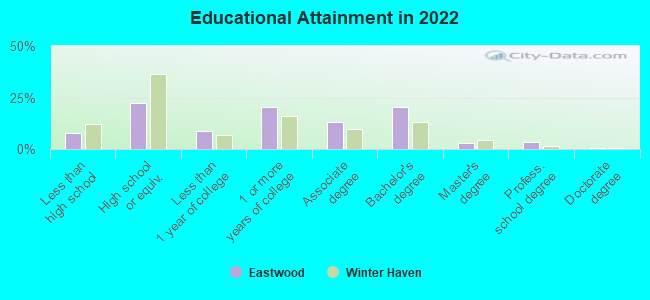
Education in this neighborhood (subdivision or community):
- Percentage of people 3 years and older in K-12 schools:
Eastwood: 23.2% Lakeland: 13.1%
- Percentage of people 3 years and older in undergraduate colleges:
Eastwood: 3.2% Lakeland: 10.0%
- Percentage of people 3 years and older in grad. or professional schools:
Eastwood: 0.8% Lakeland: 0.5%
- Percentage of students K-12 enrolled in private schools:
Eastwood: 11.6% Lakeland: 15.3%
Percentage of population below poverty level:
| Eastwood: | 5.1% |
| Lakeland: | 12.3% |
Median year owner moved in (as recorded in 2022):
| Eastwood: | 2077 |
| Lakeland: | 2015 |
Percentage of married-couple families with both working:
| Eastwood: | 98.5% |
| Lakeland: | 71.2% |
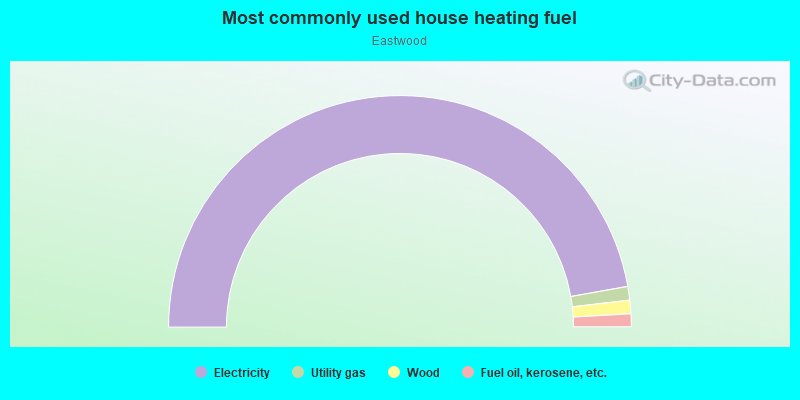
- 94.3%Electricity
- 1.9%Utility gas
- 1.9%Wood
- 1.8%Fuel oil, kerosene, etc.