Ed Bluestein neighborhood in Austin, Texas (TX), 78721 detailed profile
Settings
X


Business Search - 14 Million verified businesses
Area: 0.670 square miles
Population: 544
Population density:
| Ed Bluestein: | 812 people per square mile |
| Austin: | 3,878 people per square mile |

- 26741.8%Hispanic or Latino
- 24338.0%White
- 6810.6%Two or more races
- 294.5%Some other race
- 172.7%Asian
- 152.3%Black

Distribution of median household income
![Distribution of median household income]()
- 129Less than $10,000
- 133$10,000 to $19,999
- 32$20,000 to $29,999
- 106$30,000 to $39,999
- 39$40,000 to $49,999
- 79$50,000 to $59,999
- 19$60,000 to $74,999
- 82$75,000 to $99,999
- 7$100,000 to $124,999
- 33$125,000 to $149,999
- 17$150,000 to $199,999
- 44$200,000 or more

Distribution of owner-occupied house/condo value
![Distribution of owner-occupied house/condo value]()
- 3Less than $50,000
- 17$50,000 to $99,999
- 103$100,000 to $149,999
- 9$150,000 to $199,999
- 19$200,000 to $249,999
- 9$250,000 to $299,999
- 67$300,000 to $399,999
- 39$400,000 to $499,999
- 38$500,000 to $749,999
- 26$750,000 to $999,999
- 22$1,000,000 or more

Distribution of rent paid by renters
![Distribution of rent paid by renters]()
- 8Less than $100
- 79$100 to $199
- 49$200 to $299
- 160$300 to $399
- 23$600 to $699
- 42$700 to $799
- 6$800 to $899
- 39$900 to $999
- 260$1,000 to $1,249
- 88$1,250 to $1,499
- 49$1,500 to $1,999
- 63$2,000 or more

Median rent in 2022:
| Ed Bluestein: | $1,789 |
| Austin: | $1,437 |
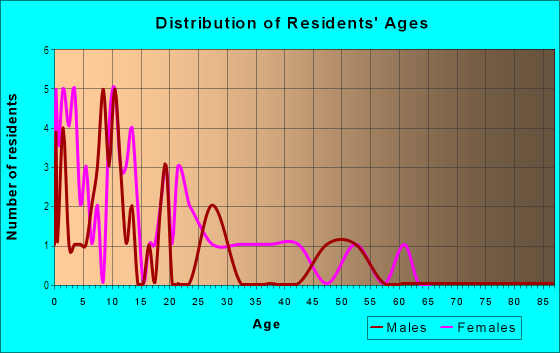
| Males: | 323 |
| Females: | 220 |
Males:
| This neighborhood: | 34.2 years |
| Whole city: | 34.5 years |
| This neighborhood: | 35.3 years |
| Whole city: | 34.4 years |
Average household size:
| Ed Bluestein: | 2.5 people |
| Austin: | 28.0 people |
Percentage of family households:
| Ed Bluestein: | 27.6% |
| Austin: | 36.6% |
| Here: | 31.5% |
| Austin: | 35.3% |
Percentage of married-couple families with children (among all households):
| Ed Bluestein: | 39.2% |
| Austin: | 36.3% |
Percentage of single-mother households (among all households):
| Ed Bluestein: | 261.4% |
| Austin: | 7.9% |
Percentage of never married males 15 years old and over:
Percentage of never married females 15 years old and over:
| Ed Bluestein: | 18.2% |
| Austin: | 25.0% |
Percentage of never married females 15 years old and over:
| Ed Bluestein: | 16.3% |
| city: | 19.9% |
Percentage of people that speak English not well or not at all:
| Ed Bluestein: | 4.2% |
| Austin: | 5.2% |
Percentage of people born in this state:
Percentage of people born in another U.S. state:
Percentage of native residents but born outside the U.S.:
Percentage of foreign born residents:
| Here: | 49.1% |
| Austin: | 48.2% |
Percentage of people born in another U.S. state:
| Ed Bluestein: | 30.1% |
| Austin: | 31.8% |
Percentage of native residents but born outside the U.S.:
| Here: | 0.7% |
| city: | 2.3% |
Percentage of foreign born residents:
| Here: | 20.1% |
| Austin: | 17.8% |

Owner-occupied
Renter-occupied


- Rooms in owner-occupied houses and condos in Ed Bluestein
- 221 room
- 02 rooms
- 133 rooms
- 484 rooms
- 495 rooms
- 136 rooms
- 67 rooms
- 388 rooms
- 219+ rooms

- Rooms in renter-occupied apartments in Ed Bluestein
- 201 room
- 262 rooms
- 73 rooms
- 94 rooms
- 2115 rooms
- 336 rooms
- 87 rooms
- 98 rooms
- 29+ rooms
Owner-occupied
Renter-occupied

- Bedrooms in owner-occupied houses and condos in Ed Bluestein
- 22no bedroom
- 191 bedroom
- 432 bedrooms
- 1153 bedrooms
- 104 bedrooms
- 125+ bedrooms

- Bedrooms in renter-occupied apartments in Ed Bluestein
- 20no bedroom
- 81 bedroom
- 112 bedrooms
- 193 bedrooms
- 224 bedrooms
- 25+ bedrooms
Average number of cars or other vehicles available in houses/condos:
Average number of cars or other vehicles available in apartments:
| This neighborhood: | 1.9 |
| Austin: | 1.9 |
Average number of cars or other vehicles available in apartments:
| Here: | 1.3 |
| city: | 1.3 |
Percentage of units with a mortgage:
| Ed Bluestein: | 67.1% |
| Austin: | 68.5% |
Average estimated value of detached houses in 2022 (82.3% of all units):
| Ed Bluestein: | $412,135 |
| Austin: | $737,673 |

- Year house built in Ed Bluestein
- 192020 or later
- 232010 to 2019
- 152000 to 2009
- 531990 to 1999
- 251980 to 1989
- 271970 to 1979
- 571960 to 1969
- 691950 to 1959
- 441940 to 1949
- 131939 or earlier

City-data.com crime index for city in 2020 (higher means more crime):
| City: | 316.8 |
| U.S. average: | 219.5 |
Travel time to work (commute)
![Travel time to work (commute)]()
- 34Less than 5 minutes
- 485 to 9 minutes
- 14510 to 14 minutes
- 15015 to 19 minutes
- 14420 to 24 minutes
- 4325 to 29 minutes
- 8430 to 34 minutes
- 2435 to 39 minutes
- 3140 to 44 minutes
- 3445 to 59 minutes
- 5960 to 89 minutes
- 190 or more minutes

Means of transportation to work
![Means of transportation to work]()
- 53.7%208Drove a car alone
- 2.6%10Carpooled
- 15.0%58Bus
- 5.9%23Subway or elevated rail
- 0.3%1Ferryboat
- 1.0%4Taxi
- 2.1%8Motorcycle
- 21.2%82Bicycle
- 1.5%6Walked
- 1.0%4Other means
- 22.0%85Worked at home

Time leaving home to go to work
![Time leaving home to go to work]()
- 4412:00 a.m. to 4:59 a.m.
- 465:00 a.m. to 5:29 a.m.
- 175:30 a.m. to 5:59 a.m.
- 336:00 a.m. to 6:29 a.m.
- 1026:30 a.m. to 6:59 a.m.
- 527:00 a.m. to 7:29 a.m.
- 597:30 a.m. to 7:59 a.m.
- 638:00 a.m. to 8:29 a.m.
- 628:30 a.m. to 8:59 a.m.
- 1069:00 a.m. to 9:59 a.m.
- 5410:00 a.m. to 10:59 a.m.
- 1011:00 a.m. to 11:59 a.m.
- 11312:00 p.m. to 3:59 p.m.
- 724:00 p.m. to 11:59 p.m.

Occupations of males:
- Percentage of males in management occupations (except farmers):
Here: 15.2% city: 15.3%
- Percentage of males in business and financial operations occupations:
Here: 5.6% city: 7.0%
- Percentage of males in computer and mathematical occupations:
Here: 3.2% city: 12.0%
- Percentage of males in community and social services occupations:
Here: 1.6% city: 1.0%
- Percentage of males in legal occupations:
Here: 2.0% city: 1.9%
- Percentage of males in arts, design, entertainment, sports, and media occupations:
Here: 22.0% city: 4.1%
- Percentage of males in service occupations:
Here: 11.9% city: 11.2%
- Percentage of males in sales and office occupations:
Here: 10.4% city: 14.9%
- Percentage of males in construction, extraction, and maintenance occupations:
Here: 25.7% city: 7.1%
- Percentage of males in production occupations:
Here: 2.0% city: 3.4%
Occupations of females:
- Percentage of females in management occupations (except farmers):
Here: 13.1% city: 13.5%
- Percentage of females in computer and mathematical occupations:
Here: 5.4% city: 4.0%
- Percentage of females in life, physical, and social science occupations:
Here: 5.5% city: 1.7%
- Percentage of females in legal occupations:
Here: 4.2% city: 2.4%
- Percentage of females in arts, design, entertainment, sports, and media occupations:
Here: 15.2% city: 4.5%
- Percentage of females in healthcare practitioners and technical occupations:
Here: 8.4% city: 7.8%
- Percentage of females in service occupations:
Here: 20.4% city: 15.8%
- Percentage of females in sales and office occupations:
Here: 30.0% city: 22.9%
- Percentage of females in production occupations:
Here: 1.5% city: 1.5%
Percentage of people 16-64 in Armed Forces:
| Ed Bluestein: | 0.6% |
| Austin: | 0.1% |
Education in this neighborhood (subdivision or community):
- Percentage of people 3 years and older in K-12 schools:
Ed Bluestein: 34.4% Austin: 12.4%
- Percentage of people 3 years and older in undergraduate colleges:
Ed Bluestein: 21.7% Austin: 6.1%
- Percentage of people 3 years and older in grad. or professional schools:
Ed Bluestein: 3.5% Austin: 2.5%
- Percentage of students K-12 enrolled in private schools:
Ed Bluestein: 53.5% Austin: 11.8%
Percentage of population below poverty level:
| Ed Bluestein: | 22.8% |
| Austin: | 11.1% |
Median year owner moved in (as recorded in 2022):
Median year renter moved in (as recorded in 2022):
| Ed Bluestein: | 2011 |
| Austin: | 2013 |
Median year renter moved in (as recorded in 2022):
| Ed Bluestein: | 2016 |
| Austin: | 2021 |
Percentage of married-couple families with both working:
| Ed Bluestein: | 953.5% |
| Austin: | 68.5% |

- 56.6%Utility gas
- 31.8%Electricity
- 6.3%Bottled, tank, or LP gas
- 2.9%No fuel used
- 1.5%Solar energy
- 0.9%Wood
Highways in this neighborhood:
US Hwy 183 (Ed Bluestein Blvd)
Length: 1.61 miles
Directions: N-S, SW-NE
Address range: 2852 to 4898
Directions: N-S, SW-NE
Address range: 2852 to 4898
Roads and streets:
Wilcab Rd
Length: 0.50 miles
Directions: E-W, SE-NW
Address range: 5700 to 6599
Directions: E-W, SE-NW
Address range: 5700 to 6599
Bluestein Dr
Length: 0.42 miles
Directions: E-W, SE-NW, SW-NE
Address range: 3600 to 3799
Directions: E-W, SE-NW, SW-NE
Address range: 3600 to 3799
Techni Center Dr
Length: 0.35 miles
Directions: E-W, N-S, SE-NW
Address range: 5800 to 6199
Directions: E-W, N-S, SE-NW
Address range: 5800 to 6199
Harold Ct
Length: 0.27 miles
Directions: E-W, SE-NW, SW-NE
Address range: 6105 to 6699
Directions: E-W, SE-NW, SW-NE
Address range: 6105 to 6699
Tracor Ln
Length: 0.21 miles
Directions: E-W, SE-NW
Address range: 5874 to 6099
Directions: E-W, SE-NW
Address range: 5874 to 6099
Axel Ln
Length: 0.15 miles
Direction: SW-NE
Address range: 3600 to 3799
Direction: SW-NE
Address range: 3600 to 3799
Tannehill Ln
Length: 0.14 miles
Direction: N-S
Direction: N-S
Darby St
Length: 0.12 miles
Direction: SW-NE
Address range: 3400 to 3599
Direction: SW-NE
Address range: 3400 to 3599
E Martin Luther King Jr Blvd
Length: 0.09 miles
Direction: E-W
Address range: 5800 to 5899
Direction: E-W
Address range: 5800 to 5899
Hudson St
Length: 0.08 miles
Directions: E-W, SE-NW
Address range: 5613 to 6599
Directions: E-W, SE-NW
Address range: 5613 to 6599