Edward Vincent Jr Park neighborhood in Inglewood, California (CA), 90302 detailed profile
Settings
X


Business Search - 14 Million verified businesses
Area: 0.085 square miles
Population: 896
Population density:
| Edward Vincent Jr Park: | 10,526 people per square mile |
| Inglewood: | 11,344 people per square mile |

- 77677.9%Hispanic or Latino
- 868.6%Two or more races
- 787.8%Black
- 383.8%White
- 141.4%Some other race
- 40.4%Asian

Distribution of median household income
![Distribution of median household income]()
- 28Less than $10,000
- 24$10,000 to $19,999
- 15$20,000 to $29,999
- 34$30,000 to $39,999
- 37$40,000 to $49,999
- 19$50,000 to $59,999
- 63$60,000 to $74,999
- 51$75,000 to $99,999
- 11$100,000 to $124,999
- 11$125,000 to $149,999
- 21$150,000 to $199,999
- 10$200,000 or more

Distribution of owner-occupied house/condo value
![Distribution of owner-occupied house/condo value]()
- 9Less than $50,000
- 2$50,000 to $99,999
- 8$150,000 to $199,999
- 8$200,000 to $249,999
- 14$300,000 to $399,999
- 14$400,000 to $499,999
- 62$500,000 to $749,999
- 60$750,000 to $999,999
- 10$1,000,000 or more

Distribution of rent paid by renters
![Distribution of rent paid by renters]()
- 7Less than $100
- 3$100 to $199
- 8$200 to $299
- 9$300 to $399
- 12$400 to $499
- 11$500 to $599
- 22$600 to $699
- 5$700 to $799
- 11$800 to $899
- 14$900 to $999
- 8$1,000 to $1,249
- 44$1,250 to $1,499
- 9$1,500 to $1,999
- 14$2,000 or more

Median rent in 2022:
| Edward Vincent Jr Park: | $1,332 |
| Inglewood: | $1,583 |
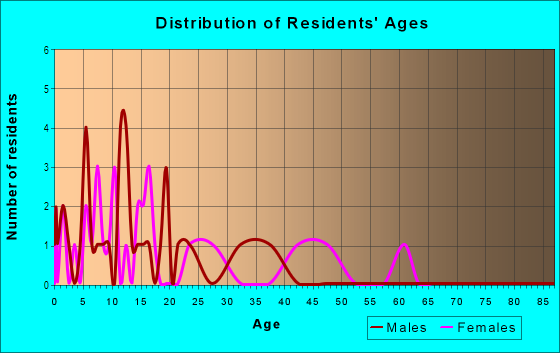
| Males: | 418 |
| Females: | 477 |
Males:
| This neighborhood: | 35.1 years |
| Whole city: | 39.0 years |
| This neighborhood: | 38.1 years |
| Whole city: | 36.6 years |
Average household size:
| Edward Vincent Jr Park: | 3.3 people |
| Inglewood: | 2.8 people |
Percentage of family households:
| Edward Vincent Jr Park: | 63.8% |
| Inglewood: | 45.5% |
| Here: | 46.3% |
| Inglewood: | 36.8% |
Percentage of married-couple families with children (among all households):
| Edward Vincent Jr Park: | 24.2% |
| Inglewood: | 21.5% |
Percentage of single-mother households (among all households):
| Edward Vincent Jr Park: | 4.8% |
| Inglewood: | 8.9% |
Percentage of never married males 15 years old and over:
Percentage of never married females 15 years old and over:
| Edward Vincent Jr Park: | 20.5% |
| Inglewood: | 21.8% |
Percentage of never married females 15 years old and over:
| Edward Vincent Jr Park: | 27.6% |
| city: | 22.9% |
Percentage of people that speak English not well or not at all:
| Edward Vincent Jr Park: | 28.3% |
| Inglewood: | 11.3% |
Percentage of people born in this state:
Percentage of people born in another U.S. state:
Percentage of native residents but born outside the U.S.:
Percentage of foreign born residents:
| Here: | 51.4% |
| Inglewood: | 53.8% |
Percentage of people born in another U.S. state:
| Edward Vincent Jr Park: | 8.1% |
| Inglewood: | 12.9% |
Percentage of native residents but born outside the U.S.:
| Here: | 0.3% |
| city: | 1.5% |
Percentage of foreign born residents:
| Here: | 40.2% |
| Inglewood: | 31.8% |

Owner-occupied
Renter-occupied


- Rooms in owner-occupied houses and condos in Edward Vincent Jr Park
- 01 room
- 32 rooms
- 23 rooms
- 184 rooms
- 495 rooms
- 136 rooms
- 487 rooms
- 208 rooms
- 79+ rooms

- Rooms in renter-occupied apartments in Edward Vincent Jr Park
- 71 room
- 302 rooms
- 323 rooms
- 324 rooms
- 235 rooms
- 66 rooms
- 107 rooms
- 08 rooms
- 09+ rooms
Owner-occupied
Renter-occupied

- Bedrooms in owner-occupied houses and condos in Edward Vincent Jr Park
- 0no bedroom
- 31 bedroom
- 302 bedrooms
- 863 bedrooms
- 384 bedrooms
- 55+ bedrooms

- Bedrooms in renter-occupied apartments in Edward Vincent Jr Park
- 16no bedroom
- 371 bedroom
- 282 bedrooms
- 333 bedrooms
- 74 bedrooms
- 05+ bedrooms
Average number of cars or other vehicles available in houses/condos:
Average number of cars or other vehicles available in apartments:
| This neighborhood: | 2.1 |
| Inglewood: | 2.2 |
Average number of cars or other vehicles available in apartments:
| Here: | 2.4 |
| city: | 1.4 |
Percentage of units with a mortgage:
| Edward Vincent Jr Park: | 45.6% |
| Inglewood: | 75.5% |
Housing prices:
- Average estimated value of detached houses in 2022 (58.4% of all units):
Edward Vincent Jr Park: $682,641 California: $988,808
- Average estimated value of townhouses or other attached units in 2022 (19.0% of all units):
This neighborhood: $476,275 California: $838,546

- Year house built in Edward Vincent Jr Park
- 02020 or later
- 32010 to 2019
- 32000 to 2009
- 51990 to 1999
- 21980 to 1989
- 211970 to 1979
- 461960 to 1969
- 441950 to 1959
- 431940 to 1949
- 1051939 or earlier

City-data.com crime index for city in 2020 (higher means more crime):
| City: | 332.1 |
| U.S. average: | 219.5 |
Travel time to work (commute)
![Travel time to work (commute)]()
- 4Less than 5 minutes
- 85 to 9 minutes
- 1110 to 14 minutes
- 4715 to 19 minutes
- 6120 to 24 minutes
- 2525 to 29 minutes
- 5730 to 34 minutes
- 1635 to 39 minutes
- 2340 to 44 minutes
- 3045 to 59 minutes
- 4360 to 89 minutes
- 590 or more minutes

Means of transportation to work
![Means of transportation to work]()
- 72.3%298Drove a car alone
- 9.0%37Carpooled
- 2.7%11Bus
- 5.3%22Subway or elevated rail
- 1.5%6Light rail, streetcar or trolley
- 6.5%27Taxi
- 8.7%36Motorcycle
- 1.0%4Walked
- 4.4%18Other means
- 14.8%61Worked at home

Time leaving home to go to work
![Time leaving home to go to work]()
- 2512:00 a.m. to 4:59 a.m.
- 195:00 a.m. to 5:29 a.m.
- 105:30 a.m. to 5:59 a.m.
- 196:00 a.m. to 6:29 a.m.
- 296:30 a.m. to 6:59 a.m.
- 547:00 a.m. to 7:29 a.m.
- 187:30 a.m. to 7:59 a.m.
- 438:00 a.m. to 8:29 a.m.
- 108:30 a.m. to 8:59 a.m.
- 169:00 a.m. to 9:59 a.m.
- 2010:00 a.m. to 10:59 a.m.
- 111:00 a.m. to 11:59 a.m.
- 4312:00 p.m. to 3:59 p.m.
- 404:00 p.m. to 11:59 p.m.

Occupations of males:
- Percentage of males in management occupations (except farmers):
Here: 1.3% city: 7.0%
- Percentage of males in computer and mathematical occupations:
Here: 1.2% city: 2.6%
- Percentage of males in architecture and engineering occupations:
Here: 1.3% city: 1.4%
- Percentage of males in arts, design, entertainment, sports, and media occupations:
Here: 1.4% city: 3.3%
- Percentage of males in service occupations:
Here: 30.0% city: 24.3%
- Percentage of males in sales and office occupations:
Here: 12.4% city: 18.5%
- Percentage of males in construction, extraction, and maintenance occupations:
Here: 15.0% city: 8.9%
- Percentage of males in production occupations:
Here: 11.0% city: 4.6%
- Percentage of males in transportation occupations:
Here: 8.0% city: 9.0%
- Percentage of males in material moving occupations:
Here: 8.6% city: 7.0%
Occupations of females:
- Percentage of females in management occupations (except farmers):
Here: 2.4% city: 7.8%
- Percentage of females in legal occupations:
Here: 1.3% city: 0.6%
- Percentage of females in education, training, and library occupations:
Here: 20.3% city: 7.9%
- Percentage of females in arts, design, entertainment, sports, and media occupations:
Here: 1.6% city: 1.7%
- Percentage of females in healthcare practitioners and technical occupations:
Here: 4.7% city: 4.3%
- Percentage of females in service occupations:
Here: 34.7% city: 25.6%
- Percentage of females in sales and office occupations:
Here: 32.3% city: 31.5%
- Percentage of females in production occupations:
Here: 2.2% city: 3.8%
Education in this neighborhood (subdivision or community):
- Percentage of people 3 years and older in K-12 schools:
Edward Vincent Jr Park: 14.7% Inglewood: 16.4%
- Percentage of people 3 years and older in undergraduate colleges:
Edward Vincent Jr Park: 9.3% Inglewood: 6.3%
- Percentage of people 3 years and older in grad. or professional schools:
Edward Vincent Jr Park: 4.6% Inglewood: 1.2%
- Percentage of students K-12 enrolled in private schools:
Edward Vincent Jr Park: 20.8% Inglewood: 8.4%
Percentage of population below poverty level:
| Edward Vincent Jr Park: | 12.0% |
| Inglewood: | 16.2% |
Median year owner moved in (as recorded in 2022):
Median year renter moved in (as recorded in 2022):
| Edward Vincent Jr Park: | 2002 |
| Inglewood: | 2001 |
Median year renter moved in (as recorded in 2022):
| Edward Vincent Jr Park: | 2014 |
| Inglewood: | 2016 |
Percentage of married-couple families with both working:
| Edward Vincent Jr Park: | 47.9% |
| Inglewood: | 63.0% |

- 49.2%Utility gas
- 29.3%Electricity
- 13.2%No fuel used
- 3.1%Other fuel
- 2.9%Coal or coke
- 2.4%Bottled, tank, or LP gas
Roads and streets:
E Florence Ave
Length: 0.33 miles
Direction: SW-NE
Address range: 551 to 799
Direction: SW-NE
Address range: 551 to 799
Centinela Ave
Length: 0.09 miles
Direction: SE-NW
Address range: 305 to 323
Direction: SE-NW
Address range: 305 to 323