El Cid neighborhood in West Palm Beach, Florida (FL), 33401, 33405 detailed profile
Settings
X


Business Search - 14 Million verified businesses
Area: 0.150 square miles
Population: 557
Population density:
| El Cid: | 3,724 people per square mile |
| West Palm Beach: | 2,193 people per square mile |

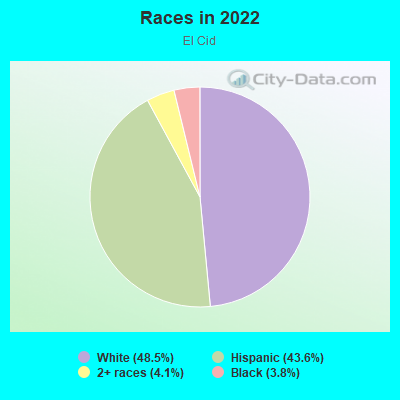
- 26948.5%White
- 24243.6%Hispanic or Latino
- 234.1%Two or more races
- 213.8%Black
Median household income in 2022:
| El Cid: | $56,519 |
| West Palm Beach: | $71,138 |
Distribution of median household income
![Distribution of median household income]()
- 17Less than $10,000
- 39$10,000 to $19,999
- 14$20,000 to $29,999
- 36$30,000 to $39,999
- 12$40,000 to $49,999
- 37$50,000 to $59,999
- 8$60,000 to $74,999
- 37$75,000 to $99,999
- 26$100,000 to $124,999
- 9$125,000 to $149,999
- 3$150,000 to $199,999
- 32$200,000 or more

Distribution of owner-occupied house/condo value
![Distribution of owner-occupied house/condo value]()
- 7Less than $50,000
- 11$50,000 to $99,999
- 19$100,000 to $149,999
- 14$200,000 to $249,999
- 9$250,000 to $299,999
- 8$300,000 to $399,999
- 8$400,000 to $499,999
- 12$500,000 to $749,999
- 4$750,000 to $999,999
- 40$1,000,000 or more

Distribution of rent paid by renters
![Distribution of rent paid by renters]()
- 25$100 to $199
- 7$400 to $499
- 39$600 to $699
- 33$800 to $899
- 26$900 to $999
- 55$1,000 to $1,249
- 11$1,250 to $1,499
- 22$1,500 to $1,999
- 14$2,000 or more

Median rent in 2022:
| El Cid: | $1,053 |
| West Palm Beach: | $1,483 |
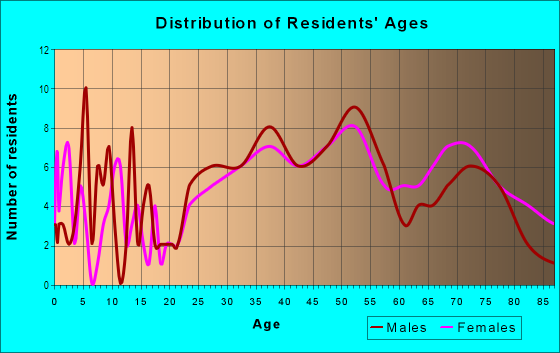
| Males: | 287 |
| Females: | 270 |
Males:
| This neighborhood: | 40.0 years |
| Whole city: | 38.9 years |
| This neighborhood: | 39.4 years |
| Whole city: | 40.1 years |
Average household size:
| El Cid: | 2.3 people |
| West Palm Beach: | 2.3 people |
Percentage of family households:
| El Cid: | 33.2% |
| West Palm Beach: | 39.6% |
| Here: | 39.0% |
| West Palm Beach: | 36.3% |
Percentage of married-couple families with children (among all households):
| El Cid: | 22.5% |
| West Palm Beach: | 21.3% |
Percentage of single-mother households (among all households):
| El Cid: | 16.3% |
| West Palm Beach: | 14.4% |
Percentage of never married males 15 years old and over:
Percentage of never married females 15 years old and over:
| El Cid: | 25.9% |
| West Palm Beach: | 20.4% |
Percentage of never married females 15 years old and over:
| El Cid: | 16.2% |
| city: | 16.4% |
Percentage of people that speak English not well or not at all:
| El Cid: | 22.8% |
| West Palm Beach: | 7.4% |
Percentage of people born in this state:
Percentage of people born in another U.S. state:
Percentage of native residents but born outside the U.S.:
Percentage of foreign born residents:
| Here: | 39.2% |
| West Palm Beach: | 37.9% |
Percentage of people born in another U.S. state:
| El Cid: | 31.5% |
| West Palm Beach: | 31.7% |
Percentage of native residents but born outside the U.S.:
| Here: | 1.1% |
| city: | 2.5% |
Percentage of foreign born residents:
| Here: | 28.2% |
| West Palm Beach: | 27.9% |
Owner-occupied
Renter-occupied

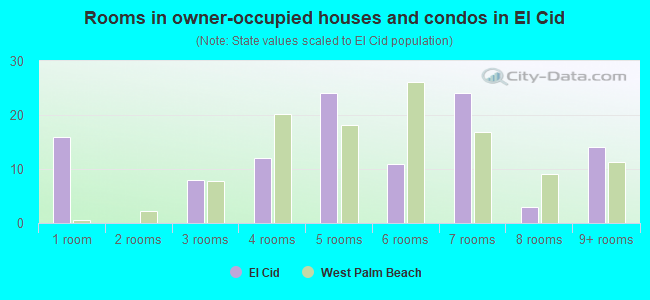
- Rooms in owner-occupied houses and condos in El Cid
- 161 room
- 02 rooms
- 83 rooms
- 124 rooms
- 245 rooms
- 116 rooms
- 247 rooms
- 38 rooms
- 149+ rooms
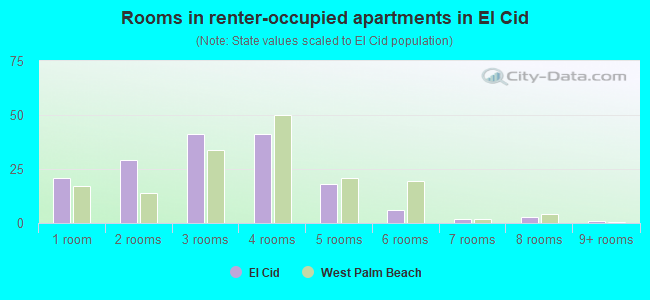
- Rooms in renter-occupied apartments in El Cid
- 211 room
- 292 rooms
- 413 rooms
- 414 rooms
- 185 rooms
- 66 rooms
- 27 rooms
- 38 rooms
- 19+ rooms
Owner-occupied
Renter-occupied
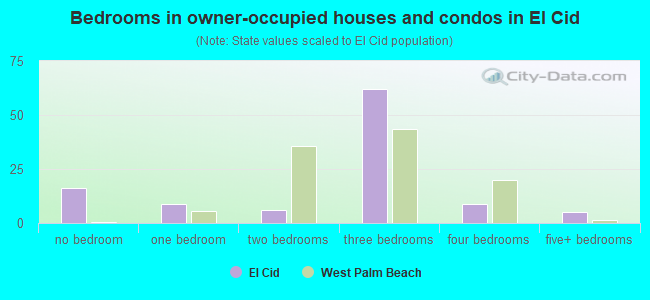
- Bedrooms in owner-occupied houses and condos in El Cid
- 16no bedroom
- 91 bedroom
- 62 bedrooms
- 623 bedrooms
- 94 bedrooms
- 55+ bedrooms
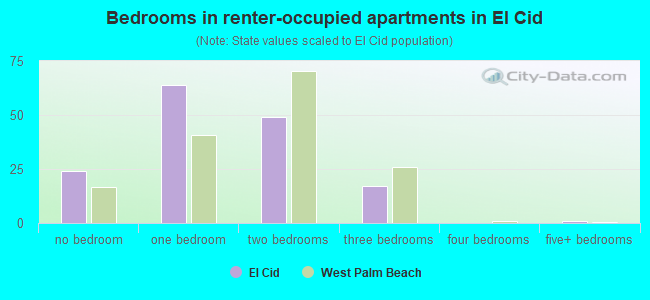
- Bedrooms in renter-occupied apartments in El Cid
- 24no bedroom
- 641 bedroom
- 492 bedrooms
- 173 bedrooms
- 04 bedrooms
- 15+ bedrooms
Average number of cars or other vehicles available in houses/condos:
Average number of cars or other vehicles available in apartments:
| This neighborhood: | 1.8 |
| West Palm Beach: | 1.8 |
Average number of cars or other vehicles available in apartments:
| Here: | 1.2 |
| city: | 1.3 |
Percentage of units with a mortgage:
| El Cid: | 63.8% |
| West Palm Beach: | 58.1% |
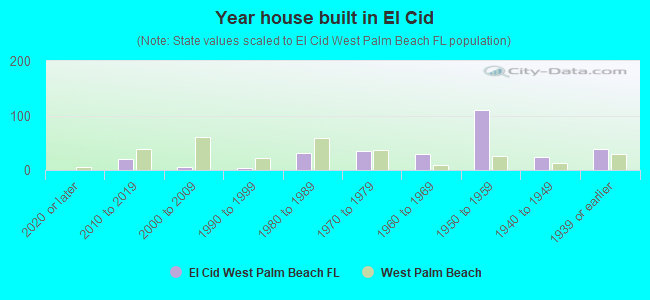
- Year house built in El Cid
- 02020 or later
- 212010 to 2019
- 52000 to 2009
- 41990 to 1999
- 321980 to 1989
- 351970 to 1979
- 301960 to 1969
- 1111950 to 1959
- 231940 to 1949
- 381939 or earlier

City-data.com crime index for city in 2020 (higher means more crime):
| City: | 405.6 |
| U.S. average: | 219.5 |
Travel time to work (commute)
![Travel time to work (commute)]()
- 5Less than 5 minutes
- 995 to 9 minutes
- 8310 to 14 minutes
- 13815 to 19 minutes
- 5820 to 24 minutes
- 3225 to 29 minutes
- 10930 to 34 minutes
- 2940 to 44 minutes
- 1845 to 59 minutes
- 2960 to 89 minutes
- 390 or more minutes

Means of transportation to work
![Means of transportation to work]()
- 68.8%210Drove a car alone
- 7.2%22Carpooled
- 4.6%14Bus
- 6.2%19Bicycle
- 2.6%8Walked
- 7.5%23Other means
- 8.2%25Worked at home

Time leaving home to go to work
![Time leaving home to go to work]()
- 155:00 a.m. to 5:29 a.m.
- 85:30 a.m. to 5:59 a.m.
- 576:00 a.m. to 6:29 a.m.
- 236:30 a.m. to 6:59 a.m.
- 707:00 a.m. to 7:29 a.m.
- 707:30 a.m. to 7:59 a.m.
- 1188:00 a.m. to 8:29 a.m.
- 908:30 a.m. to 8:59 a.m.
- 1009:00 a.m. to 9:59 a.m.
- 1710:00 a.m. to 10:59 a.m.
- 2512:00 p.m. to 3:59 p.m.
- 264:00 p.m. to 11:59 p.m.

Occupations of males:
- Percentage of males in management occupations (except farmers):
Here: 17.2% city: 12.5%
- Percentage of males in business and financial operations occupations:
Here: 1.2% city: 4.5%
- Percentage of males in computer and mathematical occupations:
Here: 4.8% city: 2.8%
- Percentage of males in architecture and engineering occupations:
Here: 1.4% city: 2.2%
- Percentage of males in community and social services occupations:
Here: 2.0% city: 1.3%
- Percentage of males in legal occupations:
Here: 6.4% city: 1.9%
- Percentage of males in arts, design, entertainment, sports, and media occupations:
Here: 1.4% city: 4.0%
- Percentage of males in service occupations:
Here: 16.3% city: 17.5%
- Percentage of males in sales and office occupations:
Here: 10.5% city: 15.6%
- Percentage of males in construction, extraction, and maintenance occupations:
Here: 36.6% city: 12.2%
- Percentage of males in transportation occupations:
Here: 1.4% city: 5.6%
- Percentage of males in material moving occupations:
Here: 4.0% city: 5.5%
Occupations of females:
- Percentage of females in management occupations (except farmers):
Here: 8.9% city: 8.9%
- Percentage of females in business and financial operations occupations:
Here: 11.3% city: 5.5%
- Percentage of females in computer and mathematical occupations:
Here: 7.7% city: 2.8%
- Percentage of females in life, physical, and social science occupations:
Here: 7.9% city: 1.8%
- Percentage of females in legal occupations:
Here: 5.5% city: 1.2%
- Percentage of females in education, training, and library occupations:
Here: 10.0% city: 7.6%
- Percentage of females in arts, design, entertainment, sports, and media occupations:
Here: 8.9% city: 3.1%
- Percentage of females in healthcare practitioners and technical occupations:
Here: 1.4% city: 9.1%
- Percentage of females in service occupations:
Here: 19.9% city: 23.9%
- Percentage of females in sales and office occupations:
Here: 31.1% city: 26.2%
- Percentage of females in production occupations:
Here: 3.3% city: 2.3%
- Percentage of females in transportation occupations:
Here: 6.4% city: 1.3%
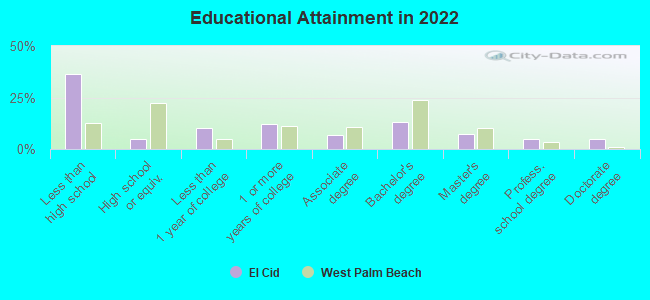
Education in this neighborhood (subdivision or community):
- Percentage of people 3 years and older in K-12 schools:
El Cid: 29.4% West Palm Beach: 14.0%
- Percentage of people 3 years and older in undergraduate colleges:
El Cid: 3.7% West Palm Beach: 4.7%
- Percentage of people 3 years and older in grad. or professional schools:
El Cid: 3.9% West Palm Beach: 1.3%
- Percentage of students K-12 enrolled in private schools:
El Cid: 65.0% West Palm Beach: 21.8%
Percentage of population below poverty level:
| El Cid: | 11.0% |
| West Palm Beach: | 14.5% |
Median year owner moved in (as recorded in 2022):
Median year renter moved in (as recorded in 2022):
| El Cid: | 2011 |
| West Palm Beach: | 2013 |
Median year renter moved in (as recorded in 2022):
| El Cid: | 2017 |
| West Palm Beach: | 2020 |
Percentage of married-couple families with both working:
| El Cid: | 68.0% |
| West Palm Beach: | 72.9% |
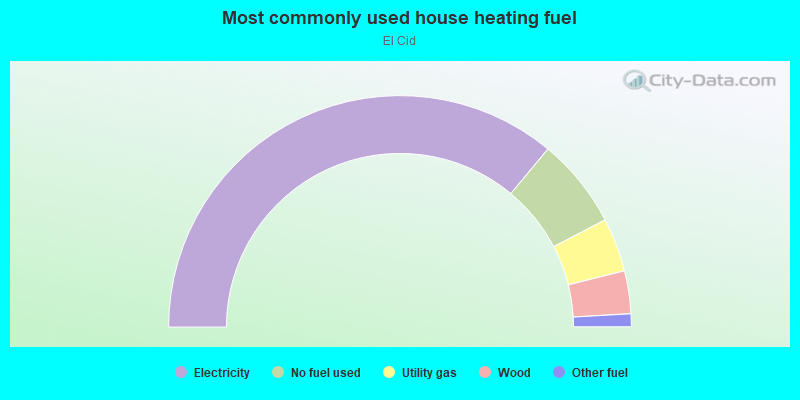
- 72.1%Electricity
- 12.6%No fuel used
- 7.5%Utility gas
- 6.0%Wood
- 1.8%Other fuel
Highways in this neighborhood:
US Hwy 1 (State Hwy 5, Federal Hwy, S Olive Ave)
Length: 0.53 miles
Direction: N-S
Address range: 2000 to 2799
Direction: N-S
Address range: 2000 to 2799
Roads and streets:
S Flagler Dr
Length: 0.49 miles
Directions: N-S, SE-NW
Address range: 2100 to 2799
Directions: N-S, SE-NW
Address range: 2100 to 2799
Sunset Rd
Length: 0.20 miles
Direction: E-W
Address range: 100 to 299
Direction: E-W
Address range: 100 to 299
Valencia Rd
Length: 0.20 miles
Direction: E-W
Address range: 100 to 299
Direction: E-W
Address range: 100 to 299
Pershing Way
Length: 0.19 miles
Direction: E-W
Address range: 100 to 298
Direction: E-W
Address range: 100 to 298
Almeria Rd
Length: 0.18 miles
Direction: E-W
Address range: 100 to 299
Direction: E-W
Address range: 100 to 299
Belmonte Rd
Length: 0.18 miles
Direction: E-W
Address range: 100 to 299
Direction: E-W
Address range: 100 to 299
Barcelona Rd
Length: 0.18 miles
Direction: E-W
Address range: 200 to 299
Direction: E-W
Address range: 200 to 299
Granada Rd
Length: 0.17 miles
Direction: E-W
Address range: 200 to 299
Direction: E-W
Address range: 200 to 299
Cordova Rd
Length: 0.17 miles
Direction: E-W
Address range: 200 to 299
Direction: E-W
Address range: 200 to 299
Flamingo Dr
Length: 0.09 miles
Direction: E-W
Address range: 200 to 299
Direction: E-W
Address range: 200 to 299
Aravale Rd
Length: 0.09 miles
Directions: N-S, SW-NE
Address range: 2400 to 2499
Directions: N-S, SW-NE
Address range: 2400 to 2499
Medina Way
Length: 0.09 miles
Direction: N-S
Address range: 2400 to 2499
Direction: N-S
Address range: 2400 to 2499