El Nido neighborhood in Mc Lean, Virginia (VA), 22101 detailed profile
Settings
X


Area: 0.095 square miles
Population: 282
Population density: 2,959 people per square mile

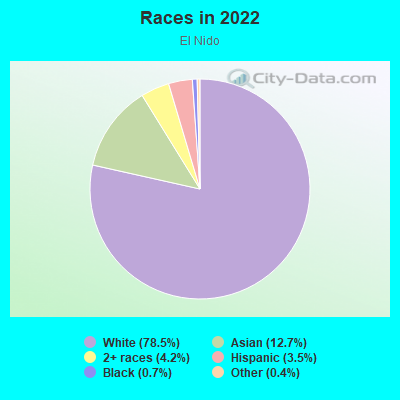
- 22378.5%White
- 3612.7%Asian
- 124.2%Two or more races
- 103.5%Hispanic or Latino
- 20.7%Black
- 10.4%Some other race
Median household income in 2022:
| El Nido: | $245,176 |
| Virginia: | $85,873 |
Distribution of median household income
![Distribution of median household income]()
- 4Less than $10,000
- 1$10,000 to $19,999
- 3$30,000 to $39,999
- 5$40,000 to $49,999
- 3$50,000 to $59,999
- 4$60,000 to $74,999
- 5$75,000 to $99,999
- 5$100,000 to $124,999
- 12$125,000 to $149,999
- 25$150,000 to $199,999
- 62$200,000 or more

Distribution of owner-occupied house/condo value
![Distribution of owner-occupied house/condo value]()
- 2$150,000 to $199,999
- 3$500,000 to $749,999
- 41$750,000 to $999,999
- 50$1,000,000 or more

Distribution of rent paid by renters
![Distribution of rent paid by renters]()
- 3$500 to $599
- 11$1,500 to $1,999
- 13$2,000 or more

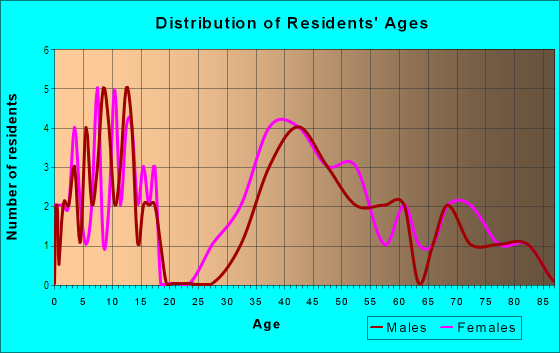
| Males: | 145 |
| Females: | 136 |
| Males: | 49.3 years |
| Females: | 43.2 years |
Average household size:
| El Nido: | 15.3 people |
| Virginia: | 2.5 people |
Percentage of family households:
| El Nido: | 53.0% |
| Virginia: | 45.8% |
| Here: | 77.4% |
| Virginia: | 48.6% |
Percentage of married-couple families with children (among all households):
| El Nido: | 32.4% |
| Virginia: | 54.3% |
Percentage of single-mother households (among all households):
| El Nido: | 2.8% |
| Virginia: | 8.2% |
Percentage of never married males 15 years old and over:
Percentage of never married females 15 years old and over:
| El Nido: | 7.8% |
| Virginia: | 17.6% |
Percentage of never married females 15 years old and over:
| El Nido: | 11.5% |
| Virginia: | 15.6% |
Percentage of people that speak English not well or not at all:
| El Nido: | 3.3% |
| Virginia: | 2.6% |
Percentage of people born in this state:
Percentage of people born in another U.S. state:
Percentage of native residents but born outside the U.S.:
Percentage of foreign born residents:
| Here: | 22.0% |
| Virginia: | 48.7% |
Percentage of people born in another U.S. state:
| El Nido: | 47.5% |
| Virginia: | 36.4% |
Percentage of native residents but born outside the U.S.:
| Here: | 4.2% |
| Virginia: | 2.1% |
Percentage of foreign born residents:
| Here: | 26.3% |
| Virginia: | 12.7% |
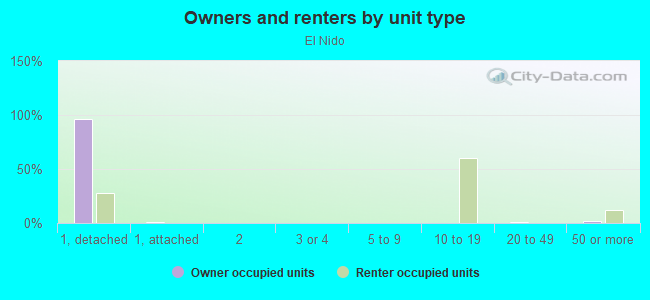
Owner-occupied
Renter-occupied

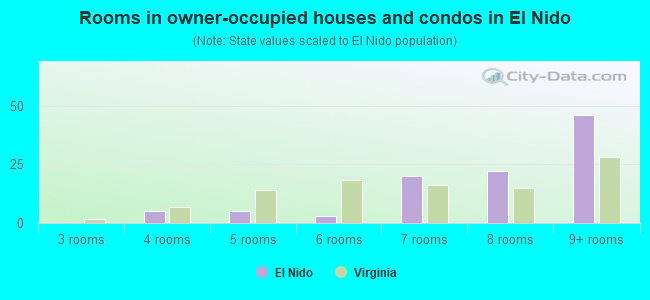
- Rooms in owner-occupied houses and condos in El Nido
- 01 room
- 02 rooms
- 03 rooms
- 54 rooms
- 55 rooms
- 36 rooms
- 207 rooms
- 228 rooms
- 469+ rooms
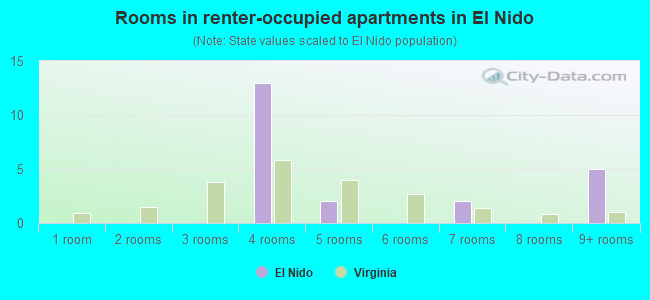
- Rooms in renter-occupied apartments in El Nido
- 01 room
- 02 rooms
- 03 rooms
- 134 rooms
- 25 rooms
- 06 rooms
- 27 rooms
- 08 rooms
- 59+ rooms
Owner-occupied
Renter-occupied
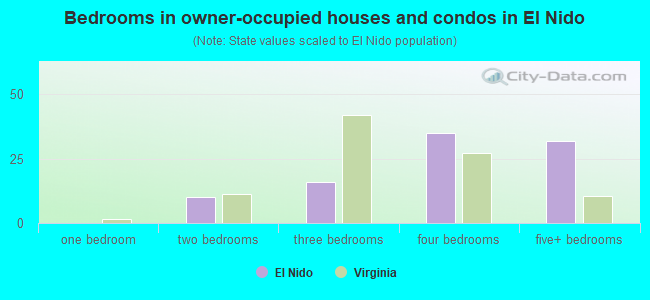
- Bedrooms in owner-occupied houses and condos in El Nido
- 0no bedroom
- 01 bedroom
- 102 bedrooms
- 163 bedrooms
- 354 bedrooms
- 325+ bedrooms
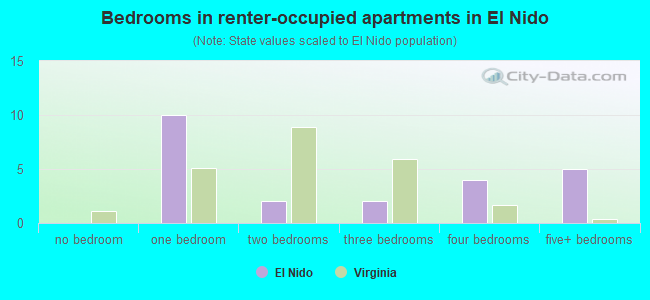
- Bedrooms in renter-occupied apartments in El Nido
- 0no bedroom
- 101 bedroom
- 22 bedrooms
- 23 bedrooms
- 44 bedrooms
- 55+ bedrooms
Average number of cars or other vehicles available in houses/condos:
Average number of cars or other vehicles available in apartments:
| This neighborhood: | 3.0 |
| Virginia: | 2.2 |
Average number of cars or other vehicles available in apartments:
| Here: | 4.2 |
| Virginia: | 1.4 |
Percentage of units with a mortgage:
| El Nido: | 61.9% |
| Virginia: | 66.9% |
Average estimated value of detached houses in 2022 (100.0% of all units):
| El Nido: | $1,501,575 |
| Virginia: | $472,865 |
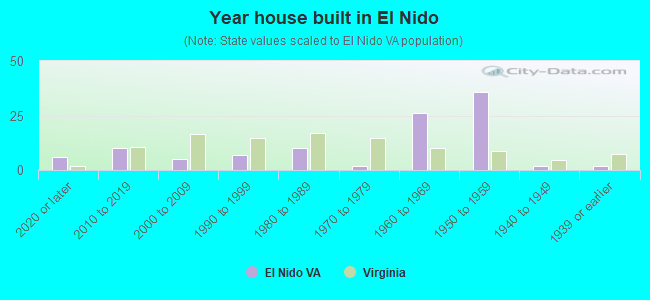
- Year house built in El Nido
- 62020 or later
- 102010 to 2019
- 52000 to 2009
- 71990 to 1999
- 101980 to 1989
- 21970 to 1979
- 261960 to 1969
- 361950 to 1959
- 21940 to 1949
- 21939 or earlier
Travel time to work (commute)
![Travel time to work (commute)]()
- 1Less than 5 minutes
- 75 to 9 minutes
- 610 to 14 minutes
- 1815 to 19 minutes
- 3320 to 24 minutes
- 1125 to 29 minutes
- 2530 to 34 minutes
- 235 to 39 minutes
- 940 to 44 minutes
- 445 to 59 minutes
- 1060 to 89 minutes
- 190 or more minutes

Means of transportation to work
![Means of transportation to work]()
- 65.4%102Drove a car alone
- 6.4%10Carpooled
- 6.4%10Subway or elevated rail
- 3.8%6Taxi
- 1.3%2Walked
- 1.3%2Other means
- 23.1%36Worked at home

Time leaving home to go to work
![Time leaving home to go to work]()
- 15:30 a.m. to 5:59 a.m.
- 106:30 a.m. to 6:59 a.m.
- 217:00 a.m. to 7:29 a.m.
- 167:30 a.m. to 7:59 a.m.
- 248:00 a.m. to 8:29 a.m.
- 178:30 a.m. to 8:59 a.m.
- 249:00 a.m. to 9:59 a.m.
- 910:00 a.m. to 10:59 a.m.
- 712:00 p.m. to 3:59 p.m.
- 44:00 p.m. to 11:59 p.m.

Occupations of males:
- Percentage of males in management occupations (except farmers):
Here: 25.5% Virginia: 13.4%
- Percentage of males in business and financial operations occupations:
Here: 14.7% Virginia: 6.5%
- Percentage of males in computer and mathematical occupations:
Here: 3.0% Virginia: 8.6%
- Percentage of males in life, physical, and social science occupations:
Here: 2.3% Virginia: 1.3%
- Percentage of males in legal occupations:
Here: 5.5% Virginia: 1.6%
- Percentage of males in education, training, and library occupations:
Here: 2.0% Virginia: 3.3%
- Percentage of males in arts, design, entertainment, sports, and media occupations:
Here: 6.1% Virginia: 1.9%
- Percentage of males in healthcare practitioners and technical occupations:
Here: 12.3% Virginia: 2.4%
- Percentage of males in service occupations:
Here: 4.3% Virginia: 13.3%
- Percentage of males in sales and office occupations:
Here: 8.4% Virginia: 13.4%
- Percentage of males in construction, extraction, and maintenance occupations:
Here: 11.5% Virginia: 8.2%
- Percentage of males in transportation occupations:
Here: 3.9% Virginia: 5.5%
Occupations of females:
- Percentage of females in management occupations (except farmers):
Here: 15.8% Virginia: 10.8%
- Percentage of females in business and financial operations occupations:
Here: 9.3% Virginia: 8.3%
- Percentage of females in computer and mathematical occupations:
Here: 3.5% Virginia: 3.6%
- Percentage of females in life, physical, and social science occupations:
Here: 4.5% Virginia: 1.3%
- Percentage of females in community and social services occupations:
Here: 3.1% Virginia: 2.7%
- Percentage of females in legal occupations:
Here: 1.3% Virginia: 1.6%
- Percentage of females in education, training, and library occupations:
Here: 14.7% Virginia: 10.1%
- Percentage of females in arts, design, entertainment, sports, and media occupations:
Here: 7.1% Virginia: 2.2%
- Percentage of females in healthcare practitioners and technical occupations:
Here: 11.7% Virginia: 9.1%
- Percentage of females in service occupations:
Here: 6.2% Virginia: 18.5%
- Percentage of females in sales and office occupations:
Here: 27.2% Virginia: 24.7%
Percentage of people 16-64 in Armed Forces:
| El Nido: | 0.6% |
| Virginia: | 2.5% |
Education in this neighborhood (subdivision or community):
- Percentage of people 3 years and older in K-12 schools:
El Nido: 27.1% Virginia: 16.3%
- Percentage of people 3 years and older in undergraduate colleges:
El Nido: 3.3% Virginia: 5.4%
- Percentage of people 3 years and older in grad. or professional schools:
El Nido: 4.8% Virginia: 1.8%
- Percentage of students K-12 enrolled in private schools:
El Nido: 28.4% Virginia: 12.5%
Percentage of population below poverty level:
| El Nido: | 1.8% |
| Virginia: | 10.6% |
Median year owner moved in (as recorded in 2022):
| El Nido: | 2005 |
| Virginia: | 2011 |
Percentage of married-couple families with both working:
| El Nido: | 70.9% |
| Virginia: | 73.3% |
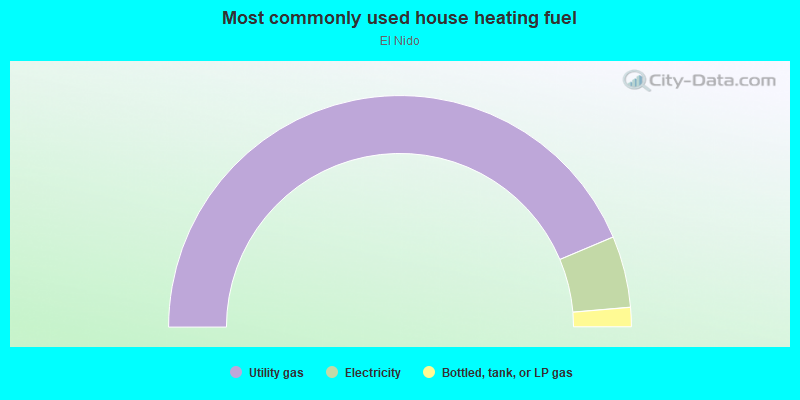
- 87.3%Utility gas
- 10.0%Electricity
- 2.7%Bottled, tank, or LP gas
Roads and streets:
Elnido Dr
Length: 0.45 miles
Directions: E-W, SE-NW
Address range: 6400 to 6699
Directions: E-W, SE-NW
Address range: 6400 to 6699
Fairlawn Dr
Length: 0.38 miles
Directions: E-W, SE-NW
Address range: 6500 to 6699
Directions: E-W, SE-NW
Address range: 6500 to 6699
Dalewood Pl
Length: 0.11 miles
Directions: N-S, SW-NE
Address range: 1700 to 1799
Directions: N-S, SW-NE
Address range: 1700 to 1799
Barbee St
Length: 0.10 miles
Directions: E-W, SW-NE
Address range: 1700 to 1798
Directions: E-W, SW-NE
Address range: 1700 to 1798
Dryden Dr
Length: 0.10 miles
Directions: N-S, SW-NE
Address range: 6519 to 6599
Directions: N-S, SW-NE
Address range: 6519 to 6599
Meca Ct
Length: 0.04 miles
Directions: N-S, SW-NE
Address range: 1700 to 1799
Directions: N-S, SW-NE
Address range: 1700 to 1799
Birch Rd
Length: 0.04 miles
Direction: SW-NE
Address range: 1728 to 1803
Direction: SW-NE
Address range: 1728 to 1803
Chateau Ct
Length: 0.04 miles
Directions: N-S, SE-NW
Address range: 1700 to 1799
Directions: N-S, SE-NW
Address range: 1700 to 1799
Other features:
Pimmit Run
Length: 0.01 miles
Directions: E-W, SW-NE
Directions: E-W, SW-NE