Elmhurst neighborhood in Topeka, Kansas (KS), 66604 detailed profile
Settings
X

Business Search - 14 Million verified businesses
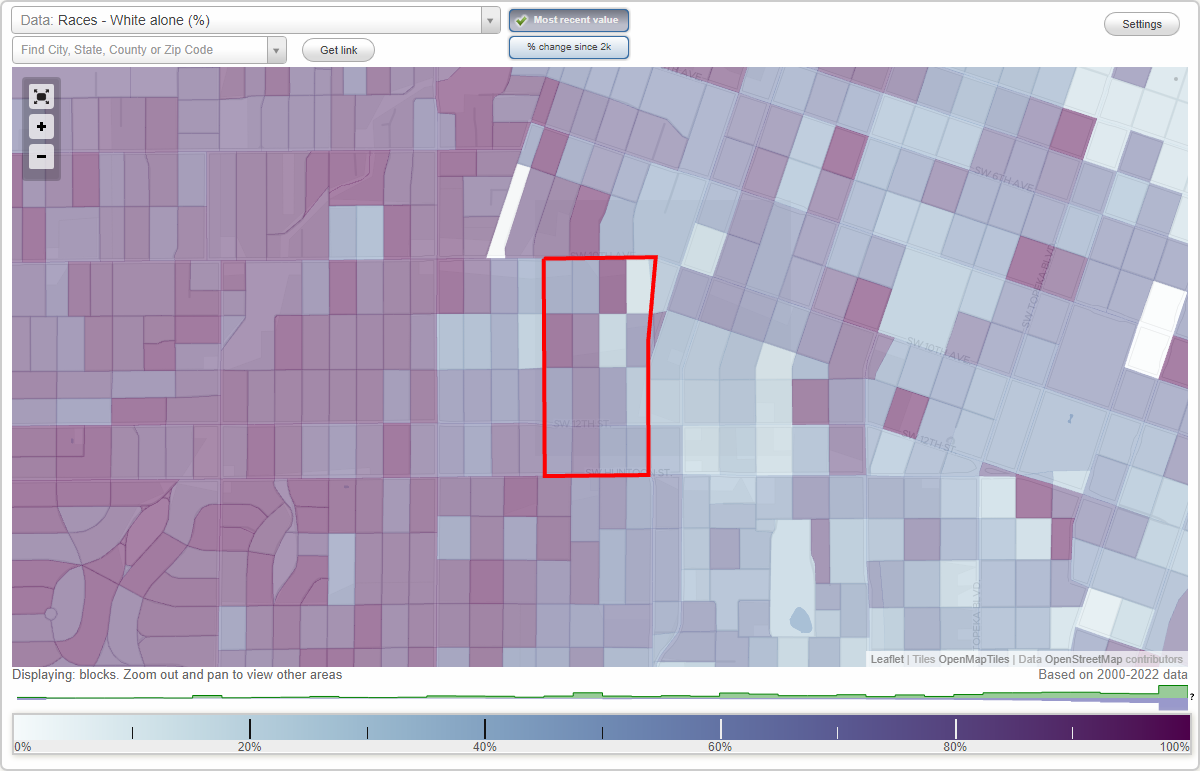
Area: 0.122 square miles
Population: 653
Population density:
| Elmhurst: | 5,363 people per square mile |
| Topeka: | 2,240 people per square mile |

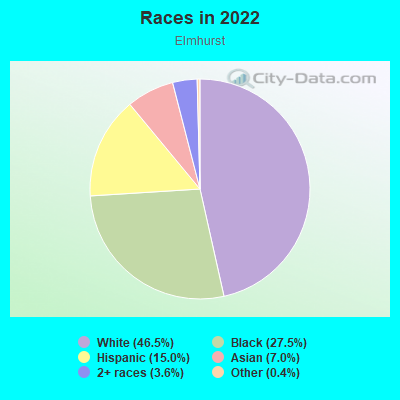
- 50373.3%White
- 6910.1%Hispanic or Latino
- 558.0%Black
- 436.3%Two or more races
- 81.2%American Indian
- 60.9%Asian
- 20.3%Some other race
Median household income in 2022:
| Elmhurst: | $63,037 |
| Topeka: | $50,709 |
Distribution of median household income
![Distribution of median household income]()
- 9Less than $10,000
- 40$10,000 to $19,999
- 47$20,000 to $29,999
- 40$30,000 to $39,999
- 38$40,000 to $49,999
- 28$50,000 to $59,999
- 16$60,000 to $74,999
- 50$75,000 to $99,999
- 24$100,000 to $124,999
- 52$125,000 to $149,999
- 21$150,000 to $199,999
- 15$200,000 or more

Distribution of owner-occupied house/condo value
![Distribution of owner-occupied house/condo value]()
- 51Less than $50,000
- 102$50,000 to $99,999
- 45$100,000 to $149,999
- 24$150,000 to $199,999
- 6$200,000 to $249,999
- 3$500,000 to $749,999

Distribution of rent paid by renters
![Distribution of rent paid by renters]()
- 4Less than $100
- 16$100 to $199
- 9$200 to $299
- 8$300 to $399
- 30$400 to $499
- 34$500 to $599
- 28$600 to $699
- 87$700 to $799
- 14$800 to $899
- 17$900 to $999
- 25$1,000 to $1,249
- 19$1,250 to $1,499
- 3$1,500 to $1,999
- 11$2,000 or more

Median rent in 2022:
| Elmhurst: | $802 |
| Topeka: | $670 |
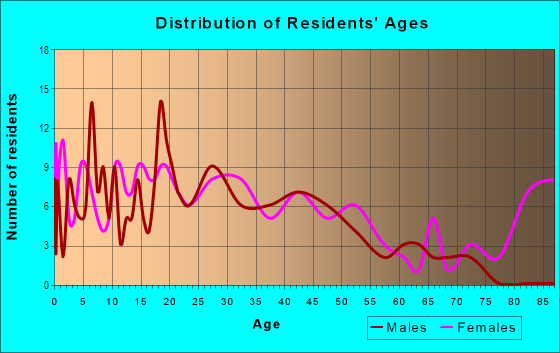
| Males: | 391 |
| Females: | 262 |
Males:
| This neighborhood: | 33.3 years |
| Whole city: | 37.1 years |
| This neighborhood: | 32.6 years |
| Whole city: | 38.8 years |
Average household size:
| Elmhurst: | 2.5 people |
| Topeka: | 2.2 people |
Percentage of family households:
| Elmhurst: | 51.1% |
| Topeka: | 38.2% |
| Here: | 53.8% |
| Topeka: | 35.2% |
Percentage of married-couple families with children (among all households):
| Elmhurst: | 45.6% |
| Topeka: | 27.5% |
Percentage of single-mother households (among all households):
| Elmhurst: | 7.4% |
| Topeka: | 10.7% |
Percentage of never married males 15 years old and over:
Percentage of never married females 15 years old and over:
| Elmhurst: | 24.9% |
| Topeka: | 19.2% |
Percentage of never married females 15 years old and over:
| Elmhurst: | 11.9% |
| city: | 17.5% |
Percentage of people that speak English not well or not at all:
| Elmhurst: | 0.0% |
| Topeka: | 2.2% |
Percentage of people born in this state:
Percentage of people born in another U.S. state:
Percentage of native residents but born outside the U.S.:
Percentage of foreign born residents:
| Here: | 72.4% |
| Topeka: | 67.1% |
Percentage of people born in another U.S. state:
| Elmhurst: | 21.7% |
| Topeka: | 25.0% |
Percentage of native residents but born outside the U.S.:
| Here: | 1.1% |
| city: | 1.7% |
Percentage of foreign born residents:
| Here: | 4.8% |
| Topeka: | 6.3% |
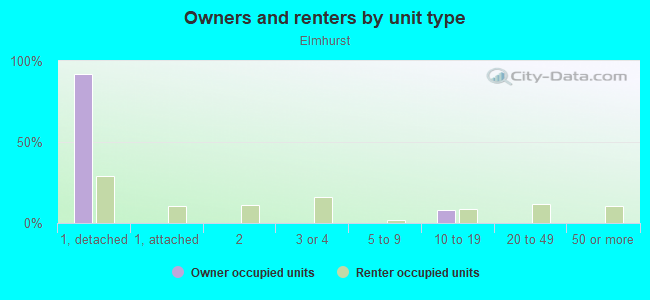
Owner-occupied
Renter-occupied

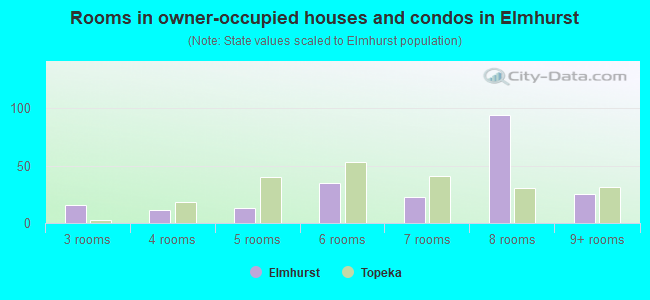
- Rooms in owner-occupied houses and condos in Elmhurst
- 01 room
- 02 rooms
- 163 rooms
- 114 rooms
- 135 rooms
- 356 rooms
- 237 rooms
- 948 rooms
- 259+ rooms
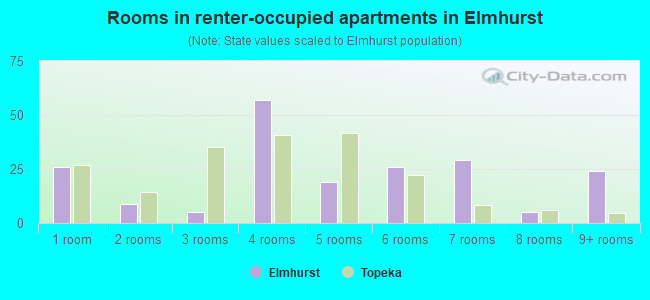
- Rooms in renter-occupied apartments in Elmhurst
- 261 room
- 92 rooms
- 53 rooms
- 574 rooms
- 195 rooms
- 266 rooms
- 297 rooms
- 58 rooms
- 249+ rooms
Owner-occupied
Renter-occupied
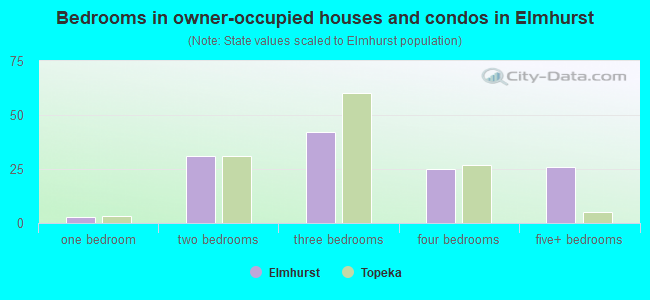
- Bedrooms in owner-occupied houses and condos in Elmhurst
- 0no bedroom
- 31 bedroom
- 312 bedrooms
- 423 bedrooms
- 254 bedrooms
- 265+ bedrooms
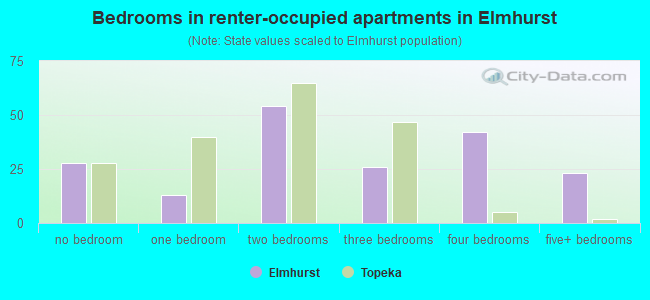
- Bedrooms in renter-occupied apartments in Elmhurst
- 28no bedroom
- 131 bedroom
- 542 bedrooms
- 263 bedrooms
- 424 bedrooms
- 235+ bedrooms
Average number of cars or other vehicles available in houses/condos:
Average number of cars or other vehicles available in apartments:
| This neighborhood: | 2.2 |
| Topeka: | 1.9 |
Average number of cars or other vehicles available in apartments:
| Here: | 2.5 |
| city: | 1.2 |
Percentage of units with a mortgage:
| Elmhurst: | 67.4% |
| Topeka: | 54.9% |
Average estimated value of detached houses in 2022 (86.5% of all units):
| Elmhurst: | $94,412 |
| Kansas: | $264,181 |
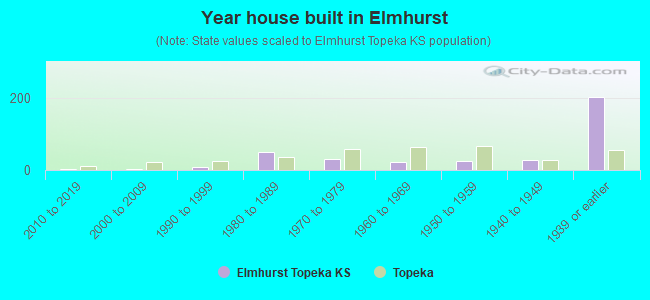
- Year house built in Elmhurst
- 02020 or later
- 22010 to 2019
- 22000 to 2009
- 71990 to 1999
- 501980 to 1989
- 311970 to 1979
- 211960 to 1969
- 251950 to 1959
- 291940 to 1949
- 2021939 or earlier
City-data.com crime index for city in 2020 (higher means more crime):
| City: | 8.2 |
| U.S. average: | 219.5 |
Travel time to work (commute)
![Travel time to work (commute)]()
- 12Less than 5 minutes
- 505 to 9 minutes
- 6210 to 14 minutes
- 10415 to 19 minutes
- 4520 to 24 minutes
- 425 to 29 minutes
- 1430 to 34 minutes
- 635 to 39 minutes
- 940 to 44 minutes
- 1345 to 59 minutes
- 960 to 89 minutes
- 290 or more minutes

Means of transportation to work
![Means of transportation to work]()
- 74.8%286Drove a car alone
- 6.5%25Carpooled
- 2.6%10Bus
- 5.2%20Bicycle
- 2.1%8Walked
- 7.6%29Other means
- 23.5%90Worked at home

Time leaving home to go to work
![Time leaving home to go to work]()
- 1212:00 a.m. to 4:59 a.m.
- 65:00 a.m. to 5:29 a.m.
- 35:30 a.m. to 5:59 a.m.
- 136:00 a.m. to 6:29 a.m.
- 296:30 a.m. to 6:59 a.m.
- 337:00 a.m. to 7:29 a.m.
- 987:30 a.m. to 7:59 a.m.
- 238:00 a.m. to 8:29 a.m.
- 98:30 a.m. to 8:59 a.m.
- 289:00 a.m. to 9:59 a.m.
- 1510:00 a.m. to 10:59 a.m.
- 711:00 a.m. to 11:59 a.m.
- 3612:00 p.m. to 3:59 p.m.
- 104:00 p.m. to 11:59 p.m.

Occupations of males:
- Percentage of males in management occupations (except farmers):
Here: 2.1% city: 9.3%
- Percentage of males in business and financial operations occupations:
Here: 1.6% city: 3.8%
- Percentage of males in computer and mathematical occupations:
Here: 2.9% city: 4.7%
- Percentage of males in architecture and engineering occupations:
Here: 1.6% city: 2.5%
- Percentage of males in community and social services occupations:
Here: 2.0% city: 2.0%
- Percentage of males in arts, design, entertainment, sports, and media occupations:
Here: 2.1% city: 1.2%
- Percentage of males in healthcare practitioners and technical occupations:
Here: 1.9% city: 2.0%
- Percentage of males in service occupations:
Here: 14.3% city: 16.6%
- Percentage of males in sales and office occupations:
Here: 3.5% city: 14.5%
- Percentage of males in construction, extraction, and maintenance occupations:
Here: 26.5% city: 9.7%
- Percentage of males in production occupations:
Here: 7.4% city: 8.2%
- Percentage of males in transportation occupations:
Here: 2.1% city: 4.6%
- Percentage of males in material moving occupations:
Here: 28.1% city: 8.9%
Occupations of females:
- Percentage of females in management occupations (except farmers):
Here: 13.4% city: 6.6%
- Percentage of females in business and financial operations occupations:
Here: 10.5% city: 6.9%
- Percentage of females in community and social services occupations:
Here: 1.4% city: 2.8%
- Percentage of females in legal occupations:
Here: 4.4% city: 1.0%
- Percentage of females in education, training, and library occupations:
Here: 1.3% city: 8.7%
- Percentage of females in healthcare practitioners and technical occupations:
Here: 9.8% city: 11.5%
- Percentage of females in service occupations:
Here: 23.7% city: 22.2%
- Percentage of females in sales and office occupations:
Here: 7.0% city: 26.9%
- Percentage of females in transportation occupations:
Here: 5.4% city: 0.9%
- Percentage of females in material moving occupations:
Here: 32.8% city: 3.7%
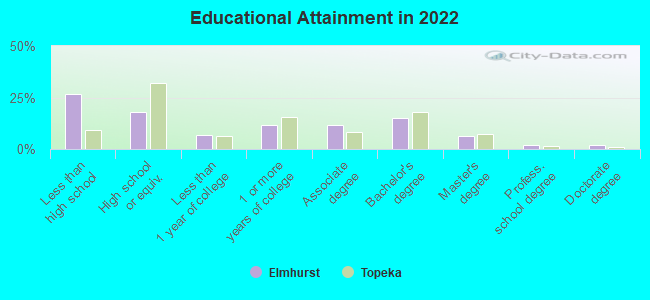
Education in this neighborhood (subdivision or community):
- Percentage of people 3 years and older in K-12 schools:
Elmhurst: 25.4% Topeka: 14.7%
- Percentage of people 3 years and older in undergraduate colleges:
Elmhurst: 5.3% Topeka: 4.3%
- Percentage of people 3 years and older in grad. or professional schools:
Elmhurst: 0.8% Topeka: 1.1%
- Percentage of students K-12 enrolled in private schools:
Elmhurst: 9.1% Topeka: 10.9%
Percentage of population below poverty level:
| Elmhurst: | 16.9% |
| Topeka: | 17.7% |
Median year owner moved in (as recorded in 2022):
Median year renter moved in (as recorded in 2022):
| Elmhurst: | 2008 |
| Topeka: | 2011 |
Median year renter moved in (as recorded in 2022):
| Elmhurst: | 2016 |
| Topeka: | 2020 |
Percentage of married-couple families with both working:
| Elmhurst: | 91.8% |
| Topeka: | 68.4% |
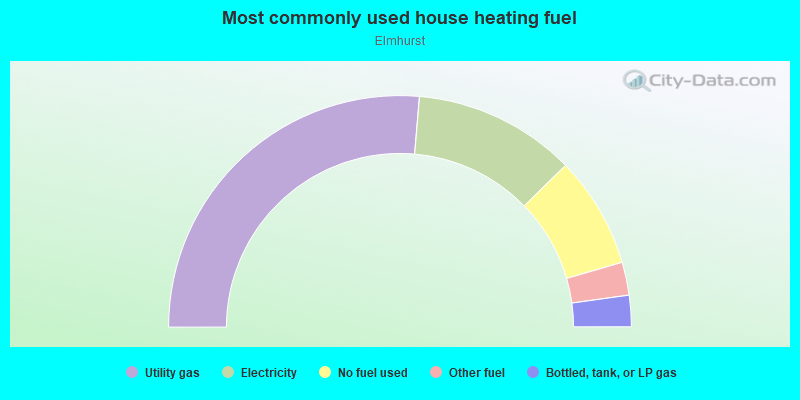
- 52.7%Utility gas
- 22.7%Electricity
- 15.6%No fuel used
- 4.6%Other fuel
- 4.4%Bottled, tank, or LP gas
Roads and streets:
SW College Ave
Length: 0.37 miles
Direction: N-S
Address range: 1100 to 1242
Direction: N-S
Address range: 1100 to 1242
SW Mulvane St
Length: 0.37 miles
Direction: N-S
Address range: 1100 to 1242
Direction: N-S
Address range: 1100 to 1242
SW Garfield Ave
Length: 0.37 miles
Direction: N-S
Address range: 1100 to 1241
Direction: N-S
Address range: 1100 to 1241
SW 12th St
Length: 0.22 miles
Direction: E-W
Address range: 1500 to 1799
Direction: E-W
Address range: 1500 to 1799
SW Munson Ave
Length: 0.22 miles
Direction: E-W
Address range: 1500 to 1808
Direction: E-W
Address range: 1500 to 1808
SW Huntoon St
Length: 0.16 miles
Direction: E-W
Address range: 1600 to 1799
Direction: E-W
Address range: 1600 to 1799
SW 11th St
Length: 0.16 miles
Direction: E-W
Address range: 1700 to 1849
Direction: E-W
Address range: 1700 to 1849
SW Washburn Ave
Length: 0.13 miles
Direction: N-S
Address range: 1140 to 1199
Direction: N-S
Address range: 1140 to 1199