Enchanted Knolls neighborhood in Mill Valley, California (CA), 94941 detailed profile
Settings
X


Business Search - 14 Million verified businesses
Area: 0.194 square miles
Population: 479
Population density:
| Enchanted Knolls: | 2,471 people per square mile |
| Mill Valley: | 3,010 people per square mile |

- 27958.2%White
- 9820.5%Asian
- 5110.6%Two or more races
- 285.8%Black
- 194.0%Hispanic or Latino
- 40.8%Some other race

Median household income in 2022:
| Enchanted Knolls: | $161,738 |
| Mill Valley: | $202,986 |
Distribution of median household income
![Distribution of median household income]()
- 24Less than $10,000
- 9$10,000 to $19,999
- 10$20,000 to $29,999
- 4$30,000 to $39,999
- 4$40,000 to $49,999
- 11$50,000 to $59,999
- 4$60,000 to $74,999
- 39$75,000 to $99,999
- 5$100,000 to $124,999
- 20$125,000 to $149,999
- 38$150,000 to $199,999
- 71$200,000 or more

Distribution of owner-occupied house/condo value
![Distribution of owner-occupied house/condo value]()
- 4Less than $50,000
- 4$300,000 to $399,999
- 7$500,000 to $749,999
- 15$750,000 to $999,999
- 99$1,000,000 or more

Distribution of rent paid by renters
![Distribution of rent paid by renters]()
- 5$200 to $299
- 7$1,250 to $1,499
- 8$1,500 to $1,999
- 84$2,000 or more

Median rent in 2022:
| Enchanted Knolls: | $2,819 |
| Mill Valley: | $2,001 |
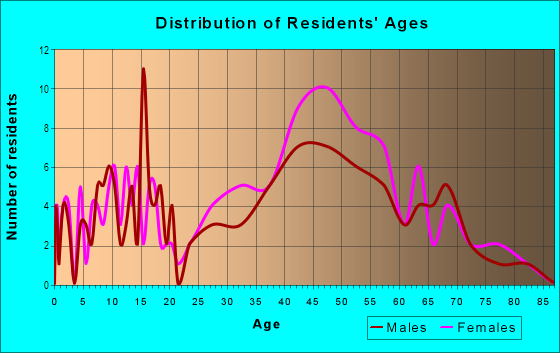
| Males: | 202 |
| Females: | 277 |
Males:
| This neighborhood: | 44.8 years |
| Whole city: | 46.4 years |
| This neighborhood: | 55.7 years |
| Whole city: | 47.3 years |
Average household size:
| Enchanted Knolls: | 16.1 people |
| Mill Valley: | 2.5 people |
Percentage of family households:
| Enchanted Knolls: | 26.9% |
| Mill Valley: | 47.2% |
| Here: | 35.2% |
| Mill Valley: | 56.3% |
Percentage of married-couple families with children (among all households):
| Enchanted Knolls: | 21.8% |
| Mill Valley: | 32.4% |
Percentage of single-mother households (among all households):
| Enchanted Knolls: | 18.1% |
| Mill Valley: | 5.6% |
Percentage of never married males 15 years old and over:
Percentage of never married females 15 years old and over:
| Enchanted Knolls: | 19.4% |
| Mill Valley: | 14.9% |
Percentage of never married females 15 years old and over:
| Enchanted Knolls: | 9.1% |
| city: | 13.2% |
Percentage of people that speak English not well or not at all:
| Enchanted Knolls: | 0.0% |
| Mill Valley: | 0.6% |
Percentage of people born in this state:
Percentage of people born in another U.S. state:
Percentage of native residents but born outside the U.S.:
Percentage of foreign born residents:
| Here: | 43.8% |
| Mill Valley: | 42.0% |
Percentage of people born in another U.S. state:
| Enchanted Knolls: | 33.5% |
| Mill Valley: | 37.9% |
Percentage of native residents but born outside the U.S.:
| Here: | 2.8% |
| city: | 3.5% |
Percentage of foreign born residents:
| Here: | 20.0% |
| Mill Valley: | 16.6% |

Owner-occupied
Renter-occupied


- Rooms in owner-occupied houses and condos in Enchanted Knolls
- 01 room
- 32 rooms
- 73 rooms
- 84 rooms
- 165 rooms
- 456 rooms
- 97 rooms
- 188 rooms
- 129+ rooms

- Rooms in renter-occupied apartments in Enchanted Knolls
- 61 room
- 272 rooms
- 373 rooms
- 114 rooms
- 155 rooms
- 36 rooms
- 07 rooms
- 38 rooms
- 09+ rooms
Owner-occupied
Renter-occupied

- Bedrooms in owner-occupied houses and condos in Enchanted Knolls
- 0no bedroom
- 231 bedroom
- 222 bedrooms
- 423 bedrooms
- 104 bedrooms
- 235+ bedrooms

- Bedrooms in renter-occupied apartments in Enchanted Knolls
- 6no bedroom
- 401 bedroom
- 352 bedrooms
- 173 bedrooms
- 04 bedrooms
- 05+ bedrooms
Average number of cars or other vehicles available in houses/condos:
Average number of cars or other vehicles available in apartments:
| This neighborhood: | 2.1 |
| Mill Valley: | 2.1 |
Average number of cars or other vehicles available in apartments:
| Here: | 0.6 |
| city: | 1.3 |
Percentage of units with a mortgage:
| Enchanted Knolls: | 51.4% |
| Mill Valley: | 69.0% |
Housing prices:
- Average estimated value of detached houses in 2022 (23.7% of all units):
Enchanted Knolls: $3,262,931 California: $988,808
- Average estimated value of townhouses or other attached units in 2022 (16.7% of all units):
This neighborhood: $981,720 California: $838,546

- Year house built in Enchanted Knolls
- 02020 or later
- 182010 to 2019
- 42000 to 2009
- 51990 to 1999
- 611980 to 1989
- 681970 to 1979
- 951960 to 1969
- 321950 to 1959
- 41940 to 1949
- 91939 or earlier

City-data.com crime index for city in 2020 (higher means more crime):
| City: | 112.2 |
| U.S. average: | 219.5 |
Travel time to work (commute)
![Travel time to work (commute)]()
- 5Less than 5 minutes
- 295 to 9 minutes
- 4910 to 14 minutes
- 3115 to 19 minutes
- 920 to 24 minutes
- 625 to 29 minutes
- 1530 to 34 minutes
- 435 to 39 minutes
- 1040 to 44 minutes
- 645 to 59 minutes
- 2860 to 89 minutes

Means of transportation to work
![Means of transportation to work]()
- 82.2%167Drove a car alone
- 1.5%3Carpooled
- 6.9%14Bus
- 3.4%7Walked
- 8.4%17Worked at home

Time leaving home to go to work
![Time leaving home to go to work]()
- 1512:00 a.m. to 4:59 a.m.
- 96:00 a.m. to 6:29 a.m.
- 36:30 a.m. to 6:59 a.m.
- 397:00 a.m. to 7:29 a.m.
- 187:30 a.m. to 7:59 a.m.
- 358:00 a.m. to 8:29 a.m.
- 288:30 a.m. to 8:59 a.m.
- 289:00 a.m. to 9:59 a.m.
- 1410:00 a.m. to 10:59 a.m.
- 1112:00 p.m. to 3:59 p.m.
- 14:00 p.m. to 11:59 p.m.

Occupations of males:
- Percentage of males in management occupations (except farmers):
Here: 35.1% city: 28.2%
- Percentage of males in business and financial operations occupations:
Here: 1.3% city: 8.7%
- Percentage of males in computer and mathematical occupations:
Here: 14.3% city: 6.1%
- Percentage of males in architecture and engineering occupations:
Here: 8.0% city: 5.1%
- Percentage of males in legal occupations:
Here: 3.3% city: 5.9%
- Percentage of males in education, training, and library occupations:
Here: 2.0% city: 1.6%
- Percentage of males in arts, design, entertainment, sports, and media occupations:
Here: 2.4% city: 6.4%
- Percentage of males in sales and office occupations:
Here: 32.6% city: 18.4%
Occupations of females:
- Percentage of females in management occupations (except farmers):
Here: 14.3% city: 22.1%
- Percentage of females in education, training, and library occupations:
Here: 34.6% city: 12.8%
- Percentage of females in healthcare practitioners and technical occupations:
Here: 16.8% city: 12.4%
- Percentage of females in service occupations:
Here: 1.3% city: 7.5%
- Percentage of females in sales and office occupations:
Here: 29.8% city: 11.9%
Education in this neighborhood (subdivision or community):
- Percentage of people 3 years and older in K-12 schools:
Enchanted Knolls: 15.2% Mill Valley: 18.4%
- Percentage of people 3 years and older in undergraduate colleges:
Enchanted Knolls: 9.3% Mill Valley: 2.6%
- Percentage of people 3 years and older in grad. or professional schools:
Enchanted Knolls: 3.5% Mill Valley: 1.8%
- Percentage of students K-12 enrolled in private schools:
Enchanted Knolls: 31.4% Mill Valley: 32.0%
Percentage of population below poverty level:
| Enchanted Knolls: | 5.2% |
| Mill Valley: | 4.6% |
Median year owner moved in (as recorded in 2022):
Median year renter moved in (as recorded in 2022):
| Enchanted Knolls: | 2003 |
| Mill Valley: | 2003 |
Median year renter moved in (as recorded in 2022):
| Enchanted Knolls: | 2013 |
| Mill Valley: | 2014 |
Percentage of married-couple families with both working:
| Enchanted Knolls: | 63.2% |
| Mill Valley: | 61.5% |

- 49.9%Electricity
- 49.1%Utility gas
- 1.0%Solar energy
Roads and streets:
Roque Moraes Dr
Length: 0.54 miles
Directions: E-W, N-S, SE-NW
Address range: 3 to 499
Directions: E-W, N-S, SE-NW
Address range: 3 to 499
Kipling Dr
Length: 0.47 miles
Directions: E-W, N-S, SW-NE
Address range: 1 to 199
Directions: E-W, N-S, SW-NE
Address range: 1 to 199
Shelley Dr
Length: 0.46 miles
Directions: E-W, N-S, SE-NW, SW-NE
Address range: 1 to 199
Directions: E-W, N-S, SE-NW, SW-NE
Address range: 1 to 199
Hamilton Dr
Length: 0.42 miles
Directions: E-W, N-S, SE-NW, SW-NE
Directions: E-W, N-S, SE-NW, SW-NE
Longfellow Rd
Length: 0.37 miles
Directions: E-W, N-S, SE-NW, SW-NE
Address range: 1 to 140
Directions: E-W, N-S, SE-NW, SW-NE
Address range: 1 to 140
E Blithedale Ave
Length: 0.33 miles
Directions: E-W, SE-NW, SW-NE
Address range: 658 to 899
Directions: E-W, SE-NW, SW-NE
Address range: 658 to 899
Keats Dr
Length: 0.27 miles
Directions: E-W, N-S, SE-NW, SW-NE
Address range: 1 to 100
Directions: E-W, N-S, SE-NW, SW-NE
Address range: 1 to 100
Millay Pl
Length: 0.21 miles
Directions: E-W, N-S, SW-NE
Address range: 1 to 99
Directions: E-W, N-S, SW-NE
Address range: 1 to 99
Roque Moraes Ct
Length: 0.13 miles
Directions: N-S, SE-NW, SW-NE
Address range: 1 to 99
Directions: N-S, SE-NW, SW-NE
Address range: 1 to 99
Kipling Ct
Length: 0.09 miles
Directions: E-W, N-S, SW-NE
Address range: 39 to 69
Directions: E-W, N-S, SW-NE
Address range: 39 to 69
Wilkins Pl
Length: 0.07 miles
Directions: E-W, SW-NE
Address range: 1 to 99
Directions: E-W, SW-NE
Address range: 1 to 99
Seaver Dr
Length: 0.05 miles
Direction: SE-NW
Direction: SE-NW