Fairmount Park neighborhood in Seattle, Washington (WA), 98116, 98126, 98136 detailed profile
Settings
X


Business Search - 14 Million verified businesses
Area: 0.503 square miles
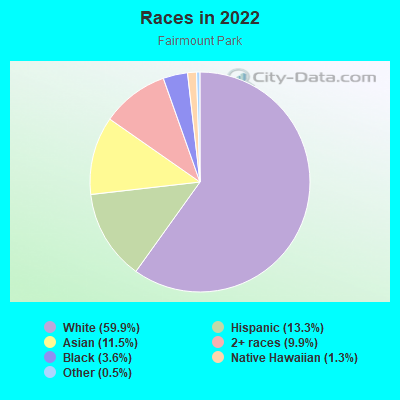
Population: 2,951
Population density:
| Fairmount Park: | 5,866 people per square mile |
| Seattle: | 8,933 people per square mile |

- 1,78459.9%White
- 39613.3%Hispanic or Latino
- 34411.5%Asian
- 2969.9%Two or more races
- 1063.6%Black
- 391.3%Native Hawaiian and Other
Pacific Islander - 140.5%Some other race
Median household income in 2022:
| Fairmount Park: | $123,703 |
| Seattle: | $115,409 |
Distribution of median household income
![Distribution of median household income]()
- 58Less than $10,000
- 132$10,000 to $19,999
- 22$20,000 to $29,999
- 194$30,000 to $39,999
- 48$40,000 to $49,999
- 75$50,000 to $59,999
- 79$60,000 to $74,999
- 85$75,000 to $99,999
- 107$100,000 to $124,999
- 158$125,000 to $149,999
- 101$150,000 to $199,999
- 400$200,000 or more

Distribution of owner-occupied house/condo value
![Distribution of owner-occupied house/condo value]()
- 15Less than $50,000
- 87$50,000 to $99,999
- 3$250,000 to $299,999
- 55$300,000 to $399,999
- 37$400,000 to $499,999
- 240$500,000 to $749,999
- 370$750,000 to $999,999
- 160$1,000,000 or more

Distribution of rent paid by renters
![Distribution of rent paid by renters]()
- 9$100 to $199
- 4$500 to $599
- 6$600 to $699
- 15$700 to $799
- 35$800 to $899
- 3$900 to $999
- 3$1,000 to $1,249
- 146$1,250 to $1,499
- 138$1,500 to $1,999
- 171$2,000 or more

Median rent in 2022:
| Fairmount Park: | $1,881 |
| Seattle: | $1,762 |
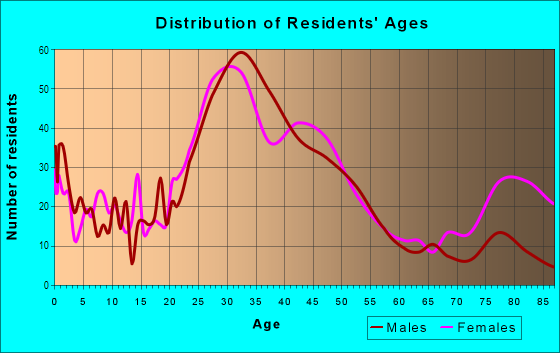
| Males: | 1,262 |
| Females: | 1,689 |
Males:
| This neighborhood: | 40.3 years |
| Whole city: | 35.7 years |
| This neighborhood: | 38.7 years |
| Whole city: | 36.2 years |
Average household size:
| Fairmount Park: | 2.1 people |
| Seattle: | 2.0 people |
Percentage of family households:
| Fairmount Park: | 37.9% |
| Seattle: | 30.9% |
| Here: | 42.0% |
| Seattle: | 33.2% |
Percentage of married-couple families with children (among all households):
| Fairmount Park: | 31.4% |
| Seattle: | 36.5% |
Percentage of single-mother households (among all households):
| Fairmount Park: | 13.9% |
| Seattle: | 9.3% |
Percentage of never married males 15 years old and over:
Percentage of never married females 15 years old and over:
| Fairmount Park: | 10.4% |
| Seattle: | 24.9% |
Percentage of never married females 15 years old and over:
| Fairmount Park: | 21.4% |
| city: | 22.3% |
Percentage of people that speak English not well or not at all:
| Fairmount Park: | 0.6% |
| Seattle: | 3.2% |
Percentage of people born in this state:
Percentage of people born in another U.S. state:
Percentage of native residents but born outside the U.S.:
Percentage of foreign born residents:
| Here: | 35.0% |
| Seattle: | 34.6% |
Percentage of people born in another U.S. state:
| Fairmount Park: | 41.1% |
| Seattle: | 42.9% |
Percentage of native residents but born outside the U.S.:
| Here: | 2.0% |
| city: | 2.2% |
Percentage of foreign born residents:
| Here: | 21.9% |
| Seattle: | 20.3% |
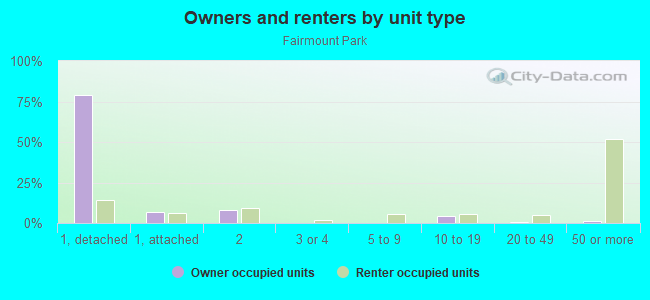
Owner-occupied
Renter-occupied

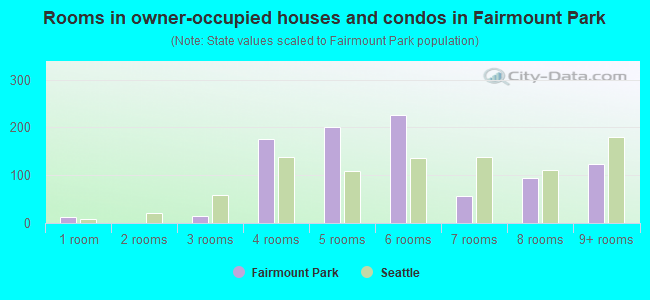
- Rooms in owner-occupied houses and condos in Fairmount Park
- 131 room
- 02 rooms
- 153 rooms
- 1764 rooms
- 2015 rooms
- 2266 rooms
- 567 rooms
- 958 rooms
- 1239+ rooms
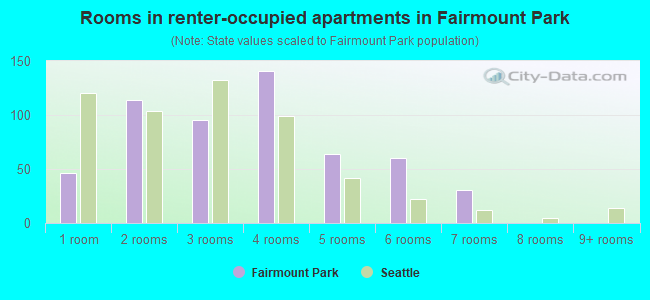
- Rooms in renter-occupied apartments in Fairmount Park
- 461 room
- 1142 rooms
- 953 rooms
- 1414 rooms
- 645 rooms
- 606 rooms
- 317 rooms
- 08 rooms
- 09+ rooms
Owner-occupied
Renter-occupied
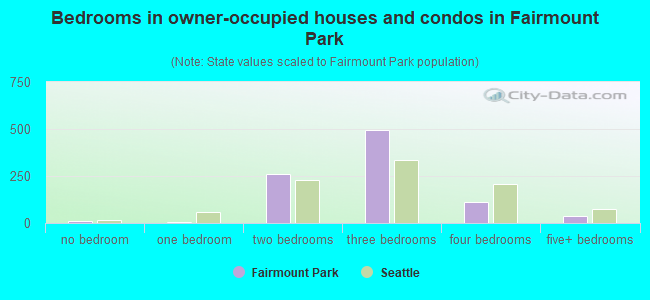
- Bedrooms in owner-occupied houses and condos in Fairmount Park
- 13no bedroom
- 31 bedroom
- 2582 bedrooms
- 4933 bedrooms
- 1134 bedrooms
- 375+ bedrooms
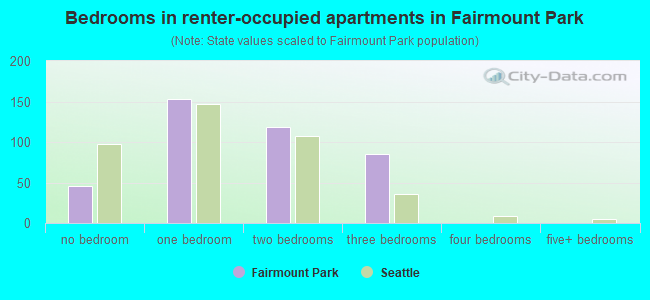
- Bedrooms in renter-occupied apartments in Fairmount Park
- 46no bedroom
- 1531 bedroom
- 1182 bedrooms
- 853 bedrooms
- 04 bedrooms
- 05+ bedrooms
Average number of cars or other vehicles available in houses/condos:
Average number of cars or other vehicles available in apartments:
| This neighborhood: | 1.9 |
| Seattle: | 1.7 |
Average number of cars or other vehicles available in apartments:
| Here: | 1.6 |
| city: | 0.9 |
Percentage of units with a mortgage:
| Fairmount Park: | 78.0% |
| Seattle: | 70.4% |
Average estimated value of detached houses in 2022 (71.8% of all units):
| Fairmount Park: | $840,779 |
| Seattle: | $1,274,185 |
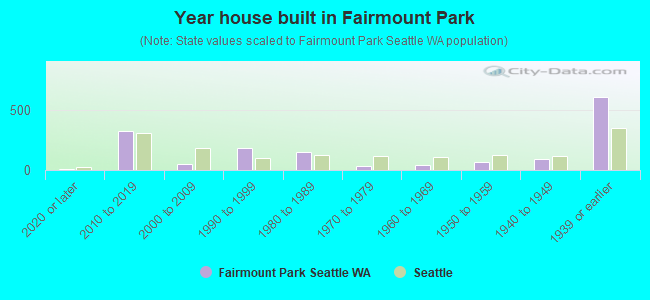
- Year house built in Fairmount Park
- 112020 or later
- 3252010 to 2019
- 542000 to 2009
- 1821990 to 1999
- 1551980 to 1989
- 321970 to 1979
- 451960 to 1969
- 631950 to 1959
- 891940 to 1949
- 6101939 or earlier
City-data.com crime index for city in 2020 (higher means more crime):
| City: | 440.8 |
| U.S. average: | 219.5 |
Travel time to work (commute)
![Travel time to work (commute)]()
- 33Less than 5 minutes
- 635 to 9 minutes
- 3310 to 14 minutes
- 2715 to 19 minutes
- 14520 to 24 minutes
- 2625 to 29 minutes
- 11530 to 34 minutes
- 1835 to 39 minutes
- 2040 to 44 minutes
- 14045 to 59 minutes
- 3860 to 89 minutes
- 590 or more minutes

Means of transportation to work
![Means of transportation to work]()
- 50.4%845Drove a car alone
- 1.7%29Carpooled
- 14.3%240Bus
- 1.1%19Light rail, streetcar or trolley
- 0.3%5Ferryboat
- 0.8%13Motorcycle
- 0.2%3Bicycle
- 0.1%2Walked
- 0.2%3Other means
- 32.2%541Worked at home

Time leaving home to go to work
![Time leaving home to go to work]()
- 812:00 a.m. to 4:59 a.m.
- 155:00 a.m. to 5:29 a.m.
- 315:30 a.m. to 5:59 a.m.
- 226:00 a.m. to 6:29 a.m.
- 346:30 a.m. to 6:59 a.m.
- 547:00 a.m. to 7:29 a.m.
- 617:30 a.m. to 7:59 a.m.
- 1398:00 a.m. to 8:29 a.m.
- 518:30 a.m. to 8:59 a.m.
- 589:00 a.m. to 9:59 a.m.
- 4310:00 a.m. to 10:59 a.m.
- 1011:00 a.m. to 11:59 a.m.
- 712:00 p.m. to 3:59 p.m.
- 494:00 p.m. to 11:59 p.m.

Occupations of males:
- Percentage of males in management occupations (except farmers):
Here: 14.5% city: 16.0%
- Percentage of males in business and financial operations occupations:
Here: 6.6% city: 7.6%
- Percentage of males in computer and mathematical occupations:
Here: 20.1% city: 18.5%
- Percentage of males in architecture and engineering occupations:
Here: 1.7% city: 5.6%
- Percentage of males in legal occupations:
Here: 8.9% city: 2.0%
- Percentage of males in education, training, and library occupations:
Here: 1.3% city: 4.1%
- Percentage of males in arts, design, entertainment, sports, and media occupations:
Here: 7.9% city: 3.8%
- Percentage of males in healthcare practitioners and technical occupations:
Here: 1.2% city: 3.6%
- Percentage of males in service occupations:
Here: 14.2% city: 10.5%
- Percentage of males in sales and office occupations:
Here: 3.1% city: 12.0%
- Percentage of males in construction, extraction, and maintenance occupations:
Here: 4.1% city: 3.2%
- Percentage of males in production occupations:
Here: 5.6% city: 2.6%
- Percentage of males in transportation occupations:
Here: 3.2% city: 3.0%
- Percentage of males in material moving occupations:
Here: 5.3% city: 1.9%
Occupations of females:
- Percentage of females in management occupations (except farmers):
Here: 10.3% city: 14.2%
- Percentage of females in business and financial operations occupations:
Here: 17.8% city: 9.8%
- Percentage of females in computer and mathematical occupations:
Here: 4.2% city: 6.6%
- Percentage of females in community and social services occupations:
Here: 2.2% city: 3.2%
- Percentage of females in legal occupations:
Here: 4.1% city: 2.5%
- Percentage of females in education, training, and library occupations:
Here: 7.9% city: 8.7%
- Percentage of females in arts, design, entertainment, sports, and media occupations:
Here: 2.4% city: 5.0%
- Percentage of females in healthcare practitioners and technical occupations:
Here: 5.6% city: 9.6%
- Percentage of females in service occupations:
Here: 10.3% city: 13.7%
- Percentage of females in sales and office occupations:
Here: 30.5% city: 17.7%
- Percentage of females in production occupations:
Here: 4.2% city: 1.3%
Percentage of people 16-64 in Armed Forces:
| Fairmount Park: | 0.3% |
| Seattle: | 0.2% |
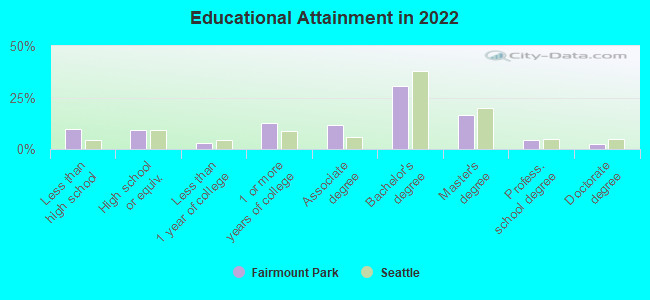
Education in this neighborhood (subdivision or community):
- Percentage of people 3 years and older in K-12 schools:
Fairmount Park: 9.2% Seattle: 9.8%
- Percentage of people 3 years and older in undergraduate colleges:
Fairmount Park: 3.9% Seattle: 6.3%
- Percentage of people 3 years and older in grad. or professional schools:
Fairmount Park: 4.9% Seattle: 3.0%
- Percentage of students K-12 enrolled in private schools:
Fairmount Park: 35.2% Seattle: 17.3%
Percentage of population below poverty level:
| Fairmount Park: | 7.7% |
| Seattle: | 10.1% |
Median year owner moved in (as recorded in 2022):
Median year renter moved in (as recorded in 2022):
| Fairmount Park: | 2011 |
| Seattle: | 2013 |
Median year renter moved in (as recorded in 2022):
| Fairmount Park: | 2018 |
| Seattle: | 2021 |
Percentage of married-couple families with both working:
| Fairmount Park: | 84.2% |
| Seattle: | 74.4% |
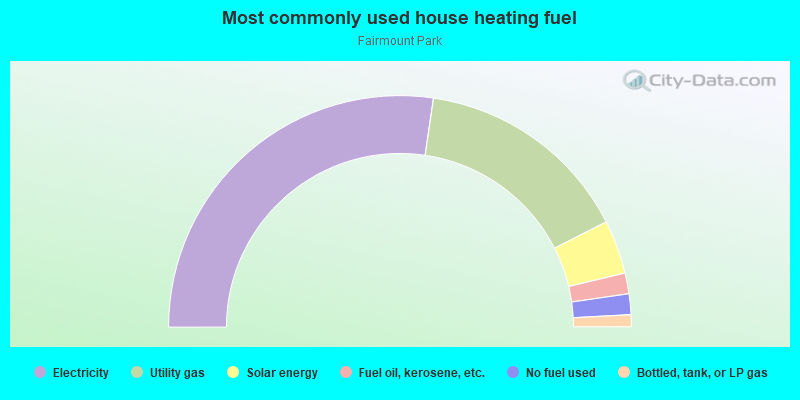
- 54.7%Electricity
- 30.4%Utility gas
- 7.5%Solar energy
- 2.9%Fuel oil, kerosene, etc.
- 2.9%No fuel used
- 1.7%Bottled, tank, or LP gas
Roads and streets:
38th Ave SW
Length: 1.17 miles
Directions: E-W, N-S, SE-NW, SW-NE
Address range: 4529 to 5999
Directions: E-W, N-S, SE-NW, SW-NE
Address range: 4529 to 5999
35th Ave SW
Length: 1.09 miles
Direction: N-S
Address range: 4422 to 5999
Direction: N-S
Address range: 4422 to 5999
37th Ave SW
Length: 1.00 miles
Direction: N-S
Address range: 4500 to 5999
Direction: N-S
Address range: 4500 to 5999
36th Ave SW
Length: 0.87 miles
Direction: N-S
Address range: 4501 to 5999
Direction: N-S
Address range: 4501 to 5999
Fauntleroy Way SW
Length: 0.79 miles
Directions: N-S, SW-NE
Address range: 4800 to 5999
Directions: N-S, SW-NE
Address range: 4800 to 5999
40th Ave SW
Length: 0.67 miles
Direction: N-S
Address range: 4800 to 5909
Direction: N-S
Address range: 4800 to 5909
SW Juneau St
Length: 0.64 miles
Direction: E-W
Address range: 3500 to 4199
Direction: E-W
Address range: 3500 to 4199
SW Hudson St
Length: 0.64 miles
Directions: E-W, SE-NW
Address range: 3500 to 4299
Directions: E-W, SE-NW
Address range: 3500 to 4299
41st Ave SW
Length: 0.62 miles
Direction: N-S
Address range: 4927 to 5999
Direction: N-S
Address range: 4927 to 5999
42nd Ave SW
Length: 0.62 miles
Direction: N-S
Address range: 5000 to 5999
Direction: N-S
Address range: 5000 to 5999
SW Avalon Way
Length: 0.61 miles
Directions: E-W, N-S, SW-NE
Address range: 2960 to 3499
Directions: E-W, N-S, SW-NE
Address range: 2960 to 3499
SW Findlay St
Length: 0.59 miles
Direction: E-W
Address range: 3500 to 4199
Direction: E-W
Address range: 3500 to 4199
SW Raymond St
Length: 0.55 miles
Direction: E-W
Address range: 3500 to 4099
Direction: E-W
Address range: 3500 to 4099
SW Dawson St
Length: 0.50 miles
Direction: E-W
Address range: 3500 to 4199
Direction: E-W
Address range: 3500 to 4199
SW Brandon St
Length: 0.46 miles
Direction: E-W
Address range: 3500 to 4199
Direction: E-W
Address range: 3500 to 4199
SW Edmunds St
Length: 0.39 miles
Directions: E-W, SW-NE
Address range: 3500 to 3999
Directions: E-W, SW-NE
Address range: 3500 to 3999
SW Alaska St
Length: 0.27 miles
Direction: E-W
Address range: 3509 to 3799
Direction: E-W
Address range: 3509 to 3799
32nd Ave SW
Length: 0.24 miles
Direction: SW-NE
Address range: 4000 to 4399
Direction: SW-NE
Address range: 4000 to 4399
39th Ave SW
Length: 0.18 miles
Direction: N-S
Address range: 5848 to 5999
Direction: N-S
Address range: 5848 to 5999
SW Snoqualmie St
Length: 0.18 miles
Direction: E-W
Address range: 3500 to 3699
Direction: E-W
Address range: 3500 to 3699
SW Oregon St
Length: 0.14 miles
Direction: E-W
Address range: 3500 to 3718
Direction: E-W
Address range: 3500 to 3718
SW Bradford St
Length: 0.11 miles
Directions: E-W, SE-NW
Address range: 3000 to 3199
Directions: E-W, SE-NW
Address range: 3000 to 3199
SW Andover St
Length: 0.09 miles
Directions: E-W, SE-NW
Address range: 3000 to 3199
Directions: E-W, SE-NW
Address range: 3000 to 3199
SW Genesee St
Length: 0.09 miles
Direction: E-W
Address range: 3100 to 3199
Direction: E-W
Address range: 3100 to 3199
30th Ave SW
Length: 0.05 miles
Direction: N-S
Address range: 4050 to 4133
Direction: N-S
Address range: 4050 to 4133