Fairway Farms neighborhood in Livonia, Michigan (MI), 48154 detailed profile
Settings
X


Business Search - 14 Million verified businesses
Area: 0.149 square miles
Population: 629
Population density:
| Fairway Farms: | 4,228 people per square mile |
| Livonia: | 2,626 people per square mile |

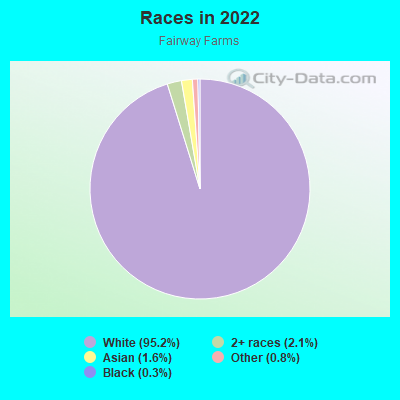
- 60095.2%White
- 132.1%Two or more races
- 101.6%Asian
- 50.8%Some other race
- 20.3%Black

Median household income in 2022:
| Fairway Farms: | $125,000 |
| Livonia: | $92,125 |
Distribution of median household income
![Distribution of median household income]()
- 11Less than $10,000
- 2$10,000 to $19,999
- 10$20,000 to $29,999
- 37$30,000 to $39,999
- 13$40,000 to $49,999
- 12$50,000 to $59,999
- 17$60,000 to $74,999
- 18$75,000 to $99,999
- 31$100,000 to $124,999
- 52$125,000 to $149,999
- 47$150,000 to $199,999
- 31$200,000 or more

Distribution of owner-occupied house/condo value
![Distribution of owner-occupied house/condo value]()
- 3Less than $50,000
- 3$50,000 to $99,999
- 3$100,000 to $149,999
- 11$150,000 to $199,999
- 57$200,000 to $249,999
- 113$250,000 to $299,999
- 71$300,000 to $399,999
- 2$400,000 to $499,999
- 2$500,000 to $749,999
- 3$1,000,000 or more

Distribution of rent paid by renters
![Distribution of rent paid by renters]()
- 2$500 to $599
- 4$800 to $899

| Males: | 292 |
| Females: | 336 |
Males:
| This neighborhood: | 44.7 years |
| Whole city: | 42.2 years |
| This neighborhood: | 55.9 years |
| Whole city: | 46.5 years |
Average household size:
| Fairway Farms: | 2.5 people |
| Livonia: | 2.4 people |
Percentage of family households:
| Fairway Farms: | 39.4% |
| Livonia: | 44.1% |
| Here: | 50.0% |
| Livonia: | 50.1% |
Percentage of married-couple families with children (among all households):
| Fairway Farms: | 37.0% |
| Livonia: | 33.5% |
Percentage of single-mother households (among all households):
| Fairway Farms: | 1.9% |
| Livonia: | 6.6% |
Percentage of never married males 15 years old and over:
Percentage of never married females 15 years old and over:
| Fairway Farms: | 18.4% |
| Livonia: | 16.7% |
Percentage of never married females 15 years old and over:
| Fairway Farms: | 9.4% |
| city: | 12.0% |
Percentage of people that speak English not well or not at all:
| Fairway Farms: | 0.2% |
| Livonia: | 1.4% |
Percentage of people born in this state:
Percentage of people born in another U.S. state:
Percentage of native residents but born outside the U.S.:
Percentage of foreign born residents:
| Here: | 78.1% |
| Livonia: | 78.1% |
Percentage of people born in another U.S. state:
| Fairway Farms: | 11.8% |
| Livonia: | 13.0% |
Percentage of native residents but born outside the U.S.:
| Here: | 2.1% |
| city: | 0.4% |
Percentage of foreign born residents:
| Here: | 8.0% |
| Livonia: | 8.4% |
Owner-occupied
Renter-occupied

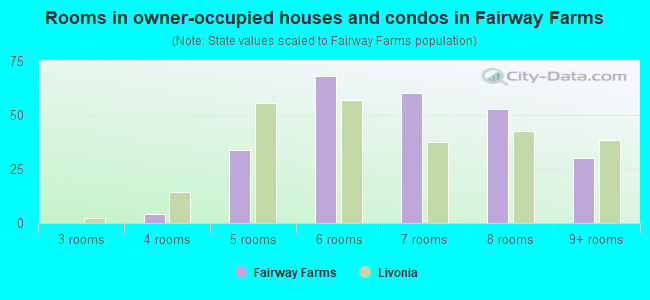
- Rooms in owner-occupied houses and condos in Fairway Farms
- 01 room
- 02 rooms
- 03 rooms
- 44 rooms
- 345 rooms
- 686 rooms
- 607 rooms
- 538 rooms
- 309+ rooms
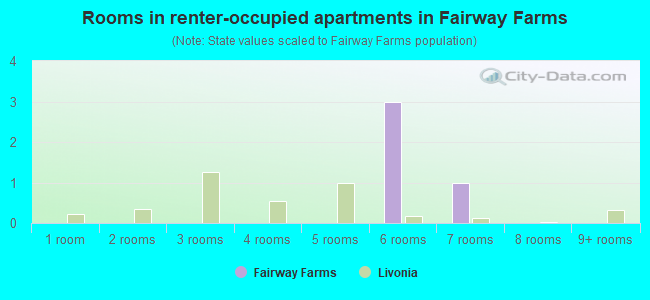
- Rooms in renter-occupied apartments in Fairway Farms
- 01 room
- 02 rooms
- 03 rooms
- 04 rooms
- 05 rooms
- 36 rooms
- 17 rooms
- 08 rooms
- 09+ rooms
Owner-occupied
Renter-occupied
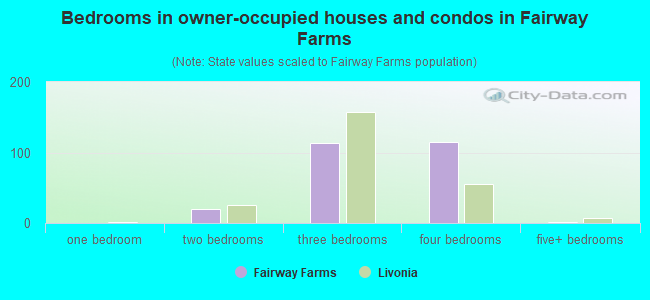
- Bedrooms in owner-occupied houses and condos in Fairway Farms
- 0no bedroom
- 01 bedroom
- 202 bedrooms
- 1133 bedrooms
- 1154 bedrooms
- 25+ bedrooms
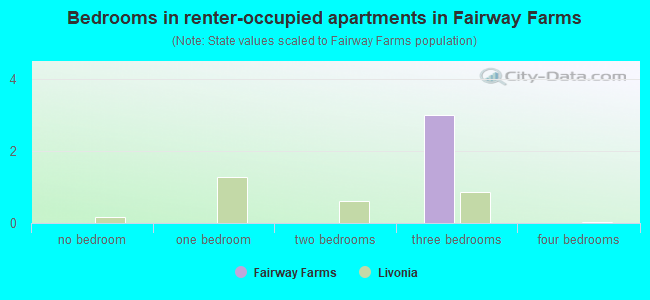
- Bedrooms in renter-occupied apartments in Fairway Farms
- 0no bedroom
- 01 bedroom
- 02 bedrooms
- 33 bedrooms
- 04 bedrooms
- 05+ bedrooms
Average number of cars or other vehicles available in houses/condos:
Average number of cars or other vehicles available in apartments:
| This neighborhood: | 0.0 |
| Livonia: | 2.0 |
Average number of cars or other vehicles available in apartments:
| Here: | 0.0 |
| city: | 1.3 |
Percentage of units with a mortgage:
| Fairway Farms: | 47.3% |
| Livonia: | 60.8% |
Housing prices:
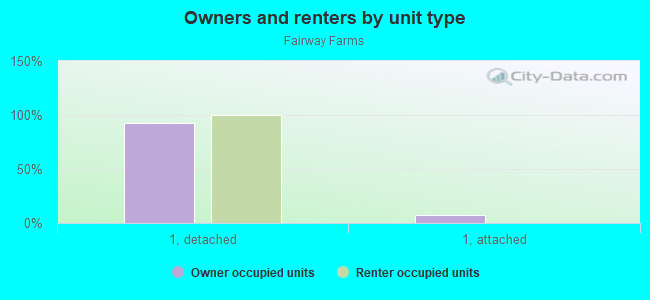
- Average estimated value of detached houses in 2022 (93.4% of all units):
Fairway Farms: $270,078 Livonia: $291,361
- Average estimated value of townhouses or other attached units in 2022 (6.6% of all units):
This neighborhood: $314,966 city: $253,233
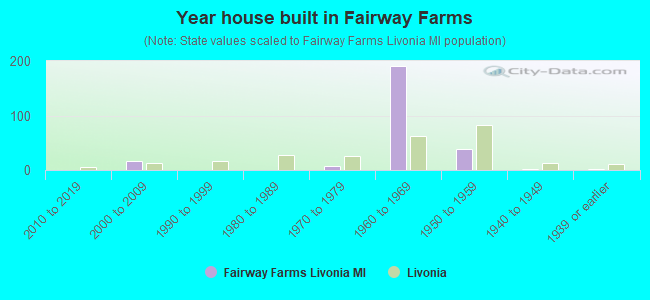
- Year house built in Fairway Farms
- 02020 or later
- 02010 to 2019
- 172000 to 2009
- 01990 to 1999
- 01980 to 1989
- 81970 to 1979
- 1901960 to 1969
- 381950 to 1959
- 11940 to 1949
- 11939 or earlier
City-data.com crime index for city in 2020 (higher means more crime):
| City: | 122.1 |
| U.S. average: | 219.5 |
Travel time to work (commute)
![Travel time to work (commute)]()
- 3Less than 5 minutes
- 235 to 9 minutes
- 2210 to 14 minutes
- 5615 to 19 minutes
- 1620 to 24 minutes
- 2125 to 29 minutes
- 2730 to 34 minutes
- 435 to 39 minutes
- 640 to 44 minutes
- 1845 to 59 minutes

Means of transportation to work
![Means of transportation to work]()
- 87.4%289Drove a car alone
- 5.1%17Carpooled
- 0.3%1Bicycle
- 6.7%22Worked at home

Time leaving home to go to work
![Time leaving home to go to work]()
- 712:00 a.m. to 4:59 a.m.
- 15:00 a.m. to 5:29 a.m.
- 145:30 a.m. to 5:59 a.m.
- 116:00 a.m. to 6:29 a.m.
- 176:30 a.m. to 6:59 a.m.
- 237:00 a.m. to 7:29 a.m.
- 427:30 a.m. to 7:59 a.m.
- 138:00 a.m. to 8:29 a.m.
- 288:30 a.m. to 8:59 a.m.
- 69:00 a.m. to 9:59 a.m.
- 410:00 a.m. to 10:59 a.m.
- 211:00 a.m. to 11:59 a.m.
- 412:00 p.m. to 3:59 p.m.
- 164:00 p.m. to 11:59 p.m.

Occupations of males:
- Percentage of males in management occupations (except farmers):
Here: 6.5% city: 12.8%
- Percentage of males in business and financial operations occupations:
Here: 6.3% city: 6.2%
- Percentage of males in computer and mathematical occupations:
Here: 13.1% city: 6.7%
- Percentage of males in architecture and engineering occupations:
Here: 12.1% city: 8.4%
- Percentage of males in education, training, and library occupations:
Here: 1.8% city: 3.2%
- Percentage of males in arts, design, entertainment, sports, and media occupations:
Here: 1.8% city: 2.5%
- Percentage of males in service occupations:
Here: 11.3% city: 11.5%
- Percentage of males in sales and office occupations:
Here: 9.7% city: 15.7%
- Percentage of males in farming, fishing, and forestry occupations:
Here: 1.2% city: 0.1%
- Percentage of males in construction, extraction, and maintenance occupations:
Here: 13.9% city: 7.2%
- Percentage of males in production occupations:
Here: 5.1% city: 8.0%
- Percentage of males in material moving occupations:
Here: 3.4% city: 3.4%
Occupations of females:
- Percentage of females in management occupations (except farmers):
Here: 18.4% city: 11.2%
- Percentage of females in business and financial operations occupations:
Here: 7.5% city: 7.4%
- Percentage of females in architecture and engineering occupations:
Here: 2.1% city: 2.2%
- Percentage of females in community and social services occupations:
Here: 4.5% city: 2.5%
- Percentage of females in education, training, and library occupations:
Here: 14.7% city: 9.0%
- Percentage of females in arts, design, entertainment, sports, and media occupations:
Here: 1.1% city: 2.5%
- Percentage of females in healthcare practitioners and technical occupations:
Here: 14.2% city: 12.3%
- Percentage of females in service occupations:
Here: 8.3% city: 14.3%
- Percentage of females in sales and office occupations:
Here: 19.8% city: 29.2%
- Percentage of females in production occupations:
Here: 2.9% city: 2.1%
- Percentage of females in transportation occupations:
Here: 4.5% city: 0.9%
- Percentage of females in material moving occupations:
Here: 2.9% city: 1.1%
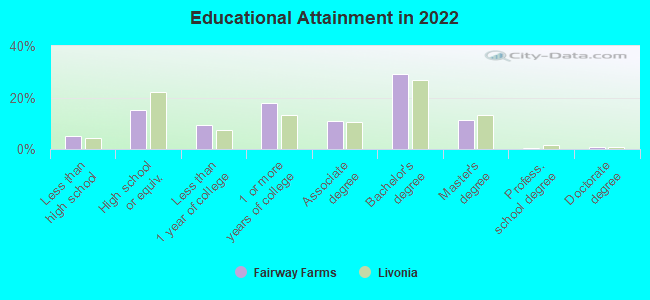
Education in this neighborhood (subdivision or community):
- Percentage of people 3 years and older in K-12 schools:
Fairway Farms: 13.4% Livonia: 13.6%
- Percentage of people 3 years and older in undergraduate colleges:
Fairway Farms: 8.1% Livonia: 4.0%
- Percentage of people 3 years and older in grad. or professional schools:
Fairway Farms: 1.3% Livonia: 1.7%
- Percentage of students K-12 enrolled in private schools:
Fairway Farms: 9.5% Livonia: 13.5%
Percentage of population below poverty level:
| Fairway Farms: | 1.5% |
| Livonia: | 4.6% |
Median year owner moved in (as recorded in 2022):
| Fairway Farms: | 1999 |
| Livonia: | 2008 |
Percentage of married-couple families with both working:
| Fairway Farms: | 75.0% |
| Livonia: | 74.3% |
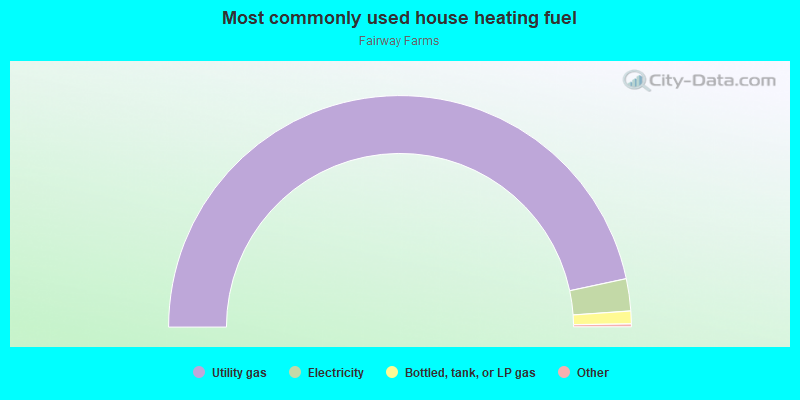
- 93.3%Utility gas
- 4.5%Electricity
- 1.8%Bottled, tank, or LP gas
Roads and streets:
Levan Rd
Length: 0.50 miles
Direction: N-S
Address range: 15300 to 16061
Direction: N-S
Address range: 15300 to 16061
Golfview St
Length: 0.34 miles
Directions: N-S, SE-NW, SW-NE
Address range: 15300 to 15799
Directions: N-S, SE-NW, SW-NE
Address range: 15300 to 15799
Roycroft St
Length: 0.31 miles
Directions: E-W, SE-NW
Address range: 35900 to 36399
Directions: E-W, SE-NW
Address range: 35900 to 36399
5 Mile Rd
Length: 0.30 miles
Direction: E-W
Address range: 36016 to 36399
Direction: E-W
Address range: 36016 to 36399
Ladywood (Ladywood St)
Length: 0.29 miles
Directions: E-W, SE-NW
Address range: 35900 to 36399
Directions: E-W, SE-NW
Address range: 35900 to 36399
Woodside St
Length: 0.23 miles
Direction: N-S
Address range: 15400 to 15799
Direction: N-S
Address range: 15400 to 15799
Westbrook St
Length: 0.21 miles
Directions: N-S, SW-NE
Address range: 15500 to 15699
Directions: N-S, SW-NE
Address range: 15500 to 15699
Parklane (Parklane St)
Length: 0.21 miles
Directions: N-S, SE-NW
Address range: 15500 to 15699
Directions: N-S, SE-NW
Address range: 15500 to 15699
Sherwood St
Length: 0.14 miles
Directions: E-W, SE-NW
Address range: 36000 to 36199
Directions: E-W, SE-NW
Address range: 36000 to 36199