Fay's Point neighborhood in Blue Island, Illinois (IL), 60406, 60827 detailed profile
Settings
X


Business Search - 14 Million verified businesses
Area: 0.460 square miles
Population: 1,641
Population density:
| Fay's Point: | 3,567 people per square mile |
| Blue Island: | 5,691 people per square mile |

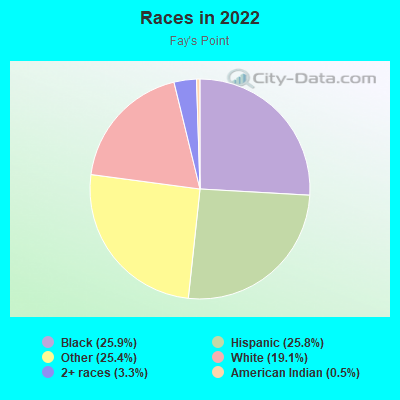
- 57825.9%Black
- 57625.8%Hispanic or Latino
- 56725.4%Some other race
- 42619.1%White
- 733.3%Two or more races
- 120.5%American Indian
- 10.04%Asian
Distribution of median household income
![Distribution of median household income]()
- 80Less than $10,000
- 141$10,000 to $19,999
- 78$20,000 to $29,999
- 47$30,000 to $39,999
- 52$40,000 to $49,999
- 55$50,000 to $59,999
- 106$60,000 to $74,999
- 22$75,000 to $99,999
- 134$100,000 to $124,999
- 40$125,000 to $149,999
- 10$150,000 to $199,999
- 35$200,000 or more

Distribution of owner-occupied house/condo value
![Distribution of owner-occupied house/condo value]()
- 94Less than $50,000
- 52$50,000 to $99,999
- 107$100,000 to $149,999
- 62$150,000 to $199,999
- 89$200,000 to $249,999
- 94$300,000 to $399,999
- 2$500,000 to $749,999
- 8$750,000 to $999,999
- 9$1,000,000 or more

Distribution of rent paid by renters
![Distribution of rent paid by renters]()
- 4$100 to $199
- 3$200 to $299
- 2$300 to $399
- 23$500 to $599
- 53$600 to $699
- 120$700 to $799
- 71$800 to $899
- 142$900 to $999
- 112$1,000 to $1,249
- 23$1,250 to $1,499
- 65$1,500 to $1,999

Median rent in 2022:
| Fay's Point: | $960 |
| Blue Island: | $903 |
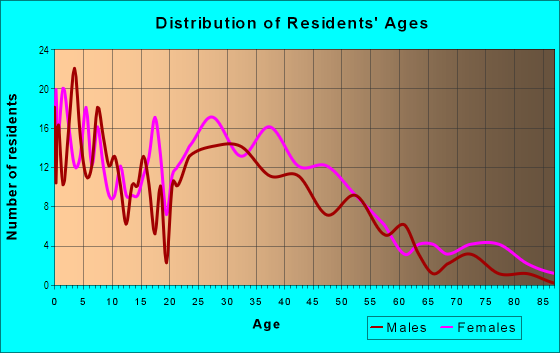
| Males: | 802 |
| Females: | 838 |
Males:
| This neighborhood: | 33.5 years |
| Whole city: | 33.7 years |
| This neighborhood: | 37.1 years |
| Whole city: | 38.4 years |
Average household size:
| Fay's Point: | 2.6 people |
| Blue Island: | 2.7 people |
Percentage of family households:
| Fay's Point: | 41.8% |
| Blue Island: | 49.7% |
| Here: | 23.4% |
| Blue Island: | 31.9% |
Percentage of married-couple families with children (among all households):
| Fay's Point: | 34.7% |
| Blue Island: | 19.3% |
Percentage of single-mother households (among all households):
| Fay's Point: | 12.4% |
| Blue Island: | 15.9% |
Percentage of never married males 15 years old and over:
Percentage of never married females 15 years old and over:
| Fay's Point: | 24.7% |
| Blue Island: | 24.9% |
Percentage of never married females 15 years old and over:
| Fay's Point: | 20.5% |
| city: | 22.9% |
Percentage of people that speak English not well or not at all:
| Fay's Point: | 7.4% |
| Blue Island: | 8.7% |
Percentage of people born in this state:
Percentage of people born in another U.S. state:
Percentage of native residents but born outside the U.S.:
Percentage of foreign born residents:
| Here: | 65.2% |
| Blue Island: | 69.7% |
Percentage of people born in another U.S. state:
| Fay's Point: | 9.4% |
| Blue Island: | 7.8% |
Percentage of native residents but born outside the U.S.:
| Here: | 3.7% |
| city: | 1.5% |
Percentage of foreign born residents:
| Here: | 22.9% |
| Blue Island: | 21.0% |
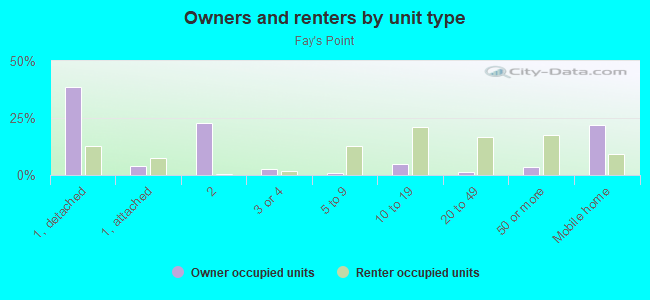
Owner-occupied
Renter-occupied

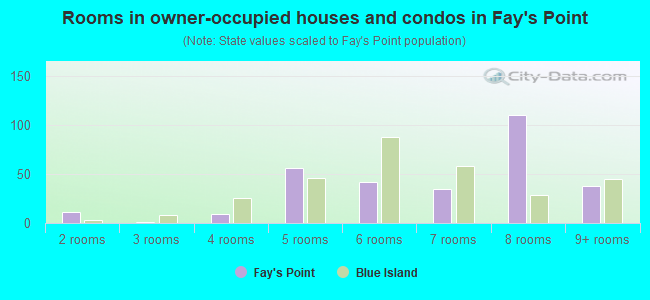
- Rooms in owner-occupied houses and condos in Fay's Point
- 01 room
- 112 rooms
- 13 rooms
- 94 rooms
- 565 rooms
- 426 rooms
- 357 rooms
- 1108 rooms
- 389+ rooms
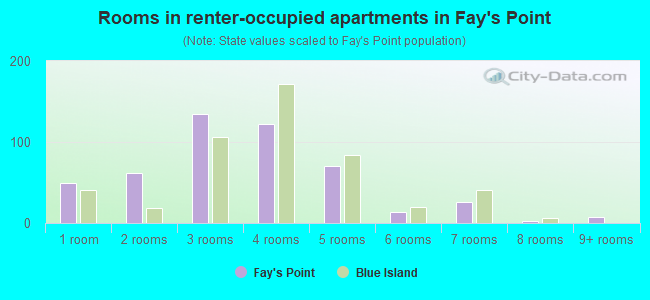
- Rooms in renter-occupied apartments in Fay's Point
- 501 room
- 622 rooms
- 1343 rooms
- 1224 rooms
- 705 rooms
- 136 rooms
- 267 rooms
- 38 rooms
- 79+ rooms
Owner-occupied
Renter-occupied
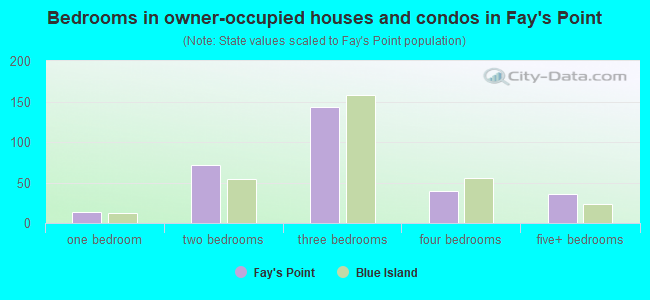
- Bedrooms in owner-occupied houses and condos in Fay's Point
- 0no bedroom
- 141 bedroom
- 722 bedrooms
- 1433 bedrooms
- 404 bedrooms
- 365+ bedrooms
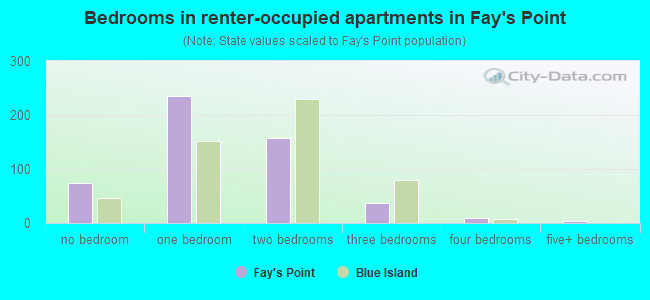
- Bedrooms in renter-occupied apartments in Fay's Point
- 74no bedroom
- 2351 bedroom
- 1572 bedrooms
- 373 bedrooms
- 94 bedrooms
- 35+ bedrooms
Average number of cars or other vehicles available in houses/condos:
Average number of cars or other vehicles available in apartments:
| This neighborhood: | 2.2 |
| Blue Island: | 1.9 |
Average number of cars or other vehicles available in apartments:
| Here: | 0.7 |
| city: | 1.1 |
Percentage of units with a mortgage:
| Fay's Point: | 25.7% |
| Blue Island: | 52.0% |
Average estimated value of detached houses in 2022 (37.4% of all units):
| Fay's Point: | $89,891 |
| Illinois: | $310,164 |
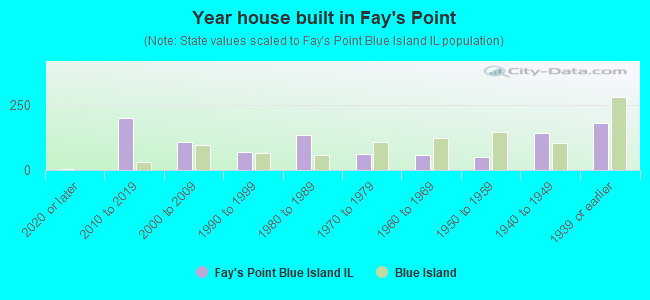
- Year house built in Fay's Point
- 32020 or later
- 2022010 to 2019
- 1072000 to 2009
- 691990 to 1999
- 1361980 to 1989
- 601970 to 1979
- 591960 to 1969
- 511950 to 1959
- 1441940 to 1949
- 1801939 or earlier
City-data.com crime index for city in 2020 (higher means more crime):
| City: | 156.2 |
| U.S. average: | 219.5 |
Travel time to work (commute)
![Travel time to work (commute)]()
- 28Less than 5 minutes
- 835 to 9 minutes
- 9310 to 14 minutes
- 13115 to 19 minutes
- 21820 to 24 minutes
- 2625 to 29 minutes
- 15430 to 34 minutes
- 6035 to 39 minutes
- 2640 to 44 minutes
- 10445 to 59 minutes
- 2160 to 89 minutes
- 1190 or more minutes

Means of transportation to work
![Means of transportation to work]()
- 62.2%437Drove a car alone
- 8.0%56Carpooled
- 15.7%110Bus
- 4.8%34Subway or elevated rail
- 5.5%39Long-distance train or commuter rail
- 0.6%4Motorcycle
- 4.1%29Walked
- 3.7%26Other means
- 6.8%48Worked at home

Time leaving home to go to work
![Time leaving home to go to work]()
- 8712:00 a.m. to 4:59 a.m.
- 915:00 a.m. to 5:29 a.m.
- 465:30 a.m. to 5:59 a.m.
- 696:00 a.m. to 6:29 a.m.
- 676:30 a.m. to 6:59 a.m.
- 977:00 a.m. to 7:29 a.m.
- 687:30 a.m. to 7:59 a.m.
- 848:00 a.m. to 8:29 a.m.
- 698:30 a.m. to 8:59 a.m.
- 269:00 a.m. to 9:59 a.m.
- 1210:00 a.m. to 10:59 a.m.
- 711:00 a.m. to 11:59 a.m.
- 18412:00 p.m. to 3:59 p.m.
- 864:00 p.m. to 11:59 p.m.

Occupations of males:
- Percentage of males in management occupations (except farmers):
Here: 14.5% city: 6.2%
- Percentage of males in arts, design, entertainment, sports, and media occupations:
Here: 4.8% city: 1.3%
- Percentage of males in service occupations:
Here: 10.6% city: 16.8%
- Percentage of males in sales and office occupations:
Here: 1.3% city: 13.5%
- Percentage of males in construction, extraction, and maintenance occupations:
Here: 29.4% city: 18.9%
- Percentage of males in production occupations:
Here: 12.2% city: 12.0%
- Percentage of males in transportation occupations:
Here: 3.4% city: 7.5%
- Percentage of males in material moving occupations:
Here: 10.5% city: 10.7%
Occupations of females:
- Percentage of females in management occupations (except farmers):
Here: 2.0% city: 9.0%
- Percentage of females in computer and mathematical occupations:
Here: 3.1% city: 0.4%
- Percentage of females in community and social services occupations:
Here: 6.7% city: 1.8%
- Percentage of females in healthcare practitioners and technical occupations:
Here: 8.9% city: 7.0%
- Percentage of females in service occupations:
Here: 16.0% city: 30.5%
- Percentage of females in sales and office occupations:
Here: 28.9% city: 26.7%
- Percentage of females in production occupations:
Here: 30.4% city: 8.0%
- Percentage of females in material moving occupations:
Here: 2.2% city: 2.5%
Percentage of people 16-64 in Armed Forces:
| Fay's Point: | 0.0% |
| Blue Island: | 0.0% |
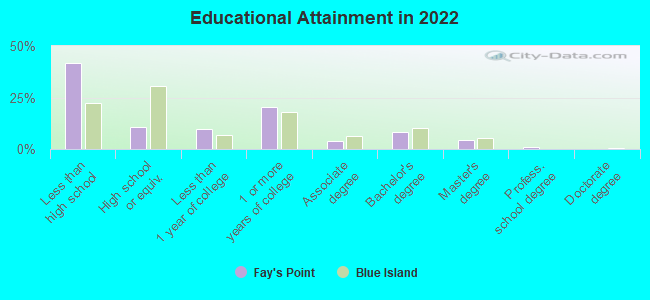
Education in this neighborhood (subdivision or community):
- Percentage of people 3 years and older in K-12 schools:
Fay's Point: 21.5% Blue Island: 17.3%
- Percentage of people 3 years and older in undergraduate colleges:
Fay's Point: 2.0% Blue Island: 5.0%
- Percentage of people 3 years and older in grad. or professional schools:
Fay's Point: 6.1% Blue Island: 1.1%
- Percentage of students K-12 enrolled in private schools:
Fay's Point: 23.9% Blue Island: 7.9%
Percentage of population below poverty level:
| Fay's Point: | 19.8% |
| Blue Island: | 18.7% |
Median year owner moved in (as recorded in 2022):
| Fay's Point: | 2002 |
| Blue Island: | 2002 |
Percentage of married-couple families with both working:
| Fay's Point: | 39.2% |
| Blue Island: | 47.0% |
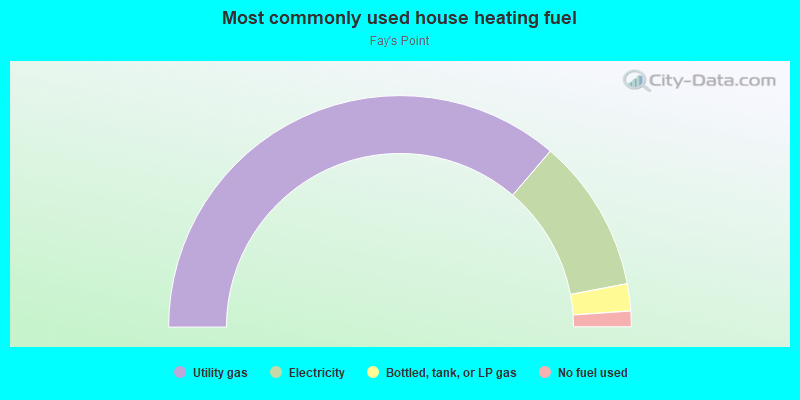
- 72.6%Utility gas
- 21.5%Electricity
- 3.8%Bottled, tank, or LP gas
- 2.2%No fuel used
Roads and streets:
Broadway St (Broadway)
Length: 1.47 miles
Directions: E-W, SE-NW
Address range: 1300 to 2129
Directions: E-W, SE-NW
Address range: 1300 to 2129
Jackson St
Length: 0.71 miles
Direction: E-W
Direction: E-W
I- 57 (W Leg Dan Ryan Expy, I- 57)
Length: 0.68 miles
Direction: N-S
Direction: N-S
Canal St
Length: 0.65 miles
Directions: E-W, N-S, SE-NW, SW-NE
Address range: 1700 to 2199
Directions: E-W, N-S, SE-NW, SW-NE
Address range: 1700 to 2199
Rolls Ave
Length: 0.47 miles
Directions: E-W, SE-NW
Directions: E-W, SE-NW
Desplaines St (Des Plaines St)
Length: 0.36 miles
Directions: E-W, SW-NE
Address range: 2000 to 2211
Directions: E-W, SW-NE
Address range: 2000 to 2211
Ashland Ave (S Ashland Ave)
Length: 0.34 miles
Direction: N-S
Address range: 13120 to 13499
Direction: N-S
Address range: 13120 to 13499
W Leg Dan Ryan Expy
Length: 0.34 miles
Direction: N-S
Direction: N-S
Division St
Length: 0.29 miles
Direction: N-S
Address range: 13224 to 13499
Direction: N-S
Address range: 13224 to 13499
Market St
Length: 0.27 miles
Direction: E-W
Address range: 2000 to 2129
Direction: E-W
Address range: 2000 to 2129
Seeley Ave
Length: 0.27 miles
Directions: N-S, SW-NE
Address range: 13300 to 13519
Directions: N-S, SW-NE
Address range: 13300 to 13519
Hoyne Ave
Length: 0.23 miles
Direction: N-S
Address range: 13300 to 13599
Direction: N-S
Address range: 13300 to 13599
135th Pl
Length: 0.23 miles
Directions: E-W, SW-NE
Address range: 2048 to 2171
Directions: E-W, SW-NE
Address range: 2048 to 2171
Chicago St
Length: 0.22 miles
Direction: N-S
Address range: 13300 to 13519
Direction: N-S
Address range: 13300 to 13519
Aulwurm Dr
Length: 0.17 miles
Directions: N-S, SE-NW
Address range: 13300 to 13363
Directions: N-S, SE-NW
Address range: 13300 to 13363
Chatham St
Length: 0.06 miles
Direction: N-S
Address range: 13414 to 13499
Direction: N-S
Address range: 13414 to 13499
Jackson St (W 134th St)
Length: 0.03 miles
Direction: E-W
Address range: 1374 to 1401
Direction: E-W
Address range: 1374 to 1401
Railroad features:
Baltimore and Ohio RR
Length: 0.09 miles
Direction: E-W
Direction: E-W
Other features:
Little Calumet Riv
Length: 1.37 miles
Directions: E-W, N-S, SW-NE
Directions: E-W, N-S, SW-NE