Fieldstone Terrace neighborhood in Derry, New Hampshire (NH), 03038 detailed profile
Settings
X


Business Search - 14 Million verified businesses
Area: 0.173 square miles
Population: 347
Population density:
| Fieldstone Terrace: | 2,001 people per square mile |
| Derry: | 1,493 people per square mile |

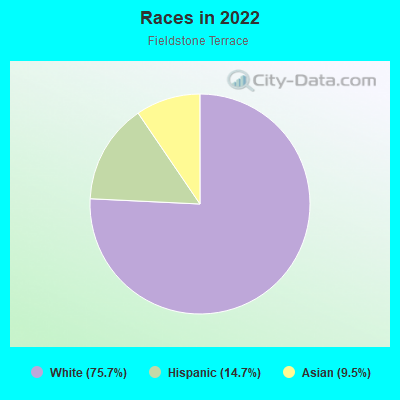
- 26275.7%White
- 5114.7%Hispanic or Latino
- 339.5%Asian
Median household income in 2022:
| Fieldstone Terrace: | $77,610 |
| Derry: | $83,750 |
Distribution of median household income
![Distribution of median household income]()
- 14Less than $10,000
- 16$10,000 to $19,999
- 8$20,000 to $29,999
- 7$30,000 to $39,999
- 17$40,000 to $49,999
- 18$50,000 to $59,999
- 17$60,000 to $74,999
- 28$75,000 to $99,999
- 14$100,000 to $124,999
- 19$125,000 to $149,999
- 36$150,000 to $199,999
- 8$200,000 or more

Distribution of owner-occupied house/condo value
![Distribution of owner-occupied house/condo value]()
- 7Less than $50,000
- 8$50,000 to $99,999
- 39$100,000 to $149,999
- 21$150,000 to $199,999
- 7$200,000 to $249,999
- 23$250,000 to $299,999
- 22$300,000 to $399,999
- 9$400,000 to $499,999
- 7$500,000 to $749,999
- 1$750,000 to $999,999

Distribution of rent paid by renters
![Distribution of rent paid by renters]()
- 7$100 to $199
- 7$200 to $299
- 41$300 to $399
- 3$500 to $599
- 15$600 to $699
- 3$700 to $799
- 1$800 to $899
- 2$900 to $999
- 13$1,000 to $1,249
- 9$1,250 to $1,499
- 8$1,500 to $1,999
- 2$2,000 or more

Median rent in 2022:
| Fieldstone Terrace: | $1,167 |
| Derry: | $1,280 |
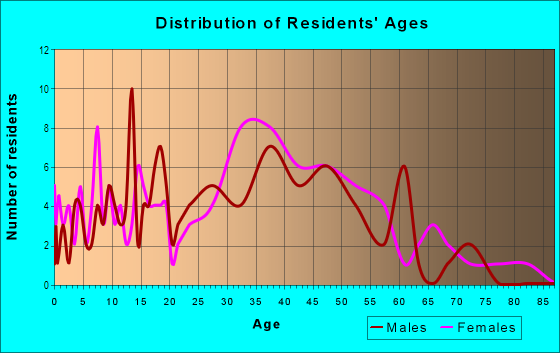
| Males: | 157 |
| Females: | 189 |
Males:
| This neighborhood: | 44.2 years |
| Whole city: | 37.9 years |
| This neighborhood: | 46.6 years |
| Whole city: | 39.5 years |
Average household size:
| Fieldstone Terrace: | 2.2 people |
| Derry: | 2.5 people |
Percentage of family households:
| Fieldstone Terrace: | 47.0% |
| Derry: | 51.8% |
| Here: | 27.9% |
| Derry: | 46.1% |
Percentage of married-couple families with children (among all households):
| Fieldstone Terrace: | 10.9% |
| Derry: | 23.3% |
Percentage of single-mother households (among all households):
| Fieldstone Terrace: | 20.6% |
| Derry: | 11.9% |
Percentage of never married males 15 years old and over:
Percentage of never married females 15 years old and over:
| Fieldstone Terrace: | 21.2% |
| Derry: | 16.3% |
Percentage of never married females 15 years old and over:
| Fieldstone Terrace: | 22.4% |
| place: | 17.5% |
Percentage of people that speak English not well or not at all:
| Fieldstone Terrace: | 0.0% |
| Derry: | 0.2% |
Percentage of people born in this state:
Percentage of people born in another U.S. state:
Percentage of native residents but born outside the U.S.:
Percentage of foreign born residents:
| Here: | 24.1% |
| Derry: | 27.6% |
Percentage of people born in another U.S. state:
| Fieldstone Terrace: | 69.1% |
| Derry: | 66.0% |
Percentage of native residents but born outside the U.S.:
| Here: | 1.3% |
| place: | 1.4% |
Percentage of foreign born residents:
| Here: | 5.5% |
| Derry: | 5.0% |
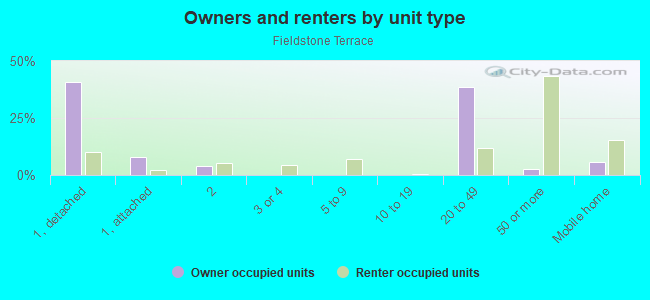
Owner-occupied
Renter-occupied

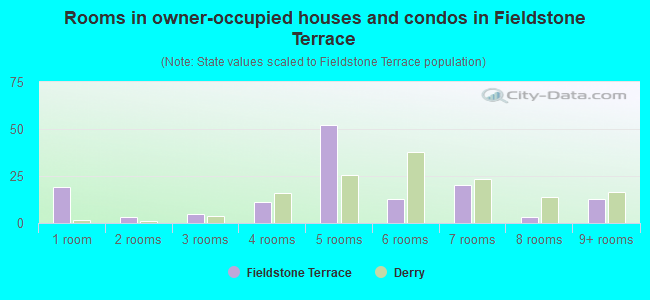
- Rooms in owner-occupied houses and condos in Fieldstone Terrace
- 191 room
- 32 rooms
- 53 rooms
- 114 rooms
- 525 rooms
- 136 rooms
- 207 rooms
- 38 rooms
- 139+ rooms
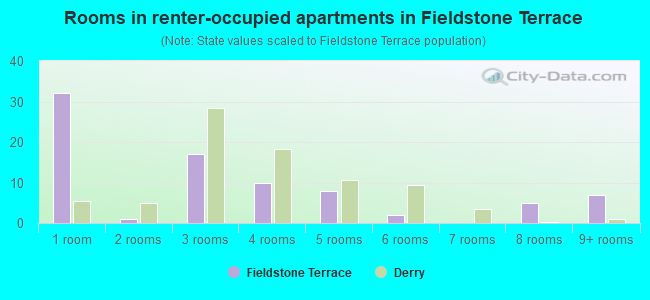
- Rooms in renter-occupied apartments in Fieldstone Terrace
- 321 room
- 12 rooms
- 173 rooms
- 104 rooms
- 85 rooms
- 26 rooms
- 07 rooms
- 58 rooms
- 79+ rooms
Owner-occupied
Renter-occupied
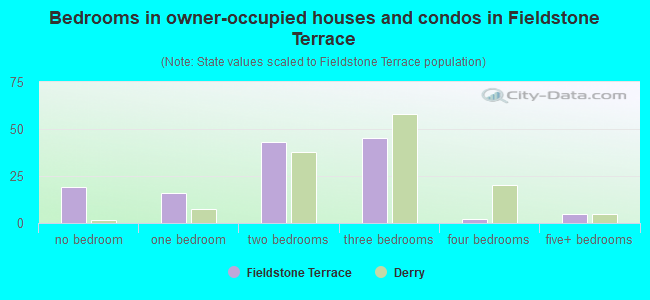
- Bedrooms in owner-occupied houses and condos in Fieldstone Terrace
- 19no bedroom
- 161 bedroom
- 432 bedrooms
- 453 bedrooms
- 24 bedrooms
- 55+ bedrooms
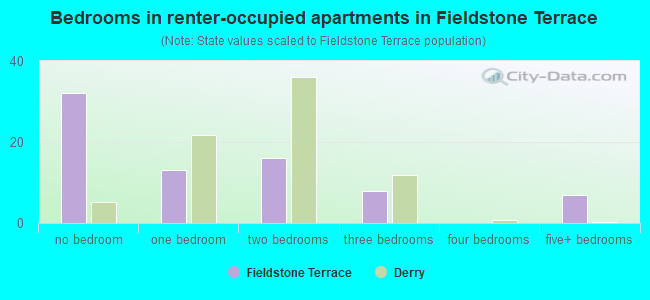
- Bedrooms in renter-occupied apartments in Fieldstone Terrace
- 32no bedroom
- 131 bedroom
- 162 bedrooms
- 83 bedrooms
- 04 bedrooms
- 75+ bedrooms
Average number of cars or other vehicles available in houses/condos:
Average number of cars or other vehicles available in apartments:
| This neighborhood: | 1.6 |
| Derry: | 2.2 |
Average number of cars or other vehicles available in apartments:
| Here: | 1.3 |
| place: | 1.3 |
Percentage of units with a mortgage:
| Fieldstone Terrace: | 72.7% |
| Derry: | 71.6% |
Housing prices:
- Average estimated value of detached houses in 2022 (41.1% of all units):
Fieldstone Terrace: $330,434 New Hampshire: $491,479
- Average estimated value of townhouses or other attached units in 2022 (7.4% of all units):
This neighborhood: $237,641 New Hampshire: $361,001
- Average estimated '22 value of housing units in 5-or-more-unit structures (2.5% of all units):
Fieldstone Terrace: $182,534 New Hampshire: $274,068
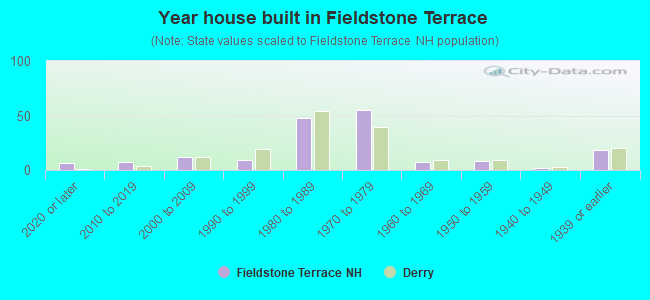
- Year house built in Fieldstone Terrace
- 62020 or later
- 72010 to 2019
- 122000 to 2009
- 91990 to 1999
- 481980 to 1989
- 551970 to 1979
- 71960 to 1969
- 81950 to 1959
- 21940 to 1949
- 181939 or earlier
City-data.com crime index for place in 2020 (higher means more crime):
| City: | 91.5 |
| U.S. average: | 219.5 |
Travel time to work (commute)
![Travel time to work (commute)]()
- 16Less than 5 minutes
- 245 to 9 minutes
- 1310 to 14 minutes
- 1215 to 19 minutes
- 1920 to 24 minutes
- 1825 to 29 minutes
- 1330 to 34 minutes
- 1535 to 39 minutes
- 940 to 44 minutes
- 1245 to 59 minutes
- 860 to 89 minutes
- 290 or more minutes

Means of transportation to work
![Means of transportation to work]()
- 64.8%134Drove a car alone
- 5.3%11Carpooled
- 1.9%4Walked
- 11.1%23Other means
- 18.4%38Worked at home

Time leaving home to go to work
![Time leaving home to go to work]()
- 1112:00 a.m. to 4:59 a.m.
- 25:00 a.m. to 5:29 a.m.
- 105:30 a.m. to 5:59 a.m.
- 166:00 a.m. to 6:29 a.m.
- 186:30 a.m. to 6:59 a.m.
- 147:00 a.m. to 7:29 a.m.
- 37:30 a.m. to 7:59 a.m.
- 268:00 a.m. to 8:29 a.m.
- 138:30 a.m. to 8:59 a.m.
- 129:00 a.m. to 9:59 a.m.
- 210:00 a.m. to 10:59 a.m.
- 411:00 a.m. to 11:59 a.m.
- 1812:00 p.m. to 3:59 p.m.
- 94:00 p.m. to 11:59 p.m.

Occupations of males:
- Percentage of males in management occupations (except farmers):
Here: 20.7% place: 14.1%
- Percentage of males in business and financial operations occupations:
Here: 2.3% place: 4.2%
- Percentage of males in computer and mathematical occupations:
Here: 4.4% place: 7.0%
- Percentage of males in architecture and engineering occupations:
Here: 13.4% place: 7.9%
- Percentage of males in education, training, and library occupations:
Here: 3.8% place: 1.7%
- Percentage of males in service occupations:
Here: 10.7% place: 11.4%
- Percentage of males in sales and office occupations:
Here: 31.8% place: 13.7%
- Percentage of males in construction, extraction, and maintenance occupations:
Here: 8.5% place: 7.8%
- Percentage of males in production occupations:
Here: 4.2% place: 11.4%
Occupations of females:
- Percentage of females in management occupations (except farmers):
Here: 12.3% place: 10.6%
- Percentage of females in computer and mathematical occupations:
Here: 2.4% place: 0.6%
- Percentage of females in community and social services occupations:
Here: 3.5% place: 1.6%
- Percentage of females in education, training, and library occupations:
Here: 3.2% place: 8.6%
- Percentage of females in arts, design, entertainment, sports, and media occupations:
Here: 2.8% place: 2.2%
- Percentage of females in healthcare practitioners and technical occupations:
Here: 16.4% place: 9.5%
- Percentage of females in service occupations:
Here: 10.1% place: 19.9%
- Percentage of females in sales and office occupations:
Here: 41.1% place: 27.0%
- Percentage of females in construction, extraction, and maintenance occupations:
Here: 11.9% place: 2.7%
- Percentage of females in production occupations:
Here: 4.0% place: 4.0%
- Percentage of females in transportation occupations:
Here: 3.8% place: 2.8%
Percentage of people 16-64 in Armed Forces:
| Fieldstone Terrace: | 1.1% |
| Derry: | 0.2% |
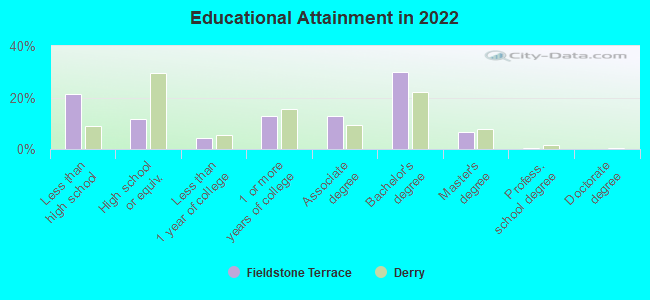
Education in this neighborhood (subdivision or community):
- Percentage of people 3 years and older in K-12 schools:
Fieldstone Terrace: 14.5% Derry: 15.8%
- Percentage of people 3 years and older in undergraduate colleges:
Fieldstone Terrace: 9.3% Derry: 5.1%
- Percentage of people 3 years and older in grad. or professional schools:
Fieldstone Terrace: 3.5% Derry: 2.0%
- Percentage of students K-12 enrolled in private schools:
Fieldstone Terrace: 18.0% Derry: 13.0%
Percentage of population below poverty level:
| Fieldstone Terrace: | 12.2% |
| Derry: | 9.9% |
Median year owner moved in (as recorded in 2022):
Median year renter moved in (as recorded in 2022):
| Fieldstone Terrace: | 2007 |
| Derry: | 2008 |
Median year renter moved in (as recorded in 2022):
| Fieldstone Terrace: | 2014 |
| Derry: | 2016 |
Percentage of married-couple families with both working:
| Fieldstone Terrace: | 205.3% |
| Derry: | 68.6% |
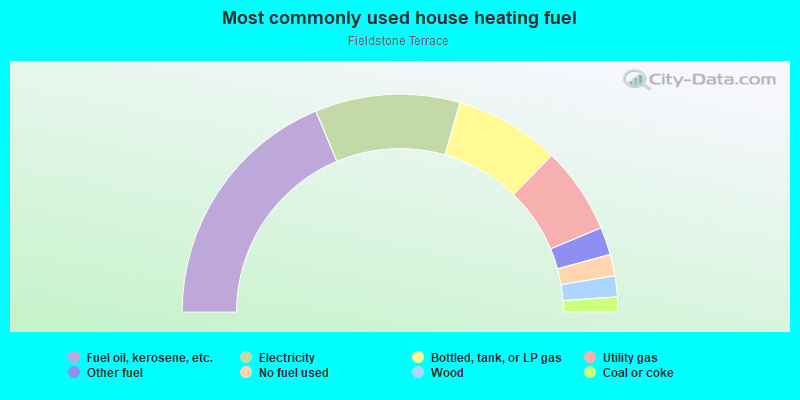
- 37.4%Fuel oil, kerosene, etc.
- 21.5%Electricity
- 15.6%Bottled, tank, or LP gas
- 12.9%Utility gas
- 4.1%Other fuel
- 3.2%No fuel used
- 3.1%Wood
- 2.2%Coal or coke
Highways in this neighborhood:
N Main St (State Rte 28 Byp)
Length: 0.13 miles
Direction: SE-NW
Address range: 13 to 23
Direction: SE-NW
Address range: 13 to 23
Roads and streets:
Pinkerton St
Length: 0.89 miles
Directions: E-W, SE-NW, SW-NE
Address range: 1 to 99
Directions: E-W, SE-NW, SW-NE
Address range: 1 to 99
Solar Dr
Length: 0.24 miles
Directions: N-S, SE-NW, SW-NE
Directions: N-S, SE-NW, SW-NE
Energy Ln
Length: 0.03 miles
Directions: E-W, N-S, SW-NE
Directions: E-W, N-S, SW-NE