Folwell neighborhood in Minneapolis, Minnesota (MN), 55412 detailed profile
Settings
X

Business Search - 14 Million verified businesses
Area: 0.556 square miles
Population: 5,675
Population density:
| Folwell: | 10,201 people per square mile |
| Minneapolis: | 7,744 people per square mile |

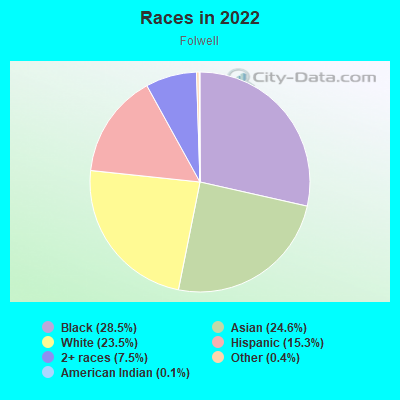
- 2,19028.5%Black
- 1,89224.6%Asian
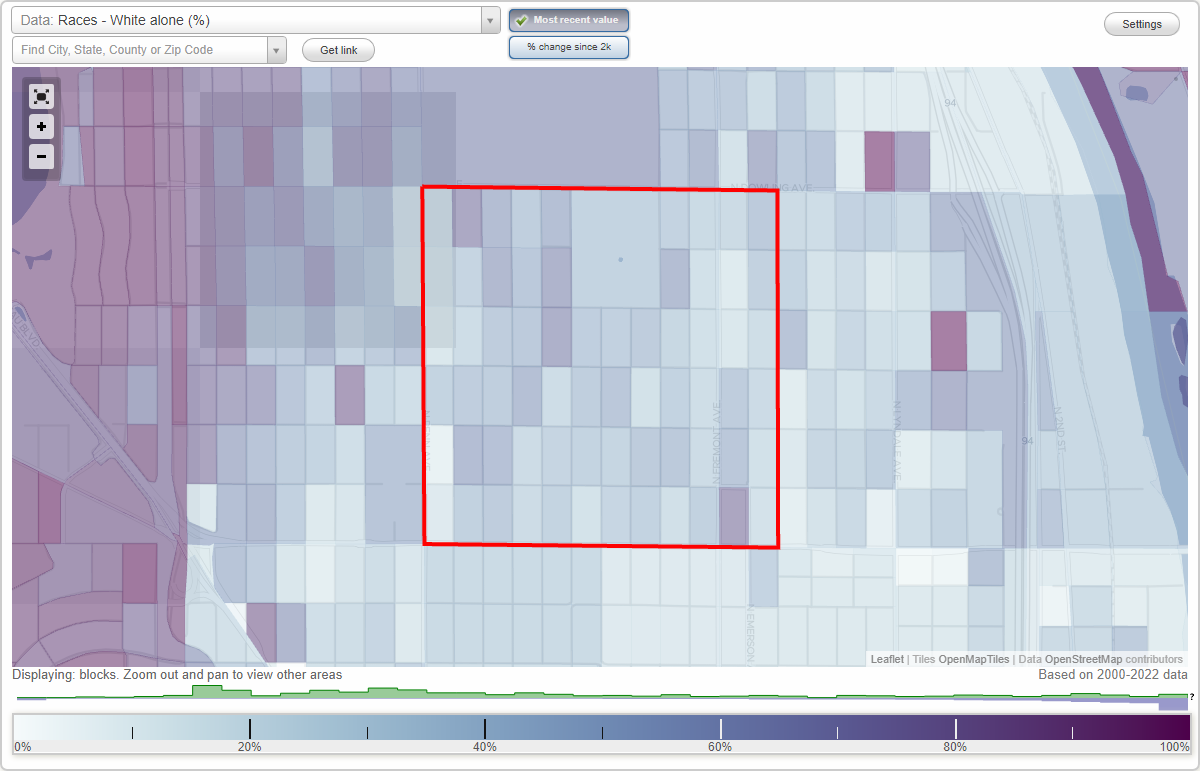
- 1,80223.5%White
- 1,17215.3%Hispanic or Latino
- 5767.5%Two or more races
- 340.4%Some other race
- 110.1%American Indian
Median household income in 2022:
| Folwell: | $70,375 |
| Minneapolis: | $74,473 |
Distribution of median household income
![Distribution of median household income]()
- 112Less than $10,000
- 326$10,000 to $19,999
- 324$20,000 to $29,999
- 70$30,000 to $39,999
- 478$40,000 to $49,999
- 304$50,000 to $59,999
- 65$60,000 to $74,999
- 499$75,000 to $99,999
- 315$100,000 to $124,999
- 91$125,000 to $149,999
- 184$150,000 to $199,999
- 94$200,000 or more

Distribution of owner-occupied house/condo value
![Distribution of owner-occupied house/condo value]()
- 396Less than $50,000
- 242$50,000 to $99,999
- 423$100,000 to $149,999
- 468$150,000 to $199,999
- 321$200,000 to $249,999
- 206$250,000 to $299,999
- 107$300,000 to $399,999
- 31$400,000 to $499,999
- 25$500,000 to $749,999
- 301$1,000,000 or more

Distribution of rent paid by renters
![Distribution of rent paid by renters]()
- 16$200 to $299
- 52$400 to $499
- 416$600 to $699
- 79$700 to $799
- 86$800 to $899
- 153$900 to $999
- 59$1,000 to $1,249
- 55$1,250 to $1,499
- 380$1,500 to $1,999
- 28$2,000 or more

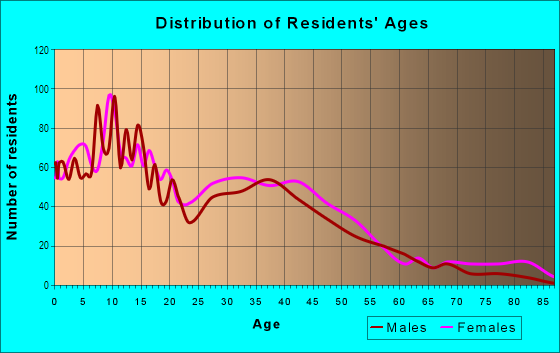
| Males: | 2,795 |
| Females: | 2,880 |
Males:
| This neighborhood: | 29.9 years |
| Whole city: | 33.3 years |
| This neighborhood: | 34.9 years |
| Whole city: | 33.2 years |
Average household size:
| Folwell: | 9.9 people |
| Minneapolis: | 2.1 people |
Percentage of family households:
| Folwell: | 49.7% |
| Minneapolis: | 34.1% |
| Here: | 23.5% |
| Minneapolis: | 29.8% |
Percentage of married-couple families with children (among all households):
| Folwell: | 16.5% |
| Minneapolis: | 31.8% |
Percentage of single-mother households (among all households):
| Folwell: | 11.1% |
| Minneapolis: | 10.5% |
Percentage of never married males 15 years old and over:
Percentage of never married females 15 years old and over:
| Folwell: | 35.8% |
| Minneapolis: | 27.0% |
Percentage of never married females 15 years old and over:
| Folwell: | 18.8% |
| city: | 25.4% |
Percentage of people that speak English not well or not at all:
| Folwell: | 2.5% |
| Minneapolis: | 3.8% |
Percentage of people born in this state:
Percentage of people born in another U.S. state:
Percentage of native residents but born outside the U.S.:
Percentage of foreign born residents:
| Here: | 63.7% |
| Minneapolis: | 51.9% |
Percentage of people born in another U.S. state:
| Folwell: | 22.5% |
| Minneapolis: | 31.8% |
Percentage of native residents but born outside the U.S.:
| Here: | 0.8% |
| city: | 1.5% |
Percentage of foreign born residents:
| Here: | 13.0% |
| Minneapolis: | 14.7% |
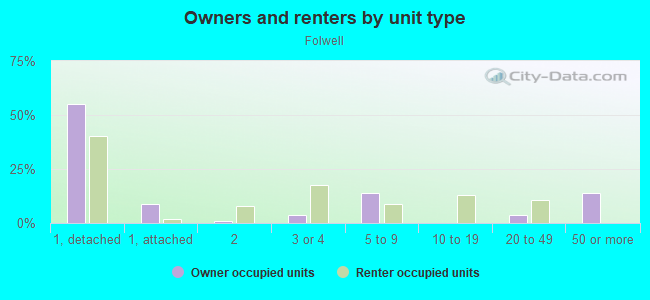
Owner-occupied
Renter-occupied

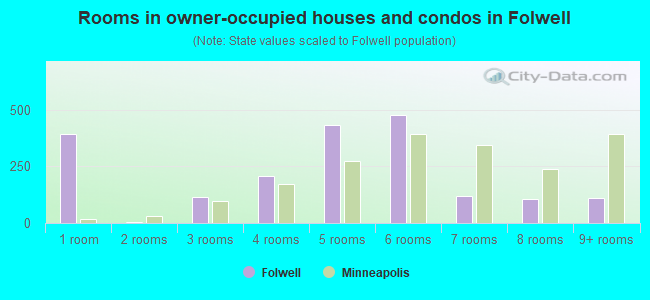
- Rooms in owner-occupied houses and condos in Folwell
- 3911 room
- 52 rooms
- 1173 rooms
- 2074 rooms
- 4355 rooms
- 4776 rooms
- 1187 rooms
- 1058 rooms
- 1119+ rooms
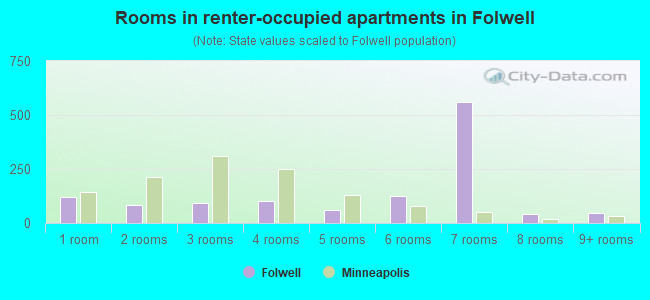
- Rooms in renter-occupied apartments in Folwell
- 1191 room
- 852 rooms
- 943 rooms
- 1014 rooms
- 615 rooms
- 1266 rooms
- 5617 rooms
- 418 rooms
- 459+ rooms
Owner-occupied
Renter-occupied
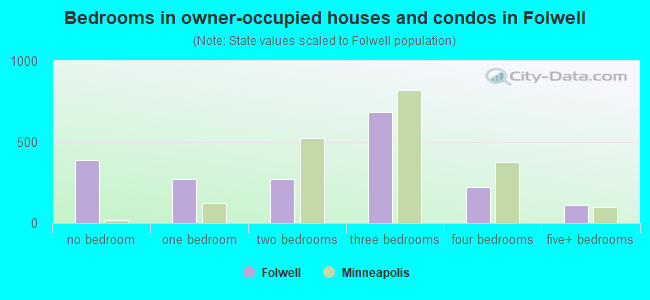
- Bedrooms in owner-occupied houses and condos in Folwell
- 391no bedroom
- 2741 bedroom
- 2742 bedrooms
- 6853 bedrooms
- 2224 bedrooms
- 1115+ bedrooms
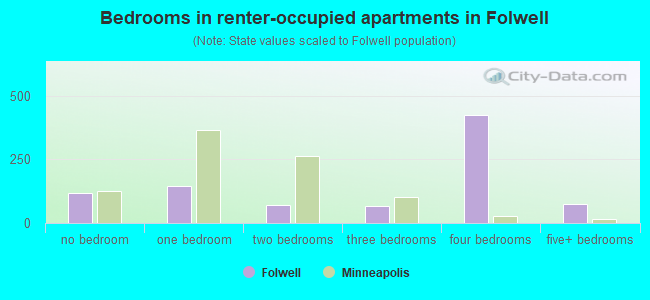
- Bedrooms in renter-occupied apartments in Folwell
- 119no bedroom
- 1461 bedroom
- 702 bedrooms
- 673 bedrooms
- 4254 bedrooms
- 755+ bedrooms
Average number of cars or other vehicles available in houses/condos:
Average number of cars or other vehicles available in apartments:
| This neighborhood: | 1.7 |
| Minneapolis: | 1.6 |
Average number of cars or other vehicles available in apartments:
| Here: | |
| city: |
Percentage of units with a mortgage:
| Folwell: | 84.4% |
| Minneapolis: | 71.8% |
Average estimated value of detached houses in 2022 (82.8% of all units):
| Folwell: | $296,292 |
| Minnesota: | $374,552 |
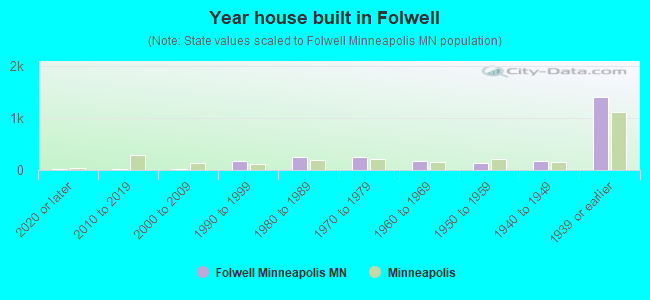
- Year house built in Folwell
- 162020 or later
- 232010 to 2019
- 182000 to 2009
- 1641990 to 1999
- 2521980 to 1989
- 2461970 to 1979
- 1831960 to 1969
- 1281950 to 1959
- 1641940 to 1949
- 1,4011939 or earlier
City-data.com crime index for city in 2020 (higher means more crime):
| City: | 600.2 |
| U.S. average: | 219.5 |
Travel time to work (commute)
![Travel time to work (commute)]()
- 31Less than 5 minutes
- 735 to 9 minutes
- 29110 to 14 minutes
- 29215 to 19 minutes
- 47820 to 24 minutes
- 13825 to 29 minutes
- 75130 to 34 minutes
- 5235 to 39 minutes
- 7740 to 44 minutes
- 15145 to 59 minutes
- 10060 to 89 minutes
- 2690 or more minutes

Means of transportation to work
![Means of transportation to work]()
- 56.2%1,467Drove a car alone
- 6.5%170Carpooled
- 13.2%345Bus
- 7.4%192Light rail, streetcar or trolley
- 2.9%75Taxi
- 4.5%117Motorcycle
- 3.3%85Bicycle
- 0.8%20Walked
- 4.1%106Other means
- 21.2%553Worked at home

Time leaving home to go to work
![Time leaving home to go to work]()
- 8412:00 a.m. to 4:59 a.m.
- 485:00 a.m. to 5:29 a.m.
- 1175:30 a.m. to 5:59 a.m.
- 2656:00 a.m. to 6:29 a.m.
- 766:30 a.m. to 6:59 a.m.
- 5637:00 a.m. to 7:29 a.m.
- 2397:30 a.m. to 7:59 a.m.
- 1708:00 a.m. to 8:29 a.m.
- 1958:30 a.m. to 8:59 a.m.
- 789:00 a.m. to 9:59 a.m.
- 12110:00 a.m. to 10:59 a.m.
- 6311:00 a.m. to 11:59 a.m.
- 19412:00 p.m. to 3:59 p.m.
- 2154:00 p.m. to 11:59 p.m.

Occupations of males:
- Percentage of males in management occupations (except farmers):
Here: 8.3% city: 12.1%
- Percentage of males in business and financial operations occupations:
Here: 3.8% city: 9.1%
- Percentage of males in computer and mathematical occupations:
Here: 13.9% city: 8.4%
- Percentage of males in architecture and engineering occupations:
Here: 4.1% city: 4.6%
- Percentage of males in healthcare practitioners and technical occupations:
Here: 1.5% city: 3.6%
- Percentage of males in service occupations:
Here: 19.5% city: 12.6%
- Percentage of males in sales and office occupations:
Here: 15.0% city: 15.3%
- Percentage of males in construction, extraction, and maintenance occupations:
Here: 1.8% city: 3.3%
- Percentage of males in production occupations:
Here: 1.0% city: 5.8%
- Percentage of males in transportation occupations:
Here: 2.9% city: 4.1%
- Percentage of males in material moving occupations:
Here: 15.2% city: 3.6%
Occupations of females:
- Percentage of females in management occupations (except farmers):
Here: 7.3% city: 11.4%
- Percentage of females in business and financial operations occupations:
Here: 2.8% city: 9.8%
- Percentage of females in computer and mathematical occupations:
Here: 3.5% city: 2.6%
- Percentage of females in life, physical, and social science occupations:
Here: 7.2% city: 2.3%
- Percentage of females in community and social services occupations:
Here: 4.9% city: 3.8%
- Percentage of females in education, training, and library occupations:
Here: 12.3% city: 10.6%
- Percentage of females in arts, design, entertainment, sports, and media occupations:
Here: 3.2% city: 5.6%
- Percentage of females in healthcare practitioners and technical occupations:
Here: 2.1% city: 8.3%
- Percentage of females in service occupations:
Here: 18.1% city: 17.8%
- Percentage of females in sales and office occupations:
Here: 29.5% city: 18.7%
- Percentage of females in production occupations:
Here: 4.4% city: 2.7%
- Percentage of females in transportation occupations:
Here: 1.6% city: 0.9%
- Percentage of females in material moving occupations:
Here: 1.7% city: 1.5%
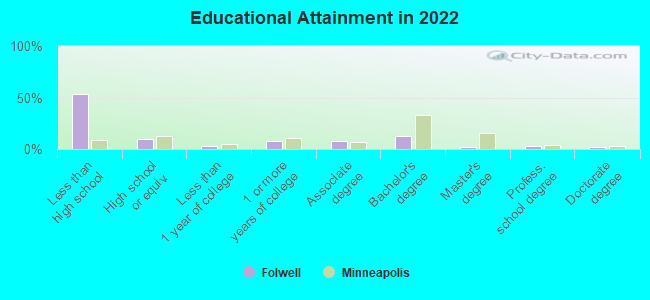
Education in this neighborhood (subdivision or community):
- Percentage of people 3 years and older in K-12 schools:
Folwell: 42.2% Minneapolis: 14.0%
- Percentage of people 3 years and older in undergraduate colleges:
Folwell: 6.0% Minneapolis: 8.6%
- Percentage of people 3 years and older in grad. or professional schools:
Folwell: 9.2% Minneapolis: 2.9%
- Percentage of students K-12 enrolled in private schools:
Folwell: 24.4% Minneapolis: 14.1%
Percentage of population below poverty level:
| Folwell: | 11.8% |
| Minneapolis: | 17.2% |
Median year owner moved in (as recorded in 2022):
| Folwell: | 2009 |
| Minneapolis: | 2012 |
Percentage of married-couple families with both working:
| Folwell: | 108.5% |
| Minneapolis: | 73.9% |
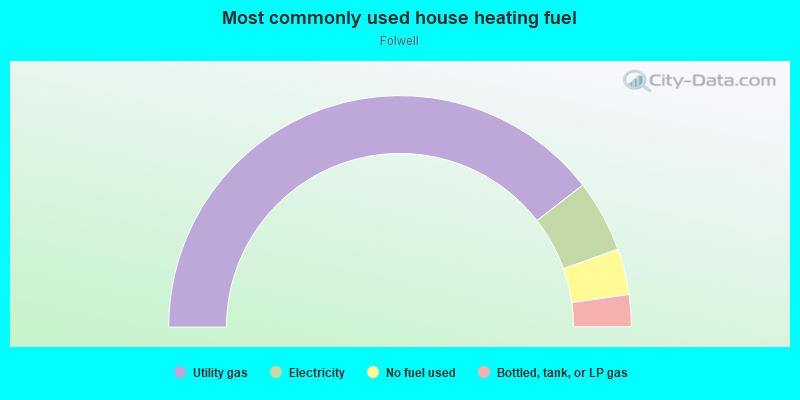
- 79.0%Utility gas
- 10.1%Electricity
- 6.4%No fuel used
- 4.5%Bottled, tank, or LP gas
Roads and streets:
36th Ave N
Length: 0.96 miles
Direction: E-W
Address range: 1100 to 2123
Direction: E-W
Address range: 1100 to 2123
34th Ave N
Length: 0.96 miles
Direction: E-W
Address range: 1100 to 2123
Direction: E-W
Address range: 1100 to 2123
33rd Ave N
Length: 0.96 miles
Direction: E-W
Address range: 1100 to 2123
Direction: E-W
Address range: 1100 to 2123
35th Ave N
Length: 0.96 miles
Direction: E-W
Address range: 1100 to 2123
Direction: E-W
Address range: 1100 to 2123
Lowry Ave N (Co Rd 153)
Length: 0.96 miles
Direction: E-W
Address range: 1100 to 2151
Direction: E-W
Address range: 1100 to 2151
37th Ave N
Length: 0.70 miles
Direction: E-W
Address range: 1100 to 2123
Direction: E-W
Address range: 1100 to 2123
Morgan Ave N
Length: 0.62 miles
Directions: N-S, SE-NW, SW-NE
Address range: 3200 to 3699
Directions: N-S, SE-NW, SW-NE
Address range: 3200 to 3699
Newton Ave N
Length: 0.62 miles
Directions: N-S, SE-NW, SW-NE
Address range: 3200 to 3699
Directions: N-S, SE-NW, SW-NE
Address range: 3200 to 3699
Humboldt Ave N
Length: 0.62 miles
Directions: N-S, SW-NE
Address range: 3200 to 3699
Directions: N-S, SW-NE
Address range: 3200 to 3699
Fremont Ave N
Length: 0.62 miles
Directions: N-S, SE-NW
Address range: 3234 to 3699
Directions: N-S, SE-NW
Address range: 3234 to 3699
Knox Ave N
Length: 0.62 miles
Directions: N-S, SE-NW
Address range: 3254 to 3699
Directions: N-S, SE-NW
Address range: 3254 to 3699
Logan Ave N
Length: 0.62 miles
Direction: N-S
Address range: 3256 to 3699
Direction: N-S
Address range: 3256 to 3699
Girard Ave N
Length: 0.62 miles
Directions: N-S, SE-NW
Address range: 3254 to 3699
Directions: N-S, SE-NW
Address range: 3254 to 3699
Oliver Ave N
Length: 0.62 miles
Directions: N-S, SE-NW
Address range: 3256 to 3699
Directions: N-S, SE-NW
Address range: 3256 to 3699
Emerson Ave N
Length: 0.62 miles
Directions: N-S, SE-NW
Address range: 3201 to 3699
Directions: N-S, SE-NW
Address range: 3201 to 3699
James Ave N
Length: 0.50 miles
Directions: N-S, SE-NW
Address range: 3201 to 3599
Directions: N-S, SE-NW
Address range: 3201 to 3599
Irving Ave N
Length: 0.50 miles
Direction: N-S
Address range: 3256 to 3599
Direction: N-S
Address range: 3256 to 3599
Dupont Ave N
Length: 0.37 miles
Directions: N-S, SE-NW
Address range: 3200 to 3699
Directions: N-S, SE-NW
Address range: 3200 to 3699