Fort Superhighway (Fort Superhighway Subdivision) neighborhood in Lincoln Park, Michigan (MI), 48146 detailed profile
Settings
X


Business Search - 14 Million verified businesses
Area: 0.295 square miles
Population: 3,256
Population density:
| Fort Superhighway (Fort Superhighway Subdivision): | 11,043 people per square mile |
| Lincoln Park: | 6,801 people per square mile |

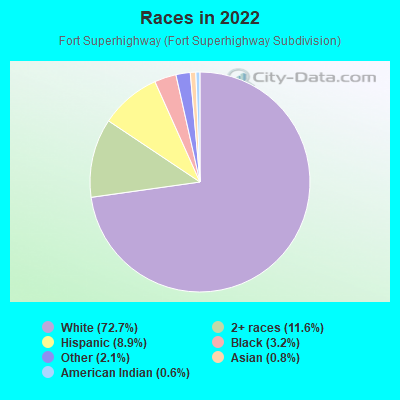
- 2,61372.7%White
- 41611.6%Two or more races
- 3218.9%Hispanic or Latino
- 1153.2%Black
- 772.1%Some other race
- 290.8%Asian
- 210.6%American Indian
Median household income in 2022:
| Fort Superhighway (Fort Superhighway Subdivision): | $53,902 |
| Lincoln Park: | $55,777 |
Distribution of median household income
![Distribution of median household income]()
- 107Less than $10,000
- 155$10,000 to $19,999
- 111$20,000 to $29,999
- 211$30,000 to $39,999
- 109$40,000 to $49,999
- 122$50,000 to $59,999
- 69$60,000 to $74,999
- 238$75,000 to $99,999
- 168$100,000 to $124,999
- 86$125,000 to $149,999
- 72$150,000 to $199,999
- 38$200,000 or more

Distribution of owner-occupied house/condo value
![Distribution of owner-occupied house/condo value]()
- 151Less than $50,000
- 471$50,000 to $99,999
- 406$100,000 to $149,999
- 154$150,000 to $199,999
- 53$200,000 to $249,999
- 20$250,000 to $299,999
- 3$400,000 to $499,999
- 5$1,000,000 or more

Distribution of rent paid by renters
![Distribution of rent paid by renters]()
- 42$200 to $299
- 13$300 to $399
- 10$400 to $499
- 42$500 to $599
- 91$600 to $699
- 108$700 to $799
- 43$800 to $899
- 65$900 to $999
- 157$1,000 to $1,249
- 35$1,250 to $1,499
- 28$1,500 to $1,999

Median rent in 2022:
| Fort Superhighway (Fort Superhighway Subdivision): | $837 |
| Lincoln Park: | $753 |
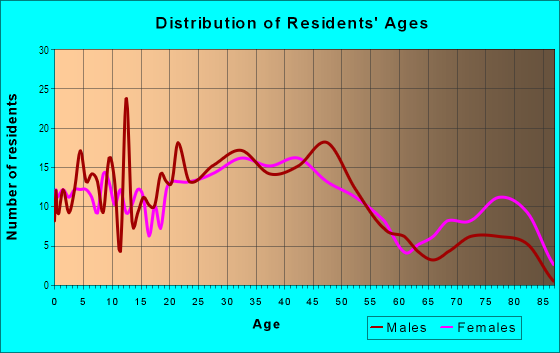
| Males: | 1,597 |
| Females: | 1,658 |
Males:
| This neighborhood: | 34.0 years |
| Whole city: | 33.8 years |
| This neighborhood: | 34.2 years |
| Whole city: | 35.4 years |
Average household size:
| Fort Superhighway (Fort Superhighway Subdivision): | 2.5 people |
| Lincoln Park: | 2.6 people |
Percentage of family households:
| Fort Superhighway (Fort Superhighway Subdivision): | 46.6% |
| Lincoln Park: | 44.6% |
| Here: | 40.4% |
| Lincoln Park: | 34.7% |
Percentage of married-couple families with children (among all households):
| Fort Superhighway (Fort Superhighway Subdivision): | 28.4% |
| Lincoln Park: | 22.5% |
Percentage of single-mother households (among all households):
| Fort Superhighway (Fort Superhighway Subdivision): | 7.5% |
| Lincoln Park: | 9.8% |
Percentage of never married males 15 years old and over:
Percentage of never married females 15 years old and over:
| Fort Superhighway (Fort Superhighway Subdivision): | 18.1% |
| Lincoln Park: | 22.7% |
Percentage of never married females 15 years old and over:
| Fort Superhighway (Fort Superhighway Subdivision): | 17.8% |
| city: | 18.0% |
Percentage of people that speak English not well or not at all:
| Fort Superhighway (Fort Superhighway Subdivision): | 2.3% |
| Lincoln Park: | 3.5% |
Percentage of people born in this state:
Percentage of people born in another U.S. state:
Percentage of native residents but born outside the U.S.:
Percentage of foreign born residents:
| Here: | 86.9% |
| Lincoln Park: | 77.8% |
Percentage of people born in another U.S. state:
| Fort Superhighway (Fort Superhighway Subdivision): | 8.5% |
| Lincoln Park: | 10.7% |
Percentage of native residents but born outside the U.S.:
| Here: | 1.2% |
| city: | 1.1% |
Percentage of foreign born residents:
| Here: | 4.0% |
| Lincoln Park: | 10.4% |
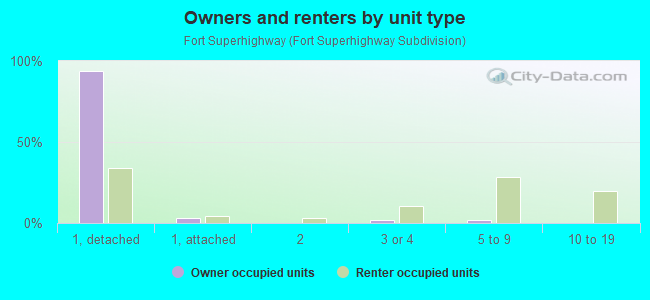
Owner-occupied
Renter-occupied

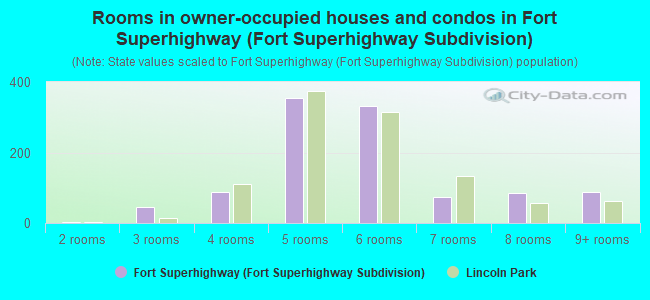
- Rooms in owner-occupied houses and condos in Fort Superhighway <
> - 01 room
- 32 rooms
- 463 rooms
- 874 rooms
- 3565 rooms
- 3326 rooms
- 737 rooms
- 858 rooms
- 899+ rooms
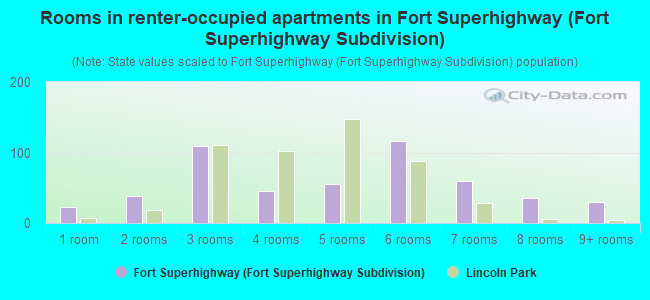
- Rooms in renter-occupied apartments in Fort Superhighway <
> - 231 room
- 382 rooms
- 1093 rooms
- 454 rooms
- 565 rooms
- 1166 rooms
- 597 rooms
- 358 rooms
- 309+ rooms
Owner-occupied
Renter-occupied
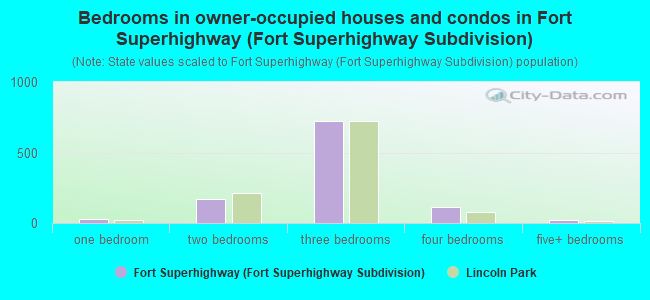
- Bedrooms in owner-occupied houses and condos in Fort Superhighway <
> - 0no bedroom
- 271 bedroom
- 1672 bedrooms
- 7203 bedrooms
- 1164 bedrooms
- 215+ bedrooms
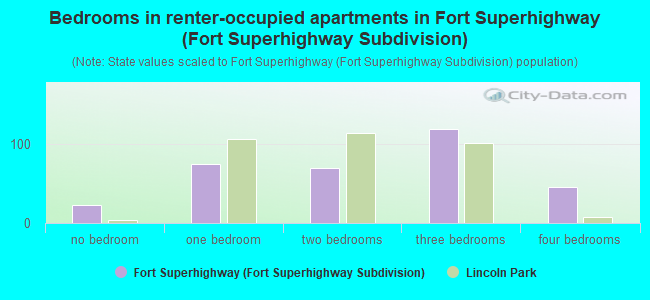
- Bedrooms in renter-occupied apartments in Fort Superhighway <
> - 23no bedroom
- 751 bedroom
- 692 bedrooms
- 1193 bedrooms
- 464 bedrooms
- 05+ bedrooms
Average number of cars or other vehicles available in houses/condos:
Average number of cars or other vehicles available in apartments:
| This neighborhood: | 1.8 |
| Lincoln Park: | 1.9 |
Average number of cars or other vehicles available in apartments:
| Here: | 1.3 |
| city: | 1.2 |
Percentage of units with a mortgage:
| Fort Superhighway (Fort Superhighway Subdivision): | 59.0% |
| Lincoln Park: | 51.3% |
Average estimated value of detached houses in 2022 (88.3% of all units):
| Fort Superhighway (Fort Superhighway Subdivision): | $110,672 |
| Michigan: | $280,038 |
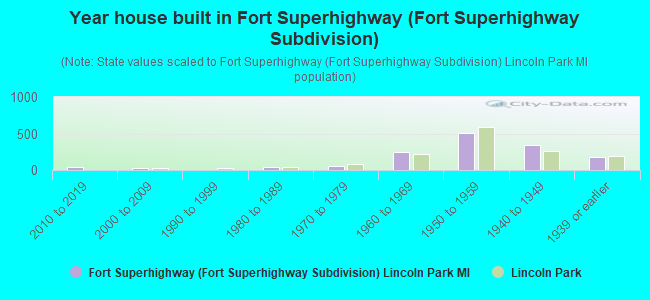
- Year house built in Fort Superhighway <
> - 02020 or later
- 472010 to 2019
- 272000 to 2009
- 41990 to 1999
- 391980 to 1989
- 551970 to 1979
- 2411960 to 1969
- 5131950 to 1959
- 3421940 to 1949
- 1801939 or earlier
City-data.com crime index for city in 2020 (higher means more crime):
| City: | 261.8 |
| U.S. average: | 219.5 |
Travel time to work (commute)
![Travel time to work (commute)]()
- 10Less than 5 minutes
- 995 to 9 minutes
- 9610 to 14 minutes
- 15515 to 19 minutes
- 10820 to 24 minutes
- 8125 to 29 minutes
- 11730 to 34 minutes
- 3935 to 39 minutes
- 2440 to 44 minutes
- 16045 to 59 minutes
- 2560 to 89 minutes
- 1290 or more minutes

Means of transportation to work
![Means of transportation to work]()
- 82.9%1,230Drove a car alone
- 7.9%117Carpooled
- 0.1%1Bus
- 3.0%45Bicycle
- 2.9%43Walked
- 1.2%18Other means
- 8.3%123Worked at home

Time leaving home to go to work
![Time leaving home to go to work]()
- 3112:00 a.m. to 4:59 a.m.
- 225:00 a.m. to 5:29 a.m.
- 605:30 a.m. to 5:59 a.m.
- 936:00 a.m. to 6:29 a.m.
- 686:30 a.m. to 6:59 a.m.
- 877:00 a.m. to 7:29 a.m.
- 967:30 a.m. to 7:59 a.m.
- 688:00 a.m. to 8:29 a.m.
- 638:30 a.m. to 8:59 a.m.
- 299:00 a.m. to 9:59 a.m.
- 2510:00 a.m. to 10:59 a.m.
- 911:00 a.m. to 11:59 a.m.
- 6712:00 p.m. to 3:59 p.m.
- 984:00 p.m. to 11:59 p.m.

Occupations of males:
- Percentage of males in management occupations (except farmers):
Here: 4.8% city: 5.7%
- Percentage of males in business and financial operations occupations:
Here: 3.8% city: 2.7%
- Percentage of males in architecture and engineering occupations:
Here: 2.8% city: 2.3%
- Percentage of males in education, training, and library occupations:
Here: 1.2% city: 1.3%
- Percentage of males in arts, design, entertainment, sports, and media occupations:
Here: 1.5% city: 1.5%
- Percentage of males in healthcare practitioners and technical occupations:
Here: 1.8% city: 2.1%
- Percentage of males in service occupations:
Here: 12.6% city: 11.6%
- Percentage of males in sales and office occupations:
Here: 12.2% city: 14.3%
- Percentage of males in construction, extraction, and maintenance occupations:
Here: 13.9% city: 12.1%
- Percentage of males in production occupations:
Here: 13.0% city: 15.5%
- Percentage of males in transportation occupations:
Here: 9.9% city: 8.1%
- Percentage of males in material moving occupations:
Here: 12.9% city: 13.4%
Occupations of females:
- Percentage of females in management occupations (except farmers):
Here: 5.4% city: 7.7%
- Percentage of females in business and financial operations occupations:
Here: 6.3% city: 5.3%
- Percentage of females in computer and mathematical occupations:
Here: 2.0% city: 1.1%
- Percentage of females in community and social services occupations:
Here: 2.3% city: 1.9%
- Percentage of females in legal occupations:
Here: 2.5% city: 0.6%
- Percentage of females in education, training, and library occupations:
Here: 7.3% city: 4.0%
- Percentage of females in healthcare practitioners and technical occupations:
Here: 7.4% city: 5.1%
- Percentage of females in service occupations:
Here: 26.1% city: 27.3%
- Percentage of females in sales and office occupations:
Here: 20.9% city: 31.0%
- Percentage of females in production occupations:
Here: 6.2% city: 6.3%
- Percentage of females in material moving occupations:
Here: 5.0% city: 5.7%
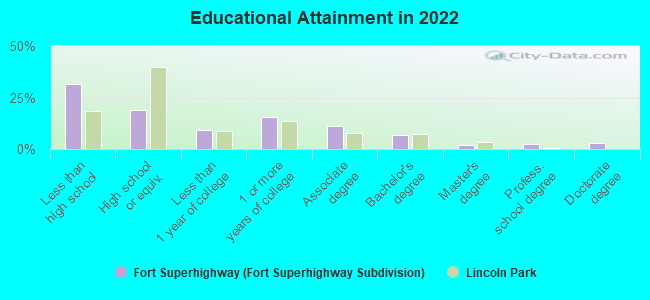
Education in this neighborhood (subdivision or community):
- Percentage of people 3 years and older in K-12 schools:
Fort Superhighway (Fort Superhighway Subdivision): 22.3% Lincoln Park: 17.8%
- Percentage of people 3 years and older in undergraduate colleges:
Fort Superhighway (Fort Superhighway Subdivision): 3.0% Lincoln Park: 4.3%
- Percentage of people 3 years and older in grad. or professional schools:
Fort Superhighway (Fort Superhighway Subdivision): 2.0% Lincoln Park: 0.6%
- Percentage of students K-12 enrolled in private schools:
Fort Superhighway (Fort Superhighway Subdivision): 41.4% Lincoln Park: 9.0%
Percentage of population below poverty level:
| Fort Superhighway (Fort Superhighway Subdivision): | 15.6% |
| Lincoln Park: | 19.8% |
Median year owner moved in (as recorded in 2022):
Median year renter moved in (as recorded in 2022):
| Fort Superhighway (Fort Superhighway Subdivision): | 2004 |
| Lincoln Park: | 2007 |
Median year renter moved in (as recorded in 2022):
| Fort Superhighway (Fort Superhighway Subdivision): | 2012 |
| Lincoln Park: | 2016 |
Percentage of married-couple families with both working:
| Fort Superhighway (Fort Superhighway Subdivision): | 66.6% |
| Lincoln Park: | 49.8% |
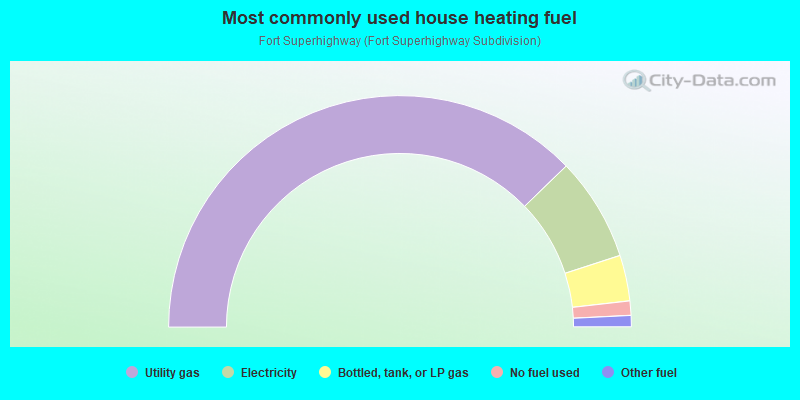
- 75.6%Utility gas
- 14.5%Electricity
- 6.4%Bottled, tank, or LP gas
- 2.0%No fuel used
- 1.6%Other fuel
Highways in this neighborhood:
State Hwy 85 (Fort St)
Length: 0.90 miles
Direction: N-S
Direction: N-S
Roads and streets:
Riverbank St
Length: 0.63 miles
Direction: E-W
Address range: 1300 to 1699
Direction: E-W
Address range: 1300 to 1699
Moran Ave
Length: 0.62 miles
Direction: E-W
Address range: 1300 to 1699
Direction: E-W
Address range: 1300 to 1699
Michigan Blvd
Length: 0.61 miles
Direction: E-W
Address range: 1300 to 1699
Direction: E-W
Address range: 1300 to 1699
Leblanc St
Length: 0.57 miles
Direction: E-W
Address range: 1250 to 1699
Direction: E-W
Address range: 1250 to 1699
Ford Blvd
Length: 0.55 miles
Direction: E-W
Address range: 1300 to 1699
Direction: E-W
Address range: 1300 to 1699
St Johns Blvd
Length: 0.50 miles
Directions: E-W, SW-NE
Address range: 1250 to 1699
Directions: E-W, SW-NE
Address range: 1250 to 1699
Howard St
Length: 0.47 miles
Directions: N-S, SE-NW
Address range: 3700 to 4093
Directions: N-S, SE-NW
Address range: 3700 to 4093
Abbott Ave
Length: 0.44 miles
Directions: N-S, SE-NW, SW-NE
Address range: 3675 to 4074
Directions: N-S, SE-NW, SW-NE
Address range: 3675 to 4074
Emmons Blvd
Length: 0.41 miles
Direction: E-W
Address range: 1400 to 1699
Direction: E-W
Address range: 1400 to 1699
Goddard St
Length: 0.37 miles
Directions: E-W, SE-NW
Address range: 1493 to 1625
Directions: E-W, SE-NW
Address range: 1493 to 1625
Lafayette Blvd
Length: 0.34 miles
Direction: N-S
Address range: 3800 to 4099
Direction: N-S
Address range: 3800 to 4099
Drouillard Ave
Length: 0.05 miles
Direction: N-S
Direction: N-S
Michigan Ave
Length: 0.04 miles
Direction: E-W
Direction: E-W
Other features:
South Branch Ecorse Riv (Ecorse River S Br)
Length: 0.29 miles
Directions: E-W, SW-NE
Directions: E-W, SW-NE
Ecorse River S Br
Length: 0.21 miles
Directions: E-W, SE-NW
Directions: E-W, SE-NW