Foster Park neighborhood in Fort Worth, Texas (TX), 76109 detailed profile
Settings
X


Business Search - 14 Million verified businesses
Area: 0.604 square miles
Population: 1,893
Population density:
| Foster Park: | 3,133 people per square mile |
| Fort Worth: | 3,286 people per square mile |

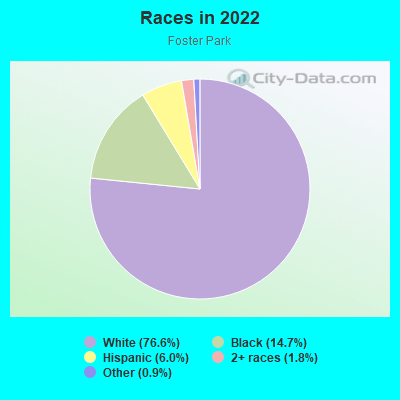
- 1,70376.6%White
- 32614.7%Black
- 1336.0%Hispanic or Latino
- 401.8%Two or more races
- 200.9%Some other race
Median household income in 2022:
| Foster Park: | $135,928 |
| Fort Worth: | $71,527 |
Distribution of median household income
![Distribution of median household income]()
- 91Less than $10,000
- 64$10,000 to $19,999
- 49$20,000 to $29,999
- 31$30,000 to $39,999
- 49$40,000 to $49,999
- 13$50,000 to $59,999
- 49$60,000 to $74,999
- 38$75,000 to $99,999
- 93$100,000 to $124,999
- 58$125,000 to $149,999
- 120$150,000 to $199,999
- 220$200,000 or more

Distribution of owner-occupied house/condo value
![Distribution of owner-occupied house/condo value]()
- 190Less than $50,000
- 316$50,000 to $99,999
- 165$100,000 to $149,999
- 42$150,000 to $199,999
- 24$200,000 to $249,999
- 39$250,000 to $299,999
- 58$300,000 to $399,999
- 170$400,000 to $499,999
- 174$500,000 to $749,999
- 73$750,000 to $999,999
- 65$1,000,000 or more

Distribution of rent paid by renters
![Distribution of rent paid by renters]()
- 43$200 to $299
- 29$500 to $599
- 39$700 to $799
- 54$800 to $899
- 58$900 to $999
- 15$1,000 to $1,249
- 49$1,250 to $1,499
- 28$1,500 to $1,999
- 108$2,000 or more

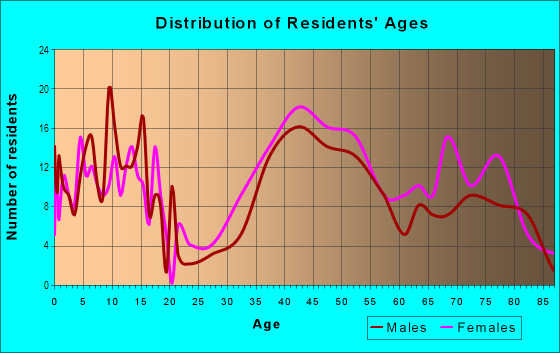
| Males: | 882 |
| Females: | 1,010 |
Males:
| This neighborhood: | 36.1 years |
| Whole city: | 33.6 years |
| This neighborhood: | 41.4 years |
| Whole city: | 34.8 years |
Average household size:
| Foster Park: | 2.7 people |
| Fort Worth: | 2.7 people |
Percentage of family households:
| Foster Park: | 58.6% |
| Fort Worth: | 52.4% |
| Here: | 63.8% |
| Fort Worth: | 48.2% |
Percentage of married-couple families with children (among all households):
| Foster Park: | 25.9% |
| Fort Worth: | 25.9% |
Percentage of single-mother households (among all households):
| Foster Park: | 9.1% |
| Fort Worth: | 7.4% |
Percentage of never married males 15 years old and over:
Percentage of never married females 15 years old and over:
| Foster Park: | 8.3% |
| Fort Worth: | 18.5% |
Percentage of never married females 15 years old and over:
| Foster Park: | 13.0% |
| city: | 17.3% |
Percentage of people that speak English not well or not at all:
| Foster Park: | 2.6% |
| Fort Worth: | 6.5% |
Percentage of people born in this state:
Percentage of people born in another U.S. state:
Percentage of native residents but born outside the U.S.:
Percentage of foreign born residents:
| Here: | 58.6% |
| Fort Worth: | 55.0% |
Percentage of people born in another U.S. state:
| Foster Park: | 33.1% |
| Fort Worth: | 26.2% |
Percentage of native residents but born outside the U.S.:
| Here: | 5.1% |
| city: | 2.1% |
Percentage of foreign born residents:
| Here: | 3.2% |
| Fort Worth: | 16.6% |
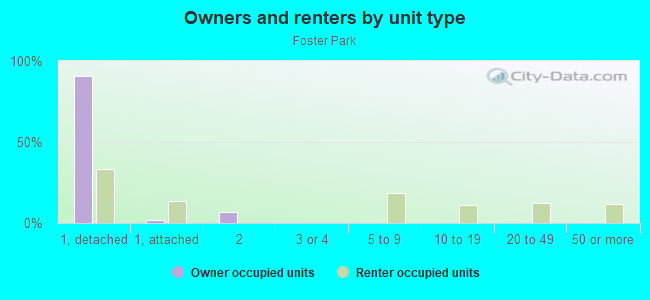
Owner-occupied
Renter-occupied

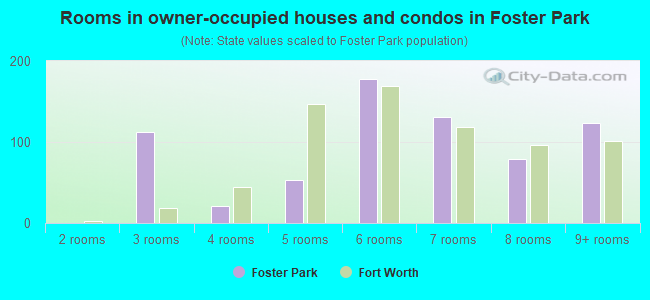
- Rooms in owner-occupied houses and condos in Foster Park
- 01 room
- 02 rooms
- 1123 rooms
- 214 rooms
- 535 rooms
- 1786 rooms
- 1317 rooms
- 798 rooms
- 1239+ rooms
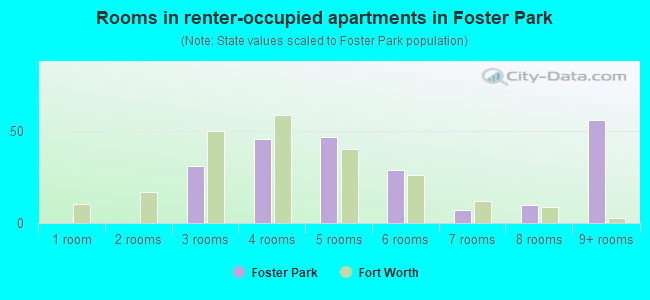
- Rooms in renter-occupied apartments in Foster Park
- 01 room
- 02 rooms
- 313 rooms
- 464 rooms
- 475 rooms
- 296 rooms
- 77 rooms
- 108 rooms
- 569+ rooms
Owner-occupied
Renter-occupied
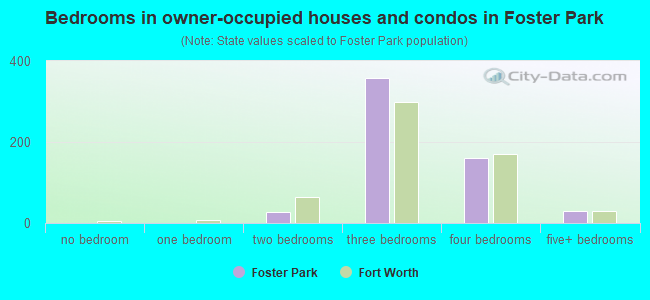
- Bedrooms in owner-occupied houses and condos in Foster Park
- 0no bedroom
- 01 bedroom
- 272 bedrooms
- 3583 bedrooms
- 1614 bedrooms
- 305+ bedrooms
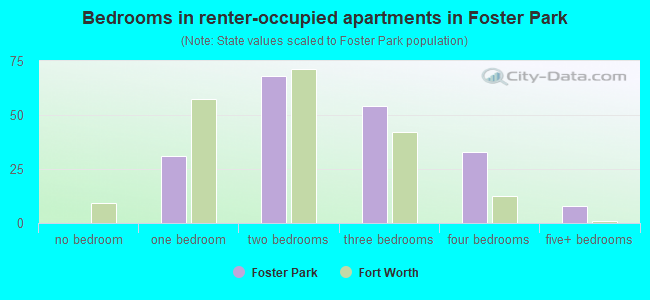
- Bedrooms in renter-occupied apartments in Foster Park
- 0no bedroom
- 311 bedroom
- 682 bedrooms
- 543 bedrooms
- 334 bedrooms
- 85+ bedrooms
Average number of cars or other vehicles available in houses/condos:
Average number of cars or other vehicles available in apartments:
| This neighborhood: | 2.0 |
| Fort Worth: | 2.1 |
Average number of cars or other vehicles available in apartments:
| Here: | 2.0 |
| city: | 1.5 |
Percentage of units with a mortgage:
| Foster Park: | 62.8% |
| Fort Worth: | 61.2% |
Average estimated value of detached houses in 2022 (99.0% of all units):
| Foster Park: | $560,843 |
| Fort Worth: | $264,175 |
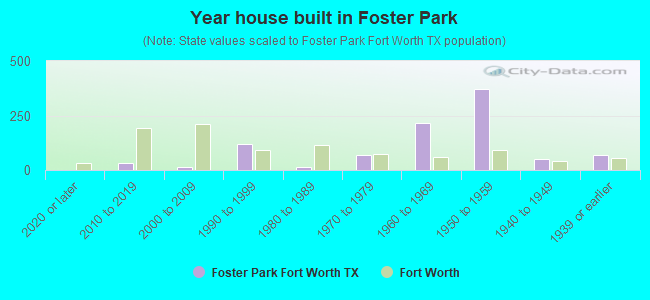
- Year house built in Foster Park
- 02020 or later
- 342010 to 2019
- 122000 to 2009
- 1201990 to 1999
- 131980 to 1989
- 701970 to 1979
- 2161960 to 1969
- 3721950 to 1959
- 511940 to 1949
- 711939 or earlier
City-data.com crime index for city in 2020 (higher means more crime):
| City: | 303.1 |
| U.S. average: | 219.5 |
Travel time to work (commute)
![Travel time to work (commute)]()
- 3Less than 5 minutes
- 495 to 9 minutes
- 15010 to 14 minutes
- 21815 to 19 minutes
- 11220 to 24 minutes
- 2725 to 29 minutes
- 3930 to 34 minutes
- 635 to 39 minutes
- 2240 to 44 minutes
- 6345 to 59 minutes
- 1860 to 89 minutes
- 790 or more minutes

Means of transportation to work
![Means of transportation to work]()
- 75.2%661Drove a car alone
- 2.2%19Carpooled
- 1.6%14Bicycle
- 33.3%293Walked
- 2.5%22Other means
- 21.3%187Worked at home

Time leaving home to go to work
![Time leaving home to go to work]()
- 412:00 a.m. to 4:59 a.m.
- 355:00 a.m. to 5:29 a.m.
- 185:30 a.m. to 5:59 a.m.
- 386:00 a.m. to 6:29 a.m.
- 346:30 a.m. to 6:59 a.m.
- 757:00 a.m. to 7:29 a.m.
- 1487:30 a.m. to 7:59 a.m.
- 1298:00 a.m. to 8:29 a.m.
- 548:30 a.m. to 8:59 a.m.
- 719:00 a.m. to 9:59 a.m.
- 3110:00 a.m. to 10:59 a.m.
- 1211:00 a.m. to 11:59 a.m.
- 3212:00 p.m. to 3:59 p.m.
- 54:00 p.m. to 11:59 p.m.

Occupations of males:
- Percentage of males in management occupations (except farmers):
Here: 16.1% city: 11.7%
- Percentage of males in business and financial operations occupations:
Here: 13.8% city: 4.9%
- Percentage of males in computer and mathematical occupations:
Here: 3.4% city: 4.3%
- Percentage of males in architecture and engineering occupations:
Here: 5.8% city: 3.4%
- Percentage of males in community and social services occupations:
Here: 1.6% city: 0.9%
- Percentage of males in legal occupations:
Here: 1.8% city: 0.8%
- Percentage of males in education, training, and library occupations:
Here: 7.4% city: 2.9%
- Percentage of males in arts, design, entertainment, sports, and media occupations:
Here: 3.2% city: 1.3%
- Percentage of males in healthcare practitioners and technical occupations:
Here: 3.2% city: 2.6%
- Percentage of males in sales and office occupations:
Here: 33.2% city: 15.8%
- Percentage of males in transportation occupations:
Here: 7.0% city: 7.1%
- Percentage of males in material moving occupations:
Here: 1.1% city: 7.1%
Occupations of females:
- Percentage of females in management occupations (except farmers):
Here: 12.3% city: 9.6%
- Percentage of females in business and financial operations occupations:
Here: 7.7% city: 6.3%
- Percentage of females in architecture and engineering occupations:
Here: 2.3% city: 0.8%
- Percentage of females in life, physical, and social science occupations:
Here: 2.3% city: 0.5%
- Percentage of females in community and social services occupations:
Here: 4.0% city: 2.2%
- Percentage of females in legal occupations:
Here: 7.8% city: 1.2%
- Percentage of females in education, training, and library occupations:
Here: 9.5% city: 9.5%
- Percentage of females in arts, design, entertainment, sports, and media occupations:
Here: 1.3% city: 1.8%
- Percentage of females in healthcare practitioners and technical occupations:
Here: 7.4% city: 7.9%
- Percentage of females in service occupations:
Here: 9.2% city: 20.2%
- Percentage of females in sales and office occupations:
Here: 27.0% city: 28.3%
- Percentage of females in production occupations:
Here: 3.3% city: 3.5%
- Percentage of females in transportation occupations:
Here: 1.2% city: 1.8%
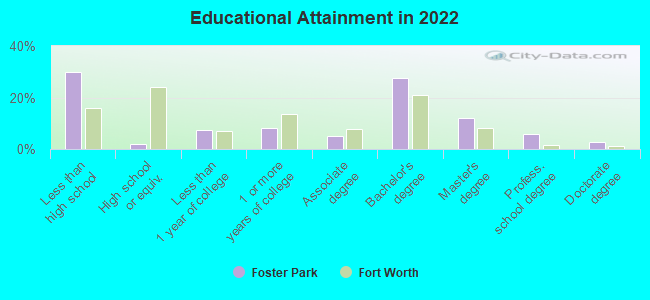
Education in this neighborhood (subdivision or community):
- Percentage of people 3 years and older in K-12 schools:
Foster Park: 21.9% Fort Worth: 20.3%
- Percentage of people 3 years and older in undergraduate colleges:
Foster Park: 7.8% Fort Worth: 4.7%
- Percentage of people 3 years and older in grad. or professional schools:
Foster Park: 1.5% Fort Worth: 1.6%
- Percentage of students K-12 enrolled in private schools:
Foster Park: 34.3% Fort Worth: 7.2%
Percentage of population below poverty level:
| Foster Park: | 8.3% |
| Fort Worth: | 12.0% |
Median year owner moved in (as recorded in 2022):
Median year renter moved in (as recorded in 2022):
| Foster Park: | 2009 |
| Fort Worth: | 2013 |
Median year renter moved in (as recorded in 2022):
| Foster Park: | 2017 |
| Fort Worth: | 2020 |
Percentage of married-couple families with both working:
| Foster Park: | 123.6% |
| Fort Worth: | 71.2% |
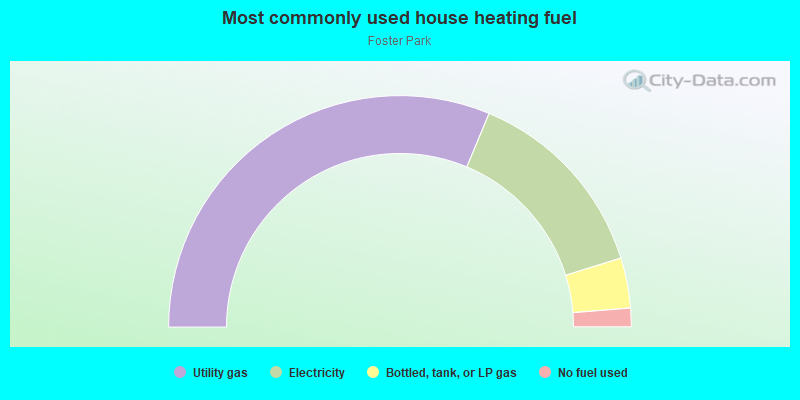
- 62.6%Utility gas
- 27.8%Electricity
- 7.0%Bottled, tank, or LP gas
- 2.6%No fuel used
Roads and streets:
South Dr
Length: 1.05 miles
Directions: E-W, SW-NE
Address range: 3700 to 4699
Directions: E-W, SW-NE
Address range: 3700 to 4699
E Hildring Dr (Hildring Dr E)
Length: 1.00 miles
Directions: N-S, SW-NE
Address range: 4009 to 4899
Directions: N-S, SW-NE
Address range: 4009 to 4899
Bilglade Rd
Length: 0.89 miles
Directions: E-W, N-S, SE-NW
Address range: 3866 to 4399
Directions: E-W, N-S, SE-NW
Address range: 3866 to 4399
W Selkirk Dr
Length: 0.75 miles
Directions: E-W, SE-NW
Address range: 4100 to 4399
Directions: E-W, SE-NW
Address range: 4100 to 4399
Lanark Ave
Length: 0.75 miles
Directions: E-W, SE-NW
Address range: 4100 to 4399
Directions: E-W, SE-NW
Address range: 4100 to 4399
Whitfield Ave
Length: 0.70 miles
Directions: E-W, SE-NW
Address range: 4100 to 4399
Directions: E-W, SE-NW
Address range: 4100 to 4399
Granbury Rd (Old Granbury Rd)
Length: 0.68 miles
Direction: SW-NE
Address range: 4500 to 4899
Direction: SW-NE
Address range: 4500 to 4899
Selkirk Dr
Length: 0.68 miles
Directions: E-W, N-S, SW-NE
Address range: 4300 to 4899
Directions: E-W, N-S, SW-NE
Address range: 4300 to 4899
Norwich Dr
Length: 0.51 miles
Directions: N-S, SE-NW, SW-NE
Address range: 4200 to 4699
Directions: N-S, SE-NW, SW-NE
Address range: 4200 to 4699
Weyburn Dr
Length: 0.46 miles
Directions: E-W, N-S, SE-NW, SW-NE
Address range: 3800 to 3999
Directions: E-W, N-S, SE-NW, SW-NE
Address range: 3800 to 3999
Ranier Ct
Length: 0.43 miles
Directions: N-S, SE-NW
Address range: 4000 to 4299
Directions: N-S, SE-NW
Address range: 4000 to 4299
Warnock Ct
Length: 0.43 miles
Directions: N-S, SE-NW, SW-NE
Address range: 4100 to 4499
Directions: N-S, SE-NW, SW-NE
Address range: 4100 to 4499
Inwood Rd
Length: 0.41 miles
Directions: N-S, SE-NW
Address range: 4300 to 4899
Directions: N-S, SE-NW
Address range: 4300 to 4899
Inverness Ave
Length: 0.35 miles
Directions: E-W, SW-NE
Address range: 4603 to 4999
Directions: E-W, SW-NE
Address range: 4603 to 4999
SW Loop 820
Length: 0.24 miles
Direction: SE-NW
Direction: SE-NW
Trail Lake Dr
Length: 0.23 miles
Directions: N-S, SE-NW
Address range: 4350 to 4599
Directions: N-S, SE-NW
Address range: 4350 to 4599
Galway Ave
Length: 0.21 miles
Directions: E-W, SE-NW
Address range: 4100 to 4299
Directions: E-W, SE-NW
Address range: 4100 to 4299
Heywood Ave
Length: 0.20 miles
Directions: E-W, SW-NE
Address range: 3800 to 3899
Directions: E-W, SW-NE
Address range: 3800 to 3899
Shellbrook Ave
Length: 0.15 miles
Direction: E-W
Address range: 3800 to 3899
Direction: E-W
Address range: 3800 to 3899
Lambert Ave
Length: 0.14 miles
Directions: E-W, SW-NE
Address range: 3800 to 3899
Directions: E-W, SW-NE
Address range: 3800 to 3899
Westmont Ct
Length: 0.14 miles
Directions: N-S, SE-NW
Address range: 4200 to 4299
Directions: N-S, SE-NW
Address range: 4200 to 4299
Walden Ave
Length: 0.12 miles
Directions: N-S, SW-NE
Address range: 4900 to 5099
Directions: N-S, SW-NE
Address range: 4900 to 5099
Altura Rd
Length: 0.10 miles
Direction: E-W
Address range: 4100 to 4200
Direction: E-W
Address range: 4100 to 4200
Westlake Dr
Length: 0.05 miles
Direction: N-S
Address range: 4400 to 4499
Direction: N-S
Address range: 4400 to 4499
Hildring Ct
Length: 0.04 miles
Direction: E-W
Address range: 4000 to 4099
Direction: E-W
Address range: 4000 to 4099
Devon Ct
Length: 0.04 miles
Direction: E-W
Address range: 4000 to 4099
Direction: E-W
Address range: 4000 to 4099
Lashburn Ct
Length: 0.03 miles
Direction: SW-NE
Address range: 4000 to 4099
Direction: SW-NE
Address range: 4000 to 4099
Glenavon Ct
Length: 0.03 miles
Direction: E-W
Address range: 4000 to 4099
Direction: E-W
Address range: 4000 to 4099
Railroad features:
at and Sf Rlwy
Length: 0.68 miles
Direction: SW-NE
Direction: SW-NE