Franklin neighborhood in Provo, Utah (UT), 84601 detailed profile
Settings
X

Business Search - 14 Million verified businesses
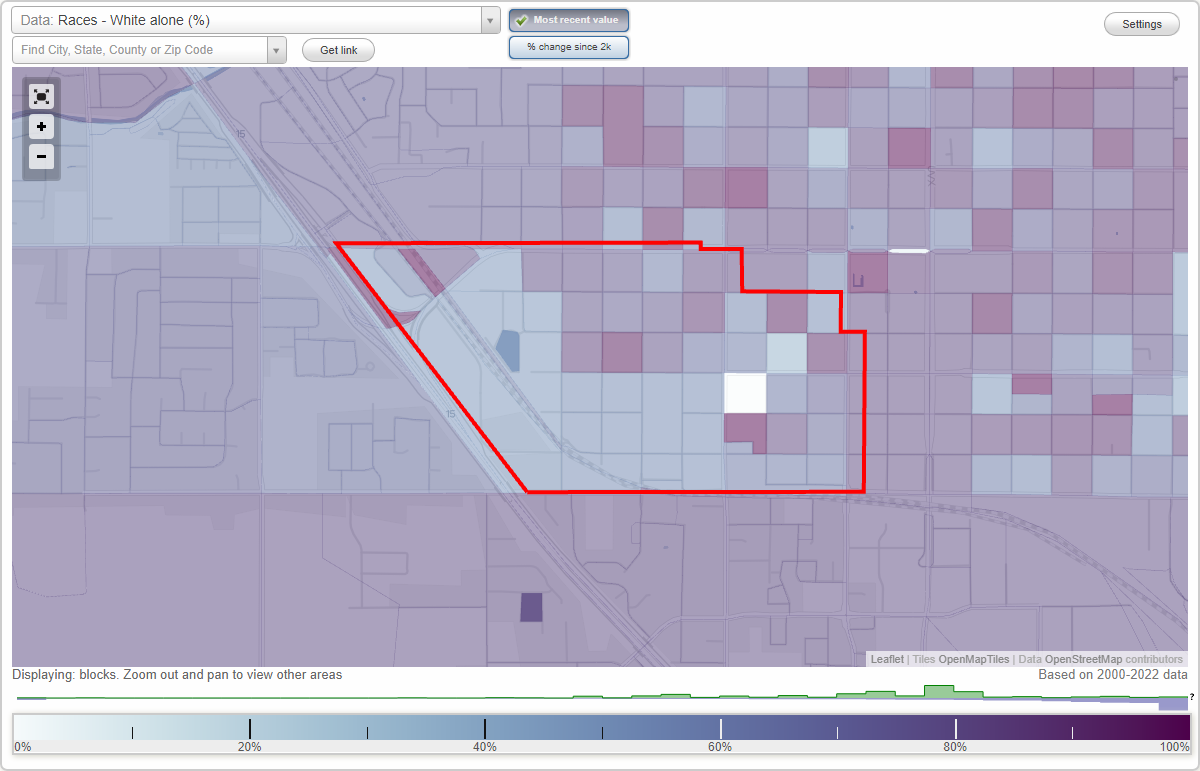
Area: 0.515 square miles
Population: 5,066
Population density:
| Franklin: | 9,828 people per square mile |
| Provo: | 2,864 people per square mile |

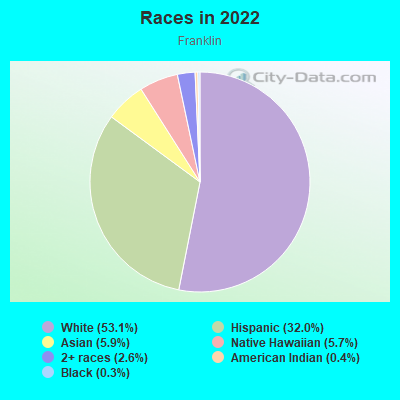
- 2,86653.1%White
- 1,72932.0%Hispanic or Latino
- 3185.9%Asian
- 3065.7%Native Hawaiian and Other
Pacific Islander - 1402.6%Two or more races
- 200.4%American Indian
- 160.3%Black
Median household income in 2022:
| Franklin: | $58,259 |
| Provo: | $59,290 |
Distribution of median household income
![Distribution of median household income]()
- 66Less than $10,000
- 195$10,000 to $19,999
- 188$20,000 to $29,999
- 107$30,000 to $39,999
- 227$40,000 to $49,999
- 201$50,000 to $59,999
- 208$60,000 to $74,999
- 246$75,000 to $99,999
- 197$100,000 to $124,999
- 57$125,000 to $149,999
- 256$150,000 to $199,999
- 140$200,000 or more

Distribution of owner-occupied house/condo value
![Distribution of owner-occupied house/condo value]()
- 97$150,000 to $199,999
- 84$200,000 to $249,999
- 108$250,000 to $299,999
- 113$300,000 to $399,999
- 59$400,000 to $499,999
- 101$500,000 to $749,999
- 9$1,000,000 or more

Distribution of rent paid by renters
![Distribution of rent paid by renters]()
- 57$100 to $199
- 59$300 to $399
- 61$400 to $499
- 44$500 to $599
- 216$600 to $699
- 278$700 to $799
- 175$800 to $899
- 172$900 to $999
- 329$1,000 to $1,249
- 106$1,250 to $1,499
- 343$1,500 to $1,999
- 73$2,000 or more

Median rent in 2022:
| Franklin: | $1,012 |
| Provo: | $982 |
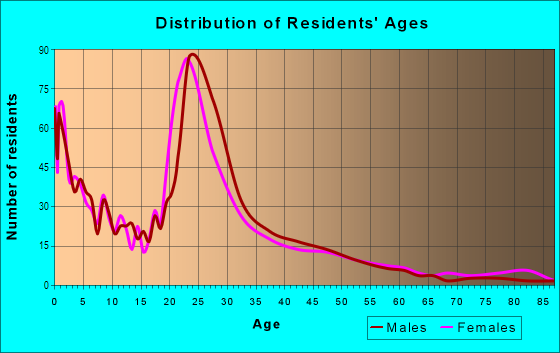
| Males: | 2,372 |
| Females: | 2,694 |
Males:
| This neighborhood: | 25.6 years |
| Whole city: | 23.9 years |
| This neighborhood: | 24.8 years |
| Whole city: | 22.9 years |
Average household size:
| Franklin: | 5.3 people |
| Provo: | 3.0 people |
Percentage of family households:
| Franklin: | 66.6% |
| Provo: | 58.8% |
| Here: | 58.6% |
| Provo: | 54.9% |
Percentage of married-couple families with children (among all households):
| Franklin: | 28.0% |
| Provo: | 25.8% |
Percentage of single-mother households (among all households):
| Franklin: | 2.7% |
| Provo: | 3.4% |
Percentage of never married males 15 years old and over:
Percentage of never married females 15 years old and over:
| Franklin: | 16.3% |
| Provo: | 24.4% |
Percentage of never married females 15 years old and over:
| Franklin: | 20.5% |
| city: | 25.0% |
Percentage of people that speak English not well or not at all:
| Franklin: | 3.7% |
| Provo: | 2.7% |
Percentage of people born in this state:
Percentage of people born in another U.S. state:
Percentage of native residents but born outside the U.S.:
Percentage of foreign born residents:
| Here: | 46.6% |
| Provo: | 47.6% |
Percentage of people born in another U.S. state:
| Franklin: | 35.9% |
| Provo: | 40.4% |
Percentage of native residents but born outside the U.S.:
| Here: | 1.3% |
| city: | 1.4% |
Percentage of foreign born residents:
| Here: | 16.3% |
| Provo: | 10.6% |
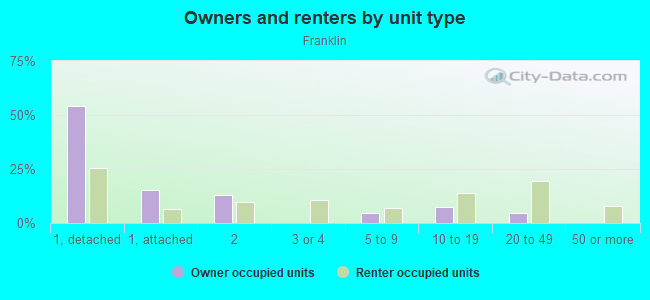
Owner-occupied
Renter-occupied

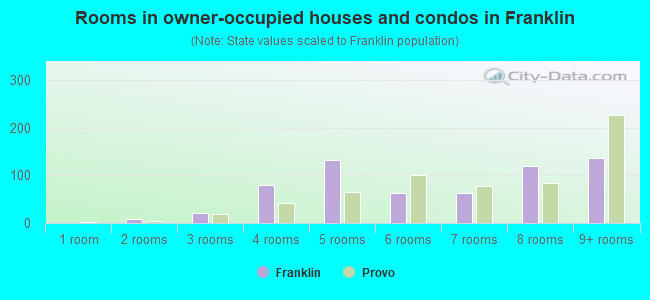
- Rooms in owner-occupied houses and condos in Franklin
- 01 room
- 82 rooms
- 223 rooms
- 794 rooms
- 1335 rooms
- 636 rooms
- 637 rooms
- 1198 rooms
- 1379+ rooms
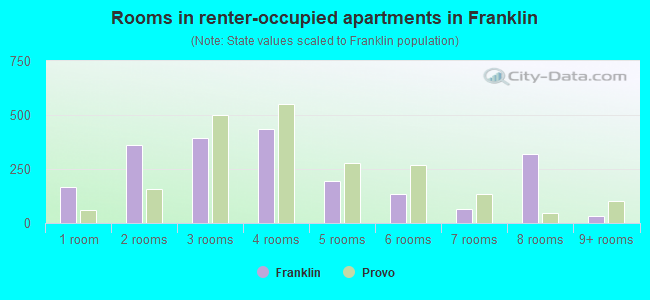
- Rooms in renter-occupied apartments in Franklin
- 1671 room
- 3602 rooms
- 3933 rooms
- 4354 rooms
- 1945 rooms
- 1326 rooms
- 677 rooms
- 3188 rooms
- 339+ rooms
Owner-occupied
Renter-occupied
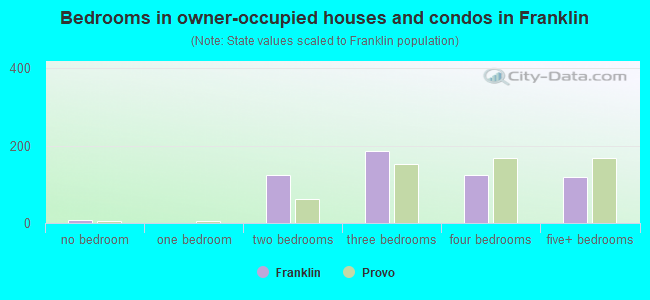
- Bedrooms in owner-occupied houses and condos in Franklin
- 8no bedroom
- 01 bedroom
- 1232 bedrooms
- 1863 bedrooms
- 1254 bedrooms
- 1185+ bedrooms
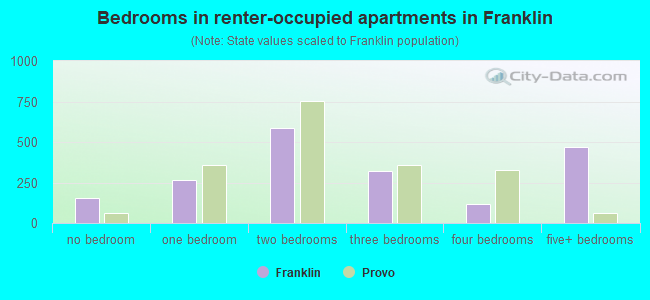
- Bedrooms in renter-occupied apartments in Franklin
- 156no bedroom
- 2681 bedroom
- 5862 bedrooms
- 3233 bedrooms
- 1184 bedrooms
- 4675+ bedrooms
Average number of cars or other vehicles available in houses/condos:
Average number of cars or other vehicles available in apartments:
| This neighborhood: | 2.6 |
| Provo: | 2.5 |
Average number of cars or other vehicles available in apartments:
| Here: | 1.7 |
| city: | 2.0 |
Percentage of units with a mortgage:
| Franklin: | 91.3% |
| Provo: | 64.3% |
Housing prices:
- Average estimated value of detached houses in 2022 (42.8% of all units):
Franklin: $365,504 Utah: $607,750
- Average estimated '22 value of housing units in 5-or-more-unit structures (6.8% of all units):
Franklin: $159,507 Utah: $412,810
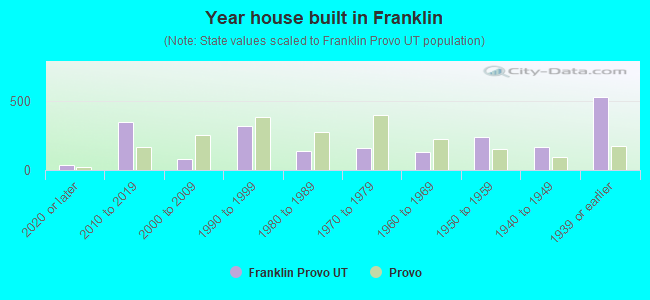
- Year house built in Franklin
- 402020 or later
- 3482010 to 2019
- 802000 to 2009
- 3241990 to 1999
- 1411980 to 1989
- 1611970 to 1979
- 1321960 to 1969
- 2411950 to 1959
- 1701940 to 1949
- 5301939 or earlier
City-data.com crime index for city in 2020 (higher means more crime):
| City: | 6.3 |
| U.S. average: | 219.5 |
Travel time to work (commute)
![Travel time to work (commute)]()
- 114Less than 5 minutes
- 3285 to 9 minutes
- 57310 to 14 minutes
- 51315 to 19 minutes
- 33420 to 24 minutes
- 9025 to 29 minutes
- 16330 to 34 minutes
- 6735 to 39 minutes
- 9840 to 44 minutes
- 22345 to 59 minutes
- 18560 to 89 minutes
- 12590 or more minutes

Means of transportation to work
![Means of transportation to work]()
- 56.7%1,792Drove a car alone
- 18.1%573Carpooled
- 4.4%140Bus
- 3.0%94Subway or elevated rail
- 3.8%121Long-distance train or commuter rail
- 1.0%31Light rail, streetcar or trolley
- 2.2%68Motorcycle
- 1.1%34Bicycle
- 6.7%212Walked
- 0.9%28Other means
- 24.7%779Worked at home

Time leaving home to go to work
![Time leaving home to go to work]()
- 15112:00 a.m. to 4:59 a.m.
- 695:00 a.m. to 5:29 a.m.
- 1325:30 a.m. to 5:59 a.m.
- 1016:00 a.m. to 6:29 a.m.
- 2306:30 a.m. to 6:59 a.m.
- 3377:00 a.m. to 7:29 a.m.
- 3657:30 a.m. to 7:59 a.m.
- 4138:00 a.m. to 8:29 a.m.
- 2188:30 a.m. to 8:59 a.m.
- 2089:00 a.m. to 9:59 a.m.
- 17610:00 a.m. to 10:59 a.m.
- 13411:00 a.m. to 11:59 a.m.
- 27412:00 p.m. to 3:59 p.m.
- 704:00 p.m. to 11:59 p.m.

Occupations of males:
- Percentage of males in management occupations (except farmers):
Here: 10.4% city: 7.9%
- Percentage of males in business and financial operations occupations:
Here: 6.2% city: 5.2%
- Percentage of males in computer and mathematical occupations:
Here: 4.4% city: 8.6%
- Percentage of males in architecture and engineering occupations:
Here: 3.9% city: 2.3%
- Percentage of males in community and social services occupations:
Here: 3.0% city: 1.2%
- Percentage of males in education, training, and library occupations:
Here: 2.9% city: 9.6%
- Percentage of males in arts, design, entertainment, sports, and media occupations:
Here: 7.5% city: 3.5%
- Percentage of males in healthcare practitioners and technical occupations:
Here: 2.2% city: 2.0%
- Percentage of males in service occupations:
Here: 14.5% city: 16.2%
- Percentage of males in sales and office occupations:
Here: 15.4% city: 18.4%
- Percentage of males in construction, extraction, and maintenance occupations:
Here: 7.2% city: 6.6%
- Percentage of males in production occupations:
Here: 12.3% city: 5.2%
- Percentage of males in transportation occupations:
Here: 5.8% city: 3.7%
- Percentage of males in material moving occupations:
Here: 1.7% city: 4.3%
Occupations of females:
- Percentage of females in management occupations (except farmers):
Here: 4.8% city: 6.6%
- Percentage of females in business and financial operations occupations:
Here: 5.7% city: 4.4%
- Percentage of females in computer and mathematical occupations:
Here: 1.2% city: 1.5%
- Percentage of females in architecture and engineering occupations:
Here: 6.2% city: 0.7%
- Percentage of females in community and social services occupations:
Here: 3.0% city: 2.7%
- Percentage of females in education, training, and library occupations:
Here: 11.2% city: 14.2%
- Percentage of females in arts, design, entertainment, sports, and media occupations:
Here: 4.1% city: 5.0%
- Percentage of females in healthcare practitioners and technical occupations:
Here: 1.7% city: 4.9%
- Percentage of females in service occupations:
Here: 15.2% city: 22.0%
- Percentage of females in sales and office occupations:
Here: 32.2% city: 28.1%
- Percentage of females in construction, extraction, and maintenance occupations:
Here: 2.4% city: 0.6%
- Percentage of females in production occupations:
Here: 7.5% city: 3.5%
- Percentage of females in material moving occupations:
Here: 4.8% city: 2.9%
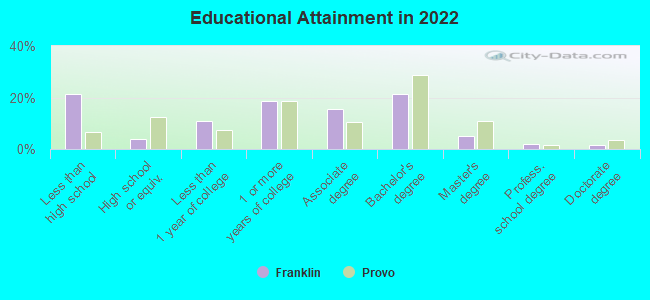
Education in this neighborhood (subdivision or community):
- Percentage of people 3 years and older in K-12 schools:
Franklin: 18.6% Provo: 12.7%
- Percentage of people 3 years and older in undergraduate colleges:
Franklin: 17.7% Provo: 35.3%
- Percentage of people 3 years and older in grad. or professional schools:
Franklin: 1.9% Provo: 2.6%
- Percentage of students K-12 enrolled in private schools:
Franklin: 22.4% Provo: 6.2%
Percentage of population below poverty level:
| Franklin: | 10.4% |
| Provo: | 24.3% |
Percentage of married-couple families with both working:
| Franklin: | 84.4% |
| Provo: | 65.5% |
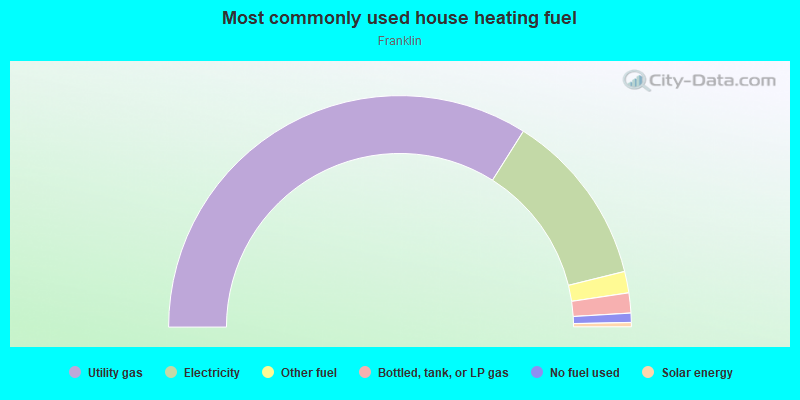
- 67.9%Utility gas
- 24.4%Electricity
- 3.0%Other fuel
- 2.8%Bottled, tank, or LP gas
- 1.3%No fuel used
- 0.6%Solar energy
Roads and streets:
W Center St
Length: 1.13 miles
Direction: E-W
Address range: 500 to 1443
Direction: E-W
Address range: 500 to 1443
W 200 S (W 200 South St)
Length: 1.02 miles
Directions: E-W, SE-NW
Address range: 200 to 1050
Directions: E-W, SE-NW
Address range: 200 to 1050
W 300 South St (W 300 S)
Length: 0.93 miles
Direction: E-W
Address range: 200 to 999
Direction: E-W
Address range: 200 to 999
W 500 S (W 500 South St)
Length: 0.87 miles
Directions: E-W, SE-NW
Address range: 200 to 939
Directions: E-W, SE-NW
Address range: 200 to 939
W 100 South St (W 100 S)
Length: 0.84 miles
Direction: E-W
Address range: 400 to 1199
Direction: E-W
Address range: 400 to 1199
W 400 South St (W 400 S)
Length: 0.78 miles
Direction: E-W
Address range: 200 to 999
Direction: E-W
Address range: 200 to 999
S 500 West St (S 500 W)
Length: 0.55 miles
Direction: N-S
Address range: 1 to 599
Direction: N-S
Address range: 1 to 599
S 700 West St (S 700 W)
Length: 0.54 miles
Direction: N-S
Address range: 1 to 599
Direction: N-S
Address range: 1 to 599
S 600 W (S 600 West St)
Length: 0.54 miles
Directions: N-S, SE-NW
Address range: 1 to 599
Directions: N-S, SE-NW
Address range: 1 to 599
S 900 West St (S 900 W)
Length: 0.54 miles
Direction: N-S
Address range: 1 to 499
Direction: N-S
Address range: 1 to 499
S 800 West St (S 800 W)
Length: 0.46 miles
Direction: N-S
Address range: 1 to 499
Direction: N-S
Address range: 1 to 499
S 400 W (S 400 West St)
Length: 0.43 miles
Direction: N-S
Address range: 100 to 599
Direction: N-S
Address range: 100 to 599
W 600 South St (W 600 S)
Length: 0.37 miles
Directions: E-W, SE-NW
Address range: 200 to 599
Directions: E-W, SE-NW
Address range: 200 to 599
S 200 West St (S 200 W, S Freedom Blvd)
Length: 0.34 miles
Direction: N-S
Address range: 200 to 599
Direction: N-S
Address range: 200 to 599
S 300 W (S 300 West St)
Length: 0.34 miles
Direction: N-S
Address range: 200 to 598
Direction: N-S
Address range: 200 to 598
S 1400 West St (S 1400 W)
Length: 0.23 miles
Directions: E-W, SE-NW
Address range: 12 to 99
Directions: E-W, SE-NW
Address range: 12 to 99
S 1000 W (S 1000 West St)
Length: 0.22 miles
Directions: N-S, SE-NW
Address range: 16 to 299
Directions: N-S, SE-NW
Address range: 16 to 299
S 1050 W
Length: 0.14 miles
Directions: N-S, SW-NE
Address range: 100 to 399
Directions: N-S, SW-NE
Address range: 100 to 399
W 560 S (W 560 South St)
Length: 0.12 miles
Direction: E-W
Address range: 600 to 699
Direction: E-W
Address range: 600 to 699
W 350 S
Length: 0.08 miles
Direction: E-W
Address range: 1050 to 1099
Direction: E-W
Address range: 1050 to 1099
S 1200 West St (S 1200 W)
Length: 0.07 miles
Directions: N-S, SE-NW
Address range: 100 to 299
Directions: N-S, SE-NW
Address range: 100 to 299
800 W (S 800 W)
Length: 0.02 miles
Direction: N-S
Direction: N-S
S 1100 W (S 1100 West St)
Length: 0.02 miles
Direction: N-S
Address range: 290 to 355
Direction: N-S
Address range: 290 to 355
Railroad features:
Union Pacific RR
Length: 2.43 miles
Directions: E-W, SE-NW
Directions: E-W, SE-NW
Other features:
Mill Race Cnl
Length: 0.08 miles
Direction: N-S
Direction: N-S