Frisbie Park neighborhood in Des Moines, Iowa (IA), 50312 detailed profile
Settings
X


Business Search - 14 Million verified businesses
Area: 0.144 square miles
Population: 271
Population density:
| Frisbie Park: | 1,888 people per square mile |
| Des Moines: | 2,783 people per square mile |

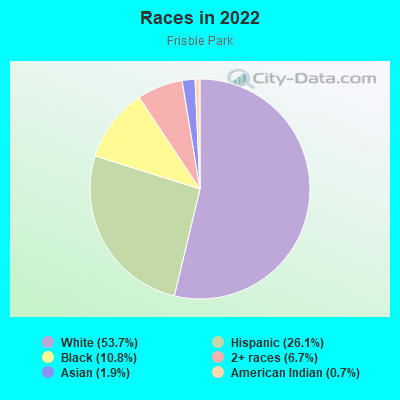
- 14453.7%White
- 7026.1%Hispanic or Latino
- 2910.8%Black
- 186.7%Two or more races
- 51.9%Asian
- 20.7%American Indian
Median household income in 2022:
| Frisbie Park: | $59,432 |
| Des Moines: | $58,018 |
Distribution of median household income
![Distribution of median household income]()
- 3Less than $10,000
- 13$10,000 to $19,999
- 16$20,000 to $29,999
- 7$30,000 to $39,999
- 74$40,000 to $49,999
- 8$50,000 to $59,999
- 11$60,000 to $74,999
- 7$75,000 to $99,999
- 16$100,000 to $124,999
- 6$125,000 to $149,999
- 7$150,000 to $199,999
- 8$200,000 or more

Distribution of owner-occupied house/condo value
![Distribution of owner-occupied house/condo value]()
- 8Less than $50,000
- 26$50,000 to $99,999
- 16$100,000 to $149,999
- 9$150,000 to $199,999
- 3$200,000 to $249,999
- 6$250,000 to $299,999
- 9$300,000 to $399,999
- 2$400,000 to $499,999
- 3$500,000 to $749,999
- 27$750,000 to $999,999
- 5$1,000,000 or more

Distribution of rent paid by renters
![Distribution of rent paid by renters]()
- 2Less than $100
- 1$200 to $299
- 2$300 to $399
- 3$500 to $599
- 7$600 to $699
- 74$700 to $799
- 9$800 to $899
- 7$900 to $999
- 29$1,000 to $1,249
- 3$1,250 to $1,499
- 21$1,500 to $1,999

Median rent in 2022:
| Frisbie Park: | $1,037 |
| Des Moines: | $873 |
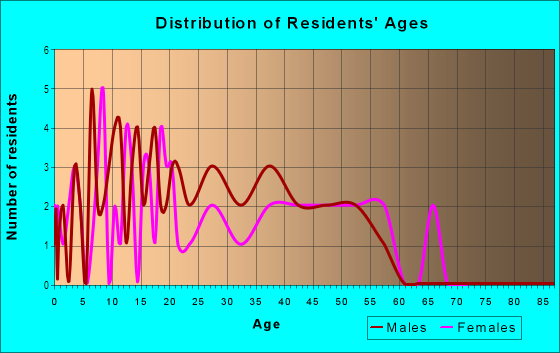
| Males: | 108 |
| Females: | 162 |
Males:
| This neighborhood: | 27.2 years |
| Whole city: | 34.7 years |
| This neighborhood: | 28.6 years |
| Whole city: | 35.5 years |
Average household size:
| Frisbie Park: | 2.6 people |
| Des Moines: | 2.2 people |
Percentage of family households:
| Frisbie Park: | 67.0% |
| Des Moines: | 40.8% |
| Here: | 38.6% |
| Des Moines: | 32.7% |
Percentage of married-couple families with children (among all households):
| Frisbie Park: | 12.5% |
| Des Moines: | 26.2% |
Percentage of single-mother households (among all households):
| Frisbie Park: | 23.5% |
| Des Moines: | 14.0% |
Percentage of never married males 15 years old and over:
Percentage of never married females 15 years old and over:
| Frisbie Park: | 14.9% |
| Des Moines: | 21.4% |
Percentage of never married females 15 years old and over:
| Frisbie Park: | 23.4% |
| city: | 19.3% |
Percentage of people that speak English not well or not at all:
| Frisbie Park: | 4.3% |
| Des Moines: | 5.0% |
Percentage of people born in this state:
Percentage of people born in another U.S. state:
Percentage of native residents but born outside the U.S.:
Percentage of foreign born residents:
| Here: | 61.8% |
| Des Moines: | 64.1% |
Percentage of people born in another U.S. state:
| Frisbie Park: | 26.6% |
| Des Moines: | 19.2% |
Percentage of native residents but born outside the U.S.:
| Here: | 0.3% |
| city: | 0.5% |
Percentage of foreign born residents:
| Here: | 11.4% |
| Des Moines: | 16.2% |
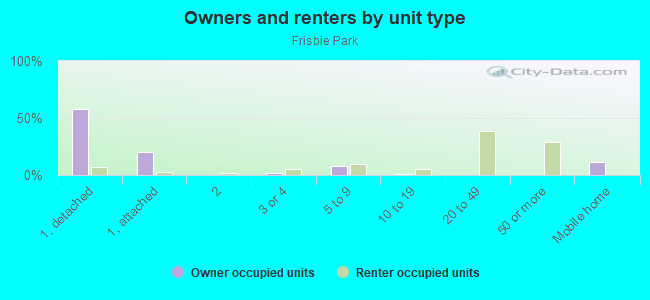
Owner-occupied
Renter-occupied

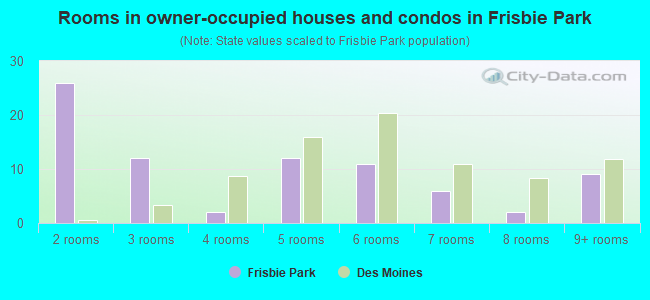
- Rooms in owner-occupied houses and condos in Frisbie Park
- 01 room
- 262 rooms
- 123 rooms
- 24 rooms
- 125 rooms
- 116 rooms
- 67 rooms
- 28 rooms
- 99+ rooms
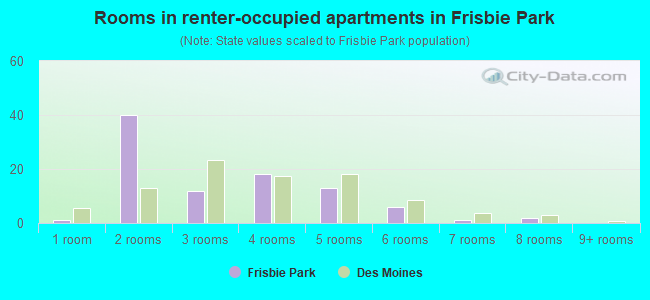
- Rooms in renter-occupied apartments in Frisbie Park
- 11 room
- 402 rooms
- 123 rooms
- 184 rooms
- 135 rooms
- 66 rooms
- 17 rooms
- 28 rooms
- 09+ rooms
Owner-occupied
Renter-occupied
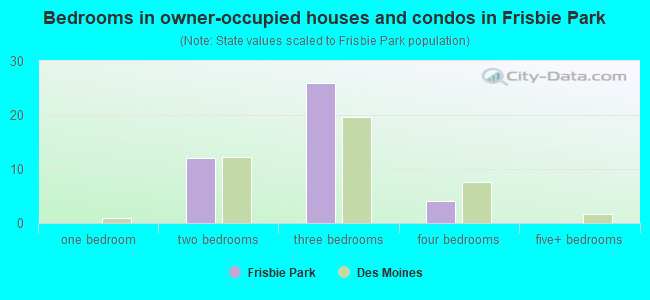
- Bedrooms in owner-occupied houses and condos in Frisbie Park
- 0no bedroom
- 01 bedroom
- 122 bedrooms
- 263 bedrooms
- 44 bedrooms
- 05+ bedrooms
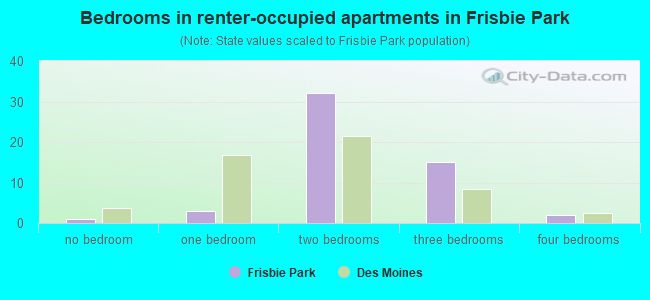
- Bedrooms in renter-occupied apartments in Frisbie Park
- 1no bedroom
- 31 bedroom
- 322 bedrooms
- 153 bedrooms
- 24 bedrooms
- 05+ bedrooms
Average number of cars or other vehicles available in houses/condos:
Average number of cars or other vehicles available in apartments:
| This neighborhood: | 2.2 |
| Des Moines: | 1.9 |
Average number of cars or other vehicles available in apartments:
| Here: | 1.5 |
| city: | 1.2 |
Percentage of units with a mortgage:
| Frisbie Park: | 76.2% |
| Des Moines: | 69.7% |
Housing prices:
- Average estimated value of detached houses in 2022 (39.4% of all units):
Frisbie Park: $312,392 Des Moines: $201,532
- Average estimated value of townhouses or other attached units in 2022 (12.5% of all units):
This neighborhood: $134,267 city: $241,703
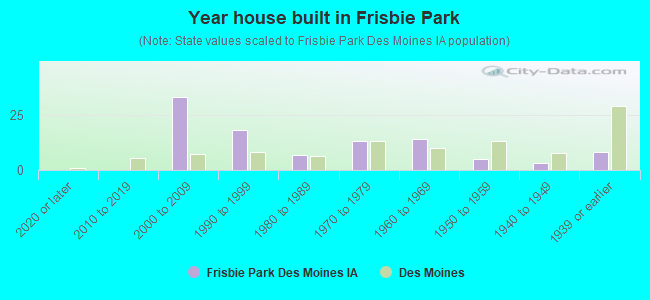
- Year house built in Frisbie Park
- 02020 or later
- 02010 to 2019
- 332000 to 2009
- 181990 to 1999
- 71980 to 1989
- 131970 to 1979
- 141960 to 1969
- 51950 to 1959
- 31940 to 1949
- 81939 or earlier
City-data.com crime index for city in 2020 (higher means more crime):
| City: | 422.4 |
| U.S. average: | 219.5 |
Travel time to work (commute)
![Travel time to work (commute)]()
- 2Less than 5 minutes
- 65 to 9 minutes
- 1410 to 14 minutes
- 3615 to 19 minutes
- 1420 to 24 minutes
- 625 to 29 minutes
- 1630 to 34 minutes
- 440 to 44 minutes
- 245 to 59 minutes
- 1760 to 89 minutes
- 1290 or more minutes

Means of transportation to work
![Means of transportation to work]()
- 64.8%83Drove a car alone
- 21.9%28Carpooled
- 4.7%6Bus
- 1.6%2Other means
- 8.6%11Worked at home

Time leaving home to go to work
![Time leaving home to go to work]()
- 312:00 a.m. to 4:59 a.m.
- 85:00 a.m. to 5:29 a.m.
- 25:30 a.m. to 5:59 a.m.
- 56:00 a.m. to 6:29 a.m.
- 126:30 a.m. to 6:59 a.m.
- 177:00 a.m. to 7:29 a.m.
- 137:30 a.m. to 7:59 a.m.
- 48:00 a.m. to 8:29 a.m.
- 38:30 a.m. to 8:59 a.m.
- 19:00 a.m. to 9:59 a.m.
- 510:00 a.m. to 10:59 a.m.
- 1812:00 p.m. to 3:59 p.m.
- 54:00 p.m. to 11:59 p.m.

Occupations of males:
- Percentage of males in management occupations (except farmers):
Here: 15.2% city: 9.3%
- Percentage of males in business and financial operations occupations:
Here: 5.8% city: 5.5%
- Percentage of males in computer and mathematical occupations:
Here: 2.9% city: 6.0%
- Percentage of males in life, physical, and social science occupations:
Here: 1.2% city: 1.1%
- Percentage of males in education, training, and library occupations:
Here: 2.5% city: 2.1%
- Percentage of males in healthcare practitioners and technical occupations:
Here: 4.6% city: 2.2%
- Percentage of males in service occupations:
Here: 17.2% city: 13.1%
- Percentage of males in sales and office occupations:
Here: 20.9% city: 15.2%
- Percentage of males in construction, extraction, and maintenance occupations:
Here: 2.2% city: 10.0%
- Percentage of males in production occupations:
Here: 9.8% city: 9.9%
- Percentage of males in transportation occupations:
Here: 4.0% city: 6.3%
- Percentage of males in material moving occupations:
Here: 3.7% city: 7.2%
Occupations of females:
- Percentage of females in management occupations (except farmers):
Here: 16.2% city: 8.5%
- Percentage of females in business and financial operations occupations:
Here: 5.3% city: 7.3%
- Percentage of females in education, training, and library occupations:
Here: 6.4% city: 7.0%
- Percentage of females in arts, design, entertainment, sports, and media occupations:
Here: 1.4% city: 2.6%
- Percentage of females in healthcare practitioners and technical occupations:
Here: 4.2% city: 7.6%
- Percentage of females in service occupations:
Here: 40.9% city: 23.4%
- Percentage of females in sales and office occupations:
Here: 18.7% city: 27.7%
- Percentage of females in transportation occupations:
Here: 2.9% city: 0.9%
- Percentage of females in material moving occupations:
Here: 1.9% city: 2.1%
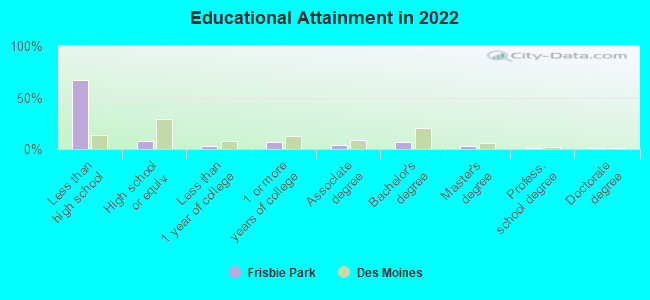
Education in this neighborhood (subdivision or community):
- Percentage of people 3 years and older in K-12 schools:
Frisbie Park: 23.8% Des Moines: 17.5%
- Percentage of people 3 years and older in undergraduate colleges:
Frisbie Park: 5.6% Des Moines: 3.7%
- Percentage of people 3 years and older in grad. or professional schools:
Frisbie Park: 11.3% Des Moines: 1.6%
- Percentage of students K-12 enrolled in private schools:
Frisbie Park: 0.0% Des Moines: 6.9%
Percentage of population below poverty level:
| Frisbie Park: | 23.6% |
| Des Moines: | 14.7% |
Median year owner moved in (as recorded in 2022):
Median year renter moved in (as recorded in 2022):
| Frisbie Park: | 2009 |
| Des Moines: | 2011 |
Median year renter moved in (as recorded in 2022):
| Frisbie Park: | 2017 |
| Des Moines: | 2020 |
Percentage of married-couple families with both working:
| Frisbie Park: | 93.2% |
| Des Moines: | 73.4% |
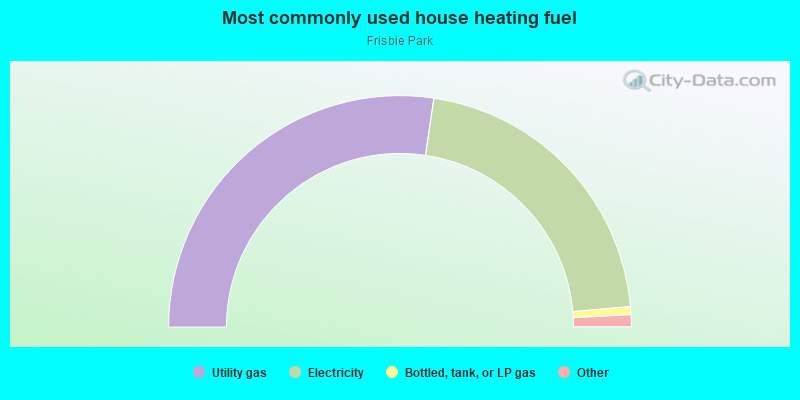
- 54.7%Utility gas
- 42.5%Electricity
- 1.1%Bottled, tank, or LP gas
- 1.0%No fuel used
- 0.8%Other fuel
Roads and streets:
SW 62nd St
Length: 0.29 miles
Direction: N-S
Address range: 600 to 999
Direction: N-S
Address range: 600 to 999
Muskogee Ave
Length: 0.23 miles
Directions: E-W, SW-NE
Address range: 5900 to 6199
Directions: E-W, SW-NE
Address range: 5900 to 6199
Tonka Ave
Length: 0.23 miles
Direction: E-W
Address range: 5900 to 6199
Direction: E-W
Address range: 5900 to 6199
SW 61st St
Length: 0.22 miles
Direction: N-S
Address range: 319 to 699
Direction: N-S
Address range: 319 to 699
SW 59th St
Length: 0.10 miles
Direction: N-S
Address range: 600 to 699
Direction: N-S
Address range: 600 to 699
Railroad Ave
Length: 0.08 miles
Direction: E-W
Address range: 6100 to 6199
Direction: E-W
Address range: 6100 to 6199
SW 60th St
Length: 0.06 miles
Direction: N-S
Address range: 600 to 699
Direction: N-S
Address range: 600 to 699