Ft. Gillem neighborhood in Forest Park, Georgia (GA), 30297 detailed profile
Settings
X


Business Search - 14 Million verified businesses
Area: 2.401 square miles
Population: 9,791
Population density:
| Ft. Gillem: | 4,078 people per square mile |
| Forest Park: | 2,093 people per square mile |

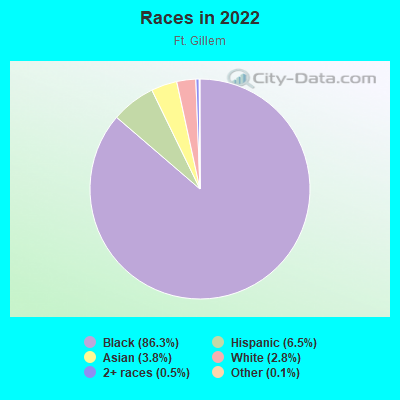
- 8,82586.3%Black
- 6646.5%Hispanic or Latino
- 3883.8%Asian
- 2822.8%White
- 490.5%Two or more races
- 140.1%Some other race
Median household income in 2022:
| Ft. Gillem: | $58,373 |
| Forest Park: | $41,837 |
Distribution of median household income
![Distribution of median household income]()
- 416Less than $10,000
- 113$10,000 to $19,999
- 250$20,000 to $29,999
- 1,954$30,000 to $39,999
- 233$40,000 to $49,999
- 60$50,000 to $59,999
- 454$60,000 to $74,999
- 130$75,000 to $99,999
- 265$100,000 to $124,999
- 98$125,000 to $149,999
- 69$150,000 to $199,999
- 108$200,000 or more

Distribution of owner-occupied house/condo value
![Distribution of owner-occupied house/condo value]()
- 188Less than $50,000
- 301$50,000 to $99,999
- 134$100,000 to $149,999
- 102$150,000 to $199,999
- 189$200,000 to $249,999
- 14$250,000 to $299,999
- 447$300,000 to $399,999
- 3$400,000 to $499,999
- 3$750,000 to $999,999
- 26$1,000,000 or more

Distribution of rent paid by renters
![Distribution of rent paid by renters]()
- 29$200 to $299
- 18$400 to $499
- 1,238$500 to $599
- 349$600 to $699
- 78$700 to $799
- 1,676$800 to $899
- 45$900 to $999
- 86$1,000 to $1,249
- 8$1,250 to $1,499
- 28$1,500 to $1,999

Median rent in 2022:
| Ft. Gillem: | $866 |
| Forest Park: | $855 |
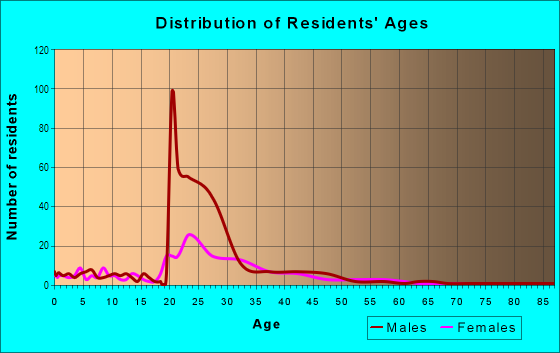
| Males: | 3,899 |
| Females: | 5,892 |
Males:
| This neighborhood: | 34.9 years |
| Whole city: | 30.9 years |
| This neighborhood: | 34.5 years |
| Whole city: | 32.4 years |
Average household size:
| Ft. Gillem: | 2.7 people |
| Forest Park: | 2.7 people |
Percentage of family households:
| Ft. Gillem: | 65.0% |
| Forest Park: | 45.8% |
| Here: | 10.4% |
| Forest Park: | 26.2% |
Percentage of married-couple families with children (among all households):
| Ft. Gillem: | 2.1% |
| Forest Park: | 16.0% |
Percentage of single-mother households (among all households):
| Ft. Gillem: | 39.1% |
| Forest Park: | 16.1% |
Percentage of never married males 15 years old and over:
Percentage of never married females 15 years old and over:
| Ft. Gillem: | 15.1% |
| Forest Park: | 24.7% |
Percentage of never married females 15 years old and over:
| Ft. Gillem: | 49.4% |
| city: | 21.7% |
Percentage of people that speak English not well or not at all:
| Ft. Gillem: | 0.8% |
| Forest Park: | 7.4% |
Percentage of people born in this state:
Percentage of people born in another U.S. state:
Percentage of native residents but born outside the U.S.:
Percentage of foreign born residents:
| Here: | 55.2% |
| Forest Park: | 60.8% |
Percentage of people born in another U.S. state:
| Ft. Gillem: | 30.5% |
| Forest Park: | 23.3% |
Percentage of native residents but born outside the U.S.:
| Here: | 2.8% |
| city: | 0.6% |
Percentage of foreign born residents:
| Here: | 11.5% |
| Forest Park: | 15.2% |
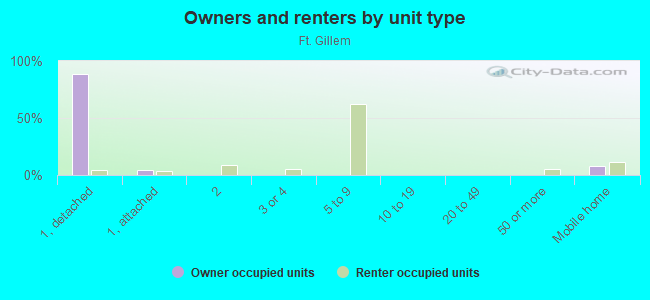
Owner-occupied
Renter-occupied

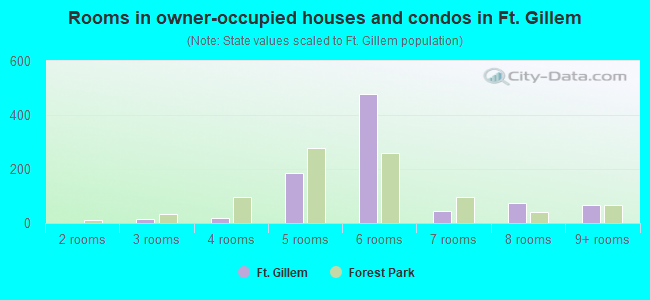
- Rooms in owner-occupied houses and condos in Ft. Gillem
- 01 room
- 02 rooms
- 153 rooms
- 194 rooms
- 1855 rooms
- 4766 rooms
- 437 rooms
- 748 rooms
- 669+ rooms
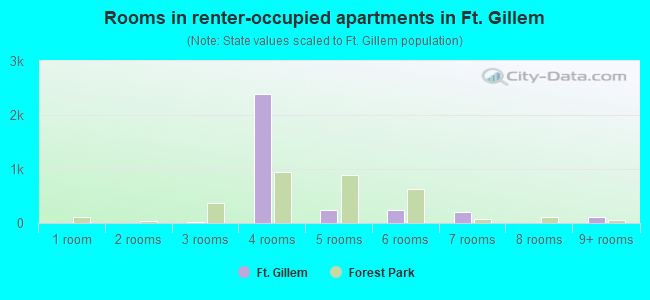
- Rooms in renter-occupied apartments in Ft. Gillem
- 01 room
- 02 rooms
- 223 rooms
- 2,3884 rooms
- 2485 rooms
- 2376 rooms
- 2097 rooms
- 08 rooms
- 1149+ rooms
Owner-occupied
Renter-occupied
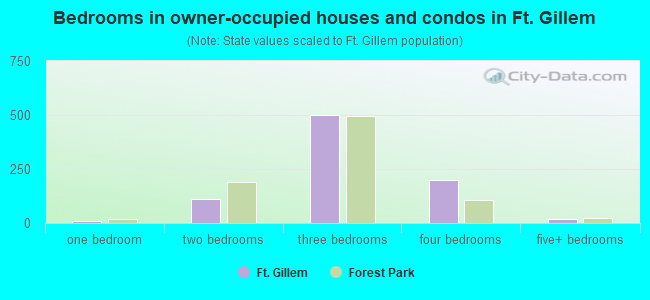
- Bedrooms in owner-occupied houses and condos in Ft. Gillem
- 0no bedroom
- 71 bedroom
- 1102 bedrooms
- 5013 bedrooms
- 2014 bedrooms
- 175+ bedrooms
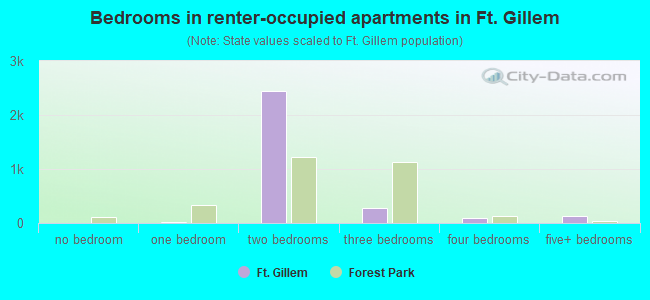
- Bedrooms in renter-occupied apartments in Ft. Gillem
- 0no bedroom
- 101 bedroom
- 2,4492 bedrooms
- 2783 bedrooms
- 894 bedrooms
- 1265+ bedrooms
Average number of cars or other vehicles available in houses/condos:
Average number of cars or other vehicles available in apartments:
| This neighborhood: | 2.3 |
| Forest Park: | 2.0 |
Average number of cars or other vehicles available in apartments:
| Here: | 0.2 |
| city: | 1.2 |
Percentage of units with a mortgage:
| Ft. Gillem: | 44.5% |
| Forest Park: | 51.0% |
Average estimated value of detached houses in 2022 (20.3% of all units):
| Ft. Gillem: | $229,487 |
| Forest Park: | $116,189 |
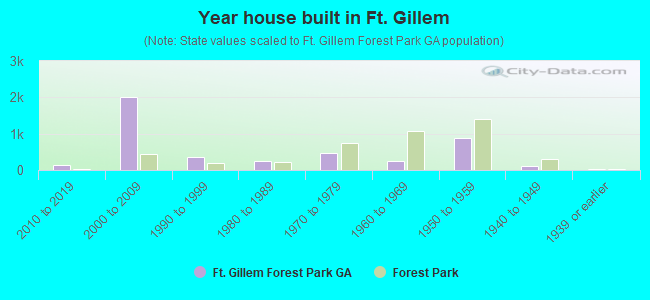
- Year house built in Ft. Gillem
- 52020 or later
- 1482010 to 2019
- 2,0012000 to 2009
- 3471990 to 1999
- 2601980 to 1989
- 4581970 to 1979
- 2371960 to 1969
- 8681950 to 1959
- 1101940 to 1949
- 261939 or earlier
City-data.com crime index for city in 2020 (higher means more crime):
| City: | 537.6 |
| U.S. average: | 219.5 |
Travel time to work (commute)
![Travel time to work (commute)]()
- 5Less than 5 minutes
- 575 to 9 minutes
- 2710 to 14 minutes
- 4815 to 19 minutes
- 11520 to 24 minutes
- 2025 to 29 minutes
- 8130 to 34 minutes
- 3135 to 39 minutes
- 3840 to 44 minutes
- 12045 to 59 minutes
- 3560 to 89 minutes
- 1790 or more minutes

Means of transportation to work
![Means of transportation to work]()
- 92.2%3,009Drove a car alone
- 6.2%202Carpooled
- 1.6%53Bus
- 0.1%2Long-distance train or commuter rail
- 0.2%5Taxi
- 0.2%5Motorcycle
- 0.6%19Walked
- 0.2%7Other means
- 3.3%108Worked at home

Time leaving home to go to work
![Time leaving home to go to work]()
- 212:00 a.m. to 4:59 a.m.
- 85:00 a.m. to 5:29 a.m.
- 585:30 a.m. to 5:59 a.m.
- 656:00 a.m. to 6:29 a.m.
- 446:30 a.m. to 6:59 a.m.
- 517:00 a.m. to 7:29 a.m.
- 397:30 a.m. to 7:59 a.m.
- 638:00 a.m. to 8:29 a.m.
- 148:30 a.m. to 8:59 a.m.
- 159:00 a.m. to 9:59 a.m.
- 1910:00 a.m. to 10:59 a.m.
- 111:00 a.m. to 11:59 a.m.
- 5512:00 p.m. to 3:59 p.m.
- 484:00 p.m. to 11:59 p.m.

Occupations of males:
- Percentage of males in management occupations (except farmers):
Here: 5.0% city: 9.5%
- Percentage of males in business and financial operations occupations:
Here: 5.6% city: 1.7%
- Percentage of males in computer and mathematical occupations:
Here: 3.4% city: 2.2%
- Percentage of males in service occupations:
Here: 52.6% city: 17.7%
- Percentage of males in sales and office occupations:
Here: 8.7% city: 10.0%
- Percentage of males in construction, extraction, and maintenance occupations:
Here: 3.8% city: 24.8%
- Percentage of males in production occupations:
Here: 2.9% city: 5.7%
- Percentage of males in transportation occupations:
Here: 13.5% city: 6.2%
- Percentage of males in material moving occupations:
Here: 2.8% city: 14.6%
Occupations of females:
- Percentage of females in service occupations:
Here: 68.3% city: 43.9%
- Percentage of females in sales and office occupations:
Here: 10.9% city: 25.4%
- Percentage of females in production occupations:
Here: 18.1% city: 5.6%
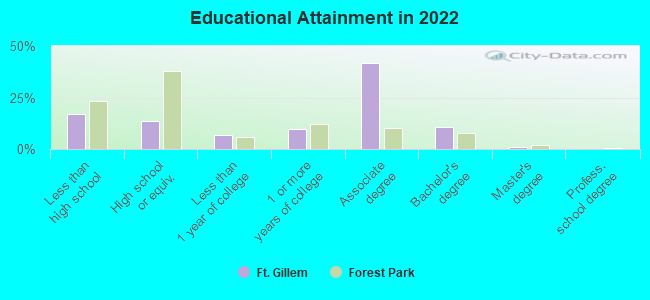
Education in this neighborhood (subdivision or community):
- Percentage of people 3 years and older in K-12 schools:
Ft. Gillem: 57.2% Forest Park: 24.7%
- Percentage of people 3 years and older in undergraduate colleges:
Ft. Gillem: 6.1% Forest Park: 4.1%
- Percentage of people 3 years and older in grad. or professional schools:
Ft. Gillem: 0.2% Forest Park: 0.6%
- Percentage of students K-12 enrolled in private schools:
Ft. Gillem: 3.8% Forest Park: 9.5%
Percentage of population below poverty level:
| Ft. Gillem: | 10.0% |
| Forest Park: | 18.0% |
Median year renter moved in (as recorded in 2022):
| Ft. Gillem: | 2016 |
| Forest Park: | 2018 |
Percentage of married-couple families with both working:
| Ft. Gillem: | 78.0% |
| Forest Park: | 56.5% |
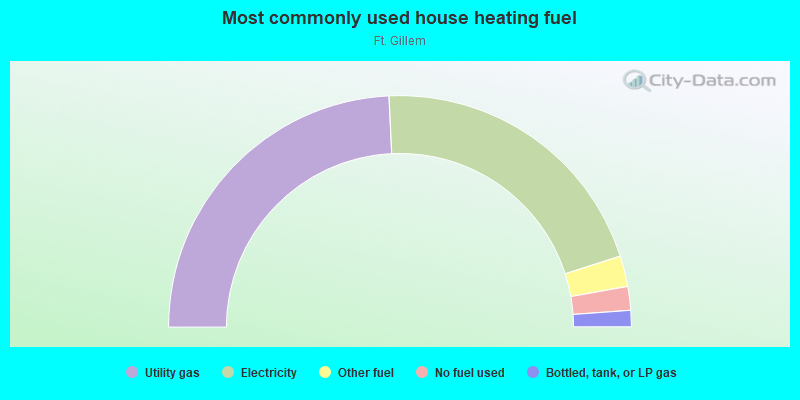
- 48.5%Utility gas
- 41.6%Electricity
- 4.3%Other fuel
- 3.3%No fuel used
- 2.3%Bottled, tank, or LP gas
Highways in this neighborhood:
State Rte 42 (Macon Hwy, US Hwy 23)
Length: 0.76 miles
Directions: N-S, SE-NW
Address range: 4728 to 5083
Directions: N-S, SE-NW
Address range: 4728 to 5083
Roads and streets:
Fort Gillem
Length: 1.85 miles
Directions: E-W, N-S
Directions: E-W, N-S
Slate Rd
Length: 0.45 miles
Direction: E-W
Address range: 2029 to 2123
Direction: E-W
Address range: 2029 to 2123
Hood Ave
Length: 0.32 miles
Directions: E-W, SW-NE
Directions: E-W, SW-NE
Holland Park Dr
Length: 0.31 miles
Directions: E-W, SE-NW
Address range: 1 to 99
Directions: E-W, SE-NW
Address range: 1 to 99
Staff Cir
Length: 0.31 miles
Directions: E-W, N-S, SE-NW, SW-NE
Address range: 4499 to 4599
Directions: E-W, N-S, SE-NW, SW-NE
Address range: 4499 to 4599
Lambeth Cir
Length: 0.23 miles
Directions: E-W, N-S, SE-NW, SW-NE
Address range: 1 to 99
Directions: E-W, N-S, SE-NW, SW-NE
Address range: 1 to 99
Cub Dr
Length: 0.14 miles
Directions: E-W, N-S, SE-NW, SW-NE
Directions: E-W, N-S, SE-NW, SW-NE
Addison Dr
Length: 0.04 miles
Direction: SW-NE
Address range: 1 to 99
Direction: SW-NE
Address range: 1 to 99
Railroad features:
Norfolk Southern Corporation
Length: 10.89 miles
Directions: E-W, N-S, SE-NW, SW-NE
Directions: E-W, N-S, SE-NW, SW-NE
Other features:
Big Cotton Indian Crk
Length: 0.27 miles
Directions: E-W, SE-NW
Directions: E-W, SE-NW
Upton Crk
Length: 0.04 miles
Direction: E-W
Direction: E-W