Ginter Park neighborhood in Richmond, Virginia (VA), 23222, 23227 detailed profile
Settings
X


Business Search - 14 Million verified businesses
Area: 0.430 square miles
Population: 1,933
Population density:
| Ginter Park: | 4,493 people per square mile |
| Richmond: | 3,819 people per square mile |

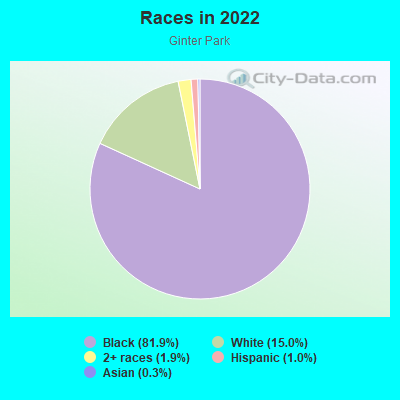
- 1,58581.9%Black
- 29015.0%White
- 371.9%Two or more races
- 191.0%Hispanic or Latino
- 50.3%Asian
Median household income in 2022:
| Ginter Park: | $42,970 |
| Richmond: | $58,988 |
Distribution of median household income
![Distribution of median household income]()
- 73Less than $10,000
- 106$10,000 to $19,999
- 182$20,000 to $29,999
- 157$30,000 to $39,999
- 44$40,000 to $49,999
- 59$50,000 to $59,999
- 69$60,000 to $74,999
- 147$75,000 to $99,999
- 77$100,000 to $124,999
- 33$125,000 to $149,999
- 52$150,000 to $199,999
- 31$200,000 or more

Distribution of owner-occupied house/condo value
![Distribution of owner-occupied house/condo value]()
- 20Less than $50,000
- 90$50,000 to $99,999
- 51$100,000 to $149,999
- 197$150,000 to $199,999
- 67$200,000 to $249,999
- 87$250,000 to $299,999
- 58$300,000 to $399,999
- 17$400,000 to $499,999
- 47$500,000 to $749,999
- 52$750,000 to $999,999
- 2$1,000,000 or more

Distribution of rent paid by renters
![Distribution of rent paid by renters]()
- 19$100 to $199
- 97$200 to $299
- 22$300 to $399
- 22$400 to $499
- 31$500 to $599
- 58$600 to $699
- 142$700 to $799
- 128$800 to $899
- 44$900 to $999
- 83$1,000 to $1,249
- 14$1,500 to $1,999

Median rent in 2022:
| Ginter Park: | $803 |
| Richmond: | $1,050 |
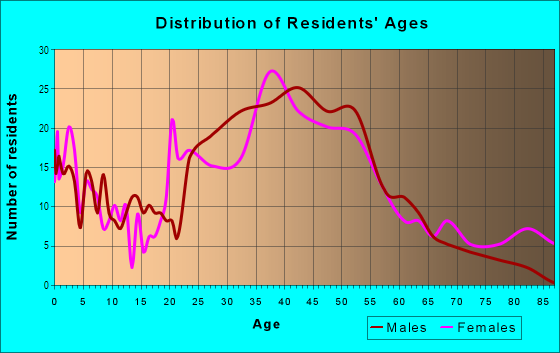
| Males: | 858 |
| Females: | 1,074 |
Males:
| This neighborhood: | 36.0 years |
| Whole city: | 34.4 years |
| This neighborhood: | 42.9 years |
| Whole city: | 35.1 years |
Average household size:
| Ginter Park: | 2.2 people |
| Richmond: | 26.0 people |
Percentage of family households:
| Ginter Park: | 29.1% |
| Richmond: | 31.3% |
| Here: | 18.6% |
| Richmond: | 25.2% |
Percentage of married-couple families with children (among all households):
| Ginter Park: | 12.3% |
| Richmond: | 23.1% |
Percentage of single-mother households (among all households):
| Ginter Park: | 41.3% |
| Richmond: | 19.2% |
Percentage of never married males 15 years old and over:
Percentage of never married females 15 years old and over:
| Ginter Park: | 19.0% |
| Richmond: | 25.8% |
Percentage of never married females 15 years old and over:
| Ginter Park: | 22.0% |
| city: | 27.8% |
Percentage of people that speak English not well or not at all:
| Ginter Park: | 0.0% |
| Richmond: | 3.2% |
Percentage of people born in this state:
Percentage of people born in another U.S. state:
Percentage of native residents but born outside the U.S.:
Percentage of foreign born residents:
| Here: | 78.3% |
| Richmond: | 59.8% |
Percentage of people born in another U.S. state:
| Ginter Park: | 20.9% |
| Richmond: | 31.3% |
Percentage of native residents but born outside the U.S.:
| Here: | 0.2% |
| city: | 1.7% |
Percentage of foreign born residents:
| Here: | 0.7% |
| Richmond: | 7.1% |
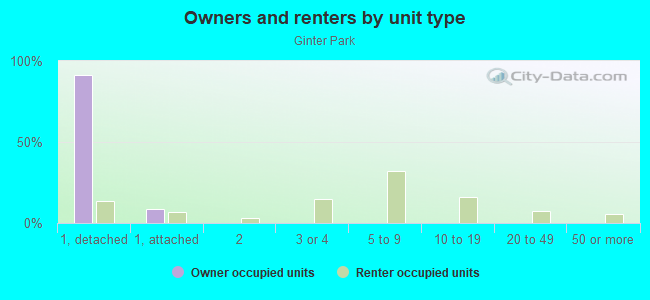
Owner-occupied
Renter-occupied

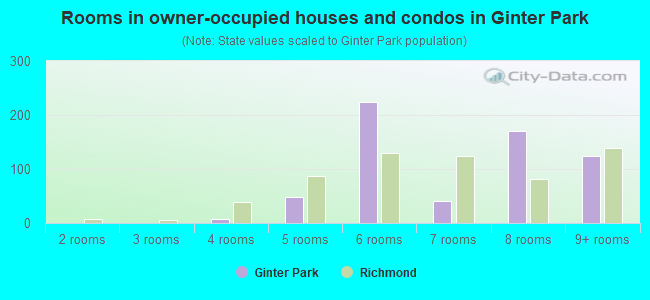
- Rooms in owner-occupied houses and condos in Ginter Park
- 01 room
- 02 rooms
- 03 rooms
- 74 rooms
- 485 rooms
- 2246 rooms
- 417 rooms
- 1708 rooms
- 1249+ rooms
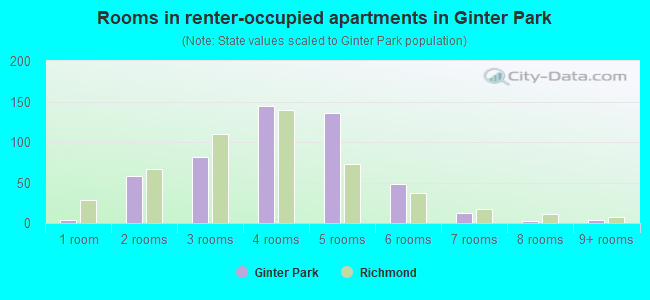
- Rooms in renter-occupied apartments in Ginter Park
- 41 room
- 582 rooms
- 823 rooms
- 1454 rooms
- 1365 rooms
- 486 rooms
- 127 rooms
- 28 rooms
- 49+ rooms
Owner-occupied
Renter-occupied
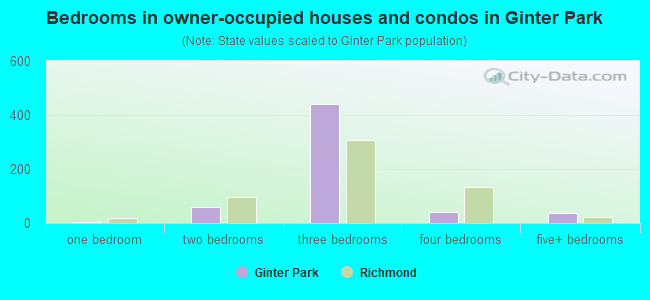
- Bedrooms in owner-occupied houses and condos in Ginter Park
- 0no bedroom
- 31 bedroom
- 602 bedrooms
- 4423 bedrooms
- 424 bedrooms
- 365+ bedrooms
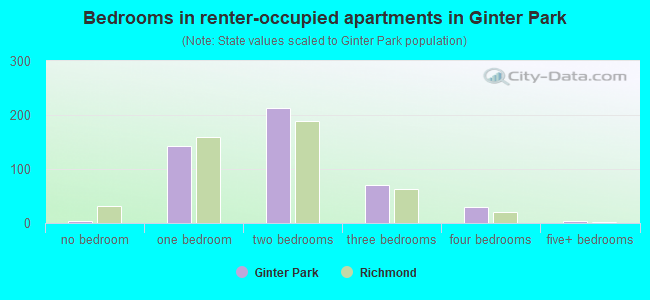
- Bedrooms in renter-occupied apartments in Ginter Park
- 4no bedroom
- 1431 bedroom
- 2132 bedrooms
- 703 bedrooms
- 294 bedrooms
- 45+ bedrooms
Average number of cars or other vehicles available in houses/condos:
Average number of cars or other vehicles available in apartments:
| This neighborhood: | 1.4 |
| Richmond: | 1.9 |
Average number of cars or other vehicles available in apartments:
| Here: | 0.6 |
| city: | 1.2 |
Percentage of units with a mortgage:
| Ginter Park: | 67.8% |
| Richmond: | 70.8% |
Average estimated value of detached houses in 2022 (63.8% of all units):
| Ginter Park: | $250,991 |
| Richmond: | $385,339 |
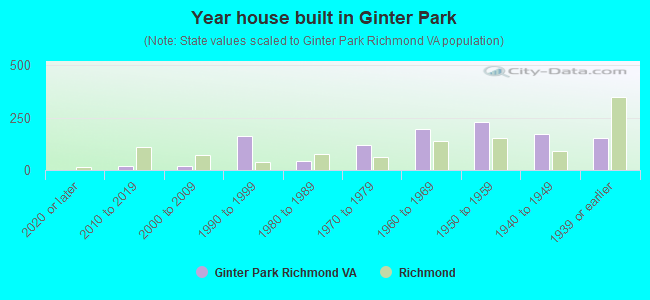
- Year house built in Ginter Park
- 02020 or later
- 212010 to 2019
- 182000 to 2009
- 1621990 to 1999
- 431980 to 1989
- 1181970 to 1979
- 1951960 to 1969
- 2281950 to 1959
- 1731940 to 1949
- 1511939 or earlier
City-data.com crime index for city in 2020 (higher means more crime):
| City: | 274.8 |
| U.S. average: | 219.5 |
Travel time to work (commute)
![Travel time to work (commute)]()
- 33Less than 5 minutes
- 565 to 9 minutes
- 12910 to 14 minutes
- 19615 to 19 minutes
- 18420 to 24 minutes
- 2325 to 29 minutes
- 5630 to 34 minutes
- 2435 to 39 minutes
- 640 to 44 minutes
- 7045 to 59 minutes
- 4960 to 89 minutes
- 4590 or more minutes

Means of transportation to work
![Means of transportation to work]()
- 55.8%548Drove a car alone
- 10.0%98Carpooled
- 19.1%187Bus
- 3.1%30Taxi
- 1.3%13Bicycle
- 1.7%17Walked
- 1.8%18Other means
- 13.1%129Worked at home

Time leaving home to go to work
![Time leaving home to go to work]()
- 6512:00 a.m. to 4:59 a.m.
- 315:00 a.m. to 5:29 a.m.
- 385:30 a.m. to 5:59 a.m.
- 336:00 a.m. to 6:29 a.m.
- 616:30 a.m. to 6:59 a.m.
- 997:00 a.m. to 7:29 a.m.
- 927:30 a.m. to 7:59 a.m.
- 1708:00 a.m. to 8:29 a.m.
- 878:30 a.m. to 8:59 a.m.
- 799:00 a.m. to 9:59 a.m.
- 2310:00 a.m. to 10:59 a.m.
- 3811:00 a.m. to 11:59 a.m.
- 1712:00 p.m. to 3:59 p.m.
- 214:00 p.m. to 11:59 p.m.

Occupations of males:
- Percentage of males in management occupations (except farmers):
Here: 7.5% city: 10.7%
- Percentage of males in business and financial operations occupations:
Here: 8.7% city: 7.2%
- Percentage of males in computer and mathematical occupations:
Here: 2.6% city: 5.6%
- Percentage of males in community and social services occupations:
Here: 9.3% city: 1.4%
- Percentage of males in education, training, and library occupations:
Here: 1.4% city: 4.6%
- Percentage of males in service occupations:
Here: 23.6% city: 15.4%
- Percentage of males in sales and office occupations:
Here: 11.2% city: 15.3%
- Percentage of males in construction, extraction, and maintenance occupations:
Here: 4.5% city: 7.8%
- Percentage of males in production occupations:
Here: 2.1% city: 3.8%
- Percentage of males in transportation occupations:
Here: 16.2% city: 4.8%
- Percentage of males in material moving occupations:
Here: 10.3% city: 7.1%
Occupations of females:
- Percentage of females in management occupations (except farmers):
Here: 11.0% city: 9.9%
- Percentage of females in business and financial operations occupations:
Here: 3.2% city: 8.0%
- Percentage of females in life, physical, and social science occupations:
Here: 2.3% city: 1.4%
- Percentage of females in legal occupations:
Here: 2.9% city: 1.7%
- Percentage of females in education, training, and library occupations:
Here: 17.0% city: 9.5%
- Percentage of females in healthcare practitioners and technical occupations:
Here: 3.7% city: 8.5%
- Percentage of females in service occupations:
Here: 20.7% city: 21.3%
- Percentage of females in sales and office occupations:
Here: 25.5% city: 23.3%
- Percentage of females in construction, extraction, and maintenance occupations:
Here: 1.0% city: 0.6%
- Percentage of females in production occupations:
Here: 2.6% city: 2.4%
- Percentage of females in transportation occupations:
Here: 8.5% city: 0.7%
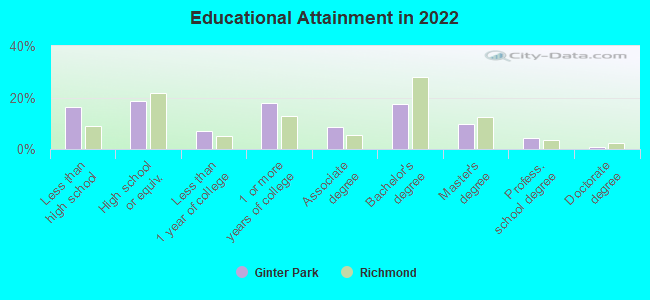
Education in this neighborhood (subdivision or community):
- Percentage of people 3 years and older in K-12 schools:
Ginter Park: 18.1% Richmond: 11.5%
- Percentage of people 3 years and older in undergraduate colleges:
Ginter Park: 7.1% Richmond: 10.1%
- Percentage of people 3 years and older in grad. or professional schools:
Ginter Park: 2.0% Richmond: 1.5%
- Percentage of students K-12 enrolled in private schools:
Ginter Park: 10.2% Richmond: 11.4%
Percentage of population below poverty level:
| Ginter Park: | 21.4% |
| Richmond: | 21.7% |
Median year owner moved in (as recorded in 2022):
Median year renter moved in (as recorded in 2022):
| Ginter Park: | 2008 |
| Richmond: | 2011 |
Median year renter moved in (as recorded in 2022):
| Ginter Park: | 2018 |
| Richmond: | 2020 |
Percentage of married-couple families with both working:
| Ginter Park: | 109.6% |
| Richmond: | 80.3% |
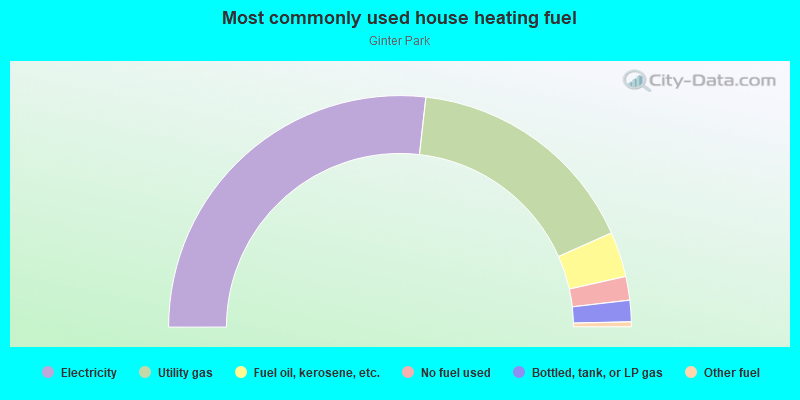
- 53.6%Electricity
- 33.1%Utility gas
- 6.3%Fuel oil, kerosene, etc.
- 3.3%No fuel used
- 3.0%Bottled, tank, or LP gas
- 0.7%Other fuel
Roads and streets:
Chamberlayne Ave
Length: 2.24 miles
Direction: N-S
Address range: 3000 to 3899
Direction: N-S
Address range: 3000 to 3899
W Laburnum Ave
Length: 0.99 miles
Direction: E-W
Address range: 700 to 1099
Direction: E-W
Address range: 700 to 1099
Hawthorne Ave
Length: 0.88 miles
Direction: N-S
Address range: 3200 to 3899
Direction: N-S
Address range: 3200 to 3899
Seminary Ave
Length: 0.75 miles
Direction: N-S
Address range: 3006 to 3803
Direction: N-S
Address range: 3006 to 3803
Noble Ave
Length: 0.63 miles
Directions: N-S, SE-NW
Address range: 3400 to 3899
Directions: N-S, SE-NW
Address range: 3400 to 3899
Walton Ave
Length: 0.41 miles
Direction: E-W
Address range: 800 to 1099
Direction: E-W
Address range: 800 to 1099
Westwood Ave
Length: 0.41 miles
Direction: E-W
Address range: 800 to 1099
Direction: E-W
Address range: 800 to 1099
Rennie Ave
Length: 0.39 miles
Direction: E-W
Address range: 900 to 1191
Direction: E-W
Address range: 900 to 1191
Ordway Ave
Length: 0.28 miles
Direction: E-W
Address range: 801 to 999
Direction: E-W
Address range: 801 to 999
Moss Side Ave
Length: 0.25 miles
Direction: N-S
Address range: 3612 to 3899
Direction: N-S
Address range: 3612 to 3899
North Ave
Length: 0.23 miles
Directions: E-W, SE-NW
Address range: 4200 to 4498
Directions: E-W, SE-NW
Address range: 4200 to 4498
W Brookland Park Blvd
Length: 0.21 miles
Direction: E-W
Direction: E-W
Melrose Ave
Length: 0.14 miles
Direction: E-W
Address range: 1000 to 1099
Direction: E-W
Address range: 1000 to 1099
Brook Rd
Length: 0.05 miles
Direction: N-S
Direction: N-S
Claremont Ave
Length: 0.01 miles
Direction: E-W
Address range: 1000 to 1007
Direction: E-W
Address range: 1000 to 1007