Glendale neighborhood in Bellevue, Washington (WA), 98005 detailed profile
Settings
X


Business Search - 14 Million verified businesses
Area: 0.126 square miles
Population: 887
Population density:
| Glendale: | 7,042 people per square mile |
| Bellevue: | 4,968 people per square mile |

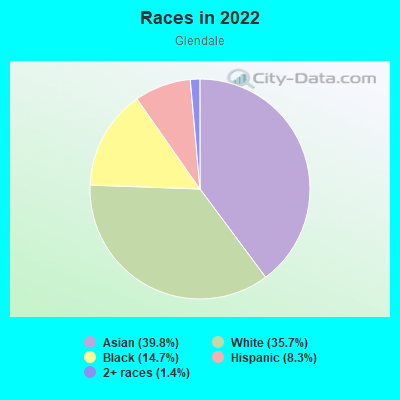
- 41339.8%Asian
- 37135.7%White
- 15314.7%Black
- 868.3%Hispanic or Latino
- 151.4%Two or more races
Median household income in 2022:
| Glendale: | $148,924 |
| Bellevue: | $153,779 |
Distribution of median household income
![Distribution of median household income]()
- 30Less than $10,000
- 73$10,000 to $19,999
- 38$20,000 to $29,999
- 22$30,000 to $39,999
- 13$40,000 to $49,999
- 16$50,000 to $59,999
- 17$60,000 to $74,999
- 35$75,000 to $99,999
- 49$100,000 to $124,999
- 20$125,000 to $149,999
- 16$150,000 to $199,999
- 230$200,000 or more

Distribution of owner-occupied house/condo value
![Distribution of owner-occupied house/condo value]()
- 21Less than $50,000
- 4$250,000 to $299,999
- 20$400,000 to $499,999
- 14$500,000 to $749,999
- 43$750,000 to $999,999
- 273$1,000,000 or more

Distribution of rent paid by renters
![Distribution of rent paid by renters]()
- 21$300 to $399
- 13$900 to $999
- 17$1,000 to $1,249
- 20$1,250 to $1,499
- 26$1,500 to $1,999
- 189$2,000 or more

Median rent in 2022:
| Glendale: | $1,453 |
| Bellevue: | $2,001 |
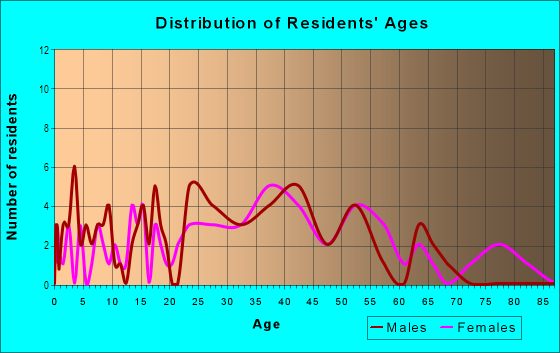
| Males: | 454 |
| Females: | 433 |
Males:
| This neighborhood: | 37.7 years |
| Whole city: | 37.5 years |
| This neighborhood: | 35.0 years |
| Whole city: | 40.9 years |
Average household size:
| Glendale: | 10.4 people |
| Bellevue: | 2.4 people |
Percentage of family households:
| Glendale: | 47.4% |
| Bellevue: | 51.7% |
| Here: | 56.1% |
| Bellevue: | 56.6% |
Percentage of married-couple families with children (among all households):
| Glendale: | 28.2% |
| Bellevue: | 35.0% |
Percentage of single-mother households (among all households):
| Glendale: | 19.3% |
| Bellevue: | 5.0% |
Percentage of never married males 15 years old and over:
Percentage of never married females 15 years old and over:
| Glendale: | 21.3% |
| Bellevue: | 18.3% |
Percentage of never married females 15 years old and over:
| Glendale: | 12.8% |
| city: | 11.9% |
Percentage of people that speak English not well or not at all:
| Glendale: | 2.7% |
| Bellevue: | 5.7% |
Percentage of people born in this state:
Percentage of people born in another U.S. state:
Percentage of native residents but born outside the U.S.:
Percentage of foreign born residents:
| Here: | 26.1% |
| Bellevue: | 27.4% |
Percentage of people born in another U.S. state:
| Glendale: | 17.1% |
| Bellevue: | 27.2% |
Percentage of native residents but born outside the U.S.:
| Here: | 1.3% |
| city: | 2.3% |
Percentage of foreign born residents:
| Here: | 55.5% |
| Bellevue: | 43.1% |
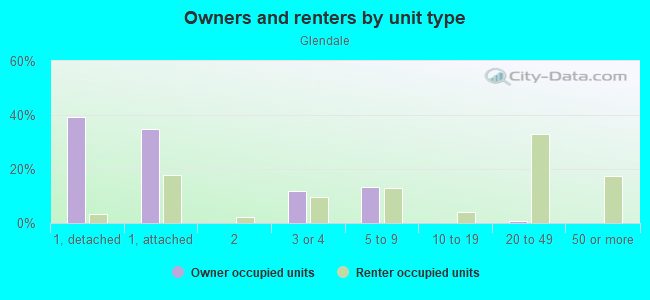
Owner-occupied
Renter-occupied

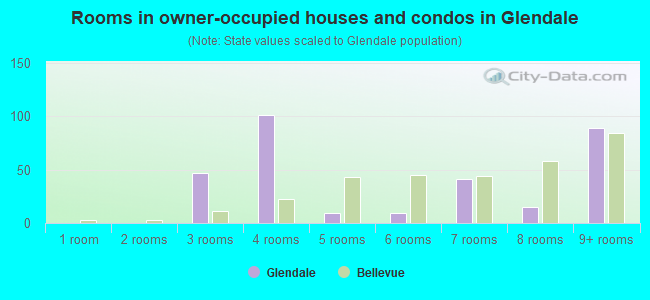
- Rooms in owner-occupied houses and condos in Glendale
- 01 room
- 02 rooms
- 473 rooms
- 1014 rooms
- 95 rooms
- 96 rooms
- 417 rooms
- 158 rooms
- 899+ rooms
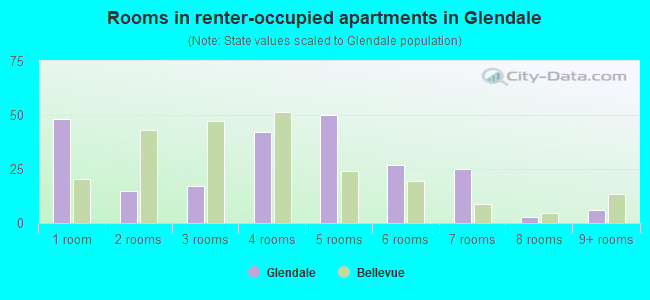
- Rooms in renter-occupied apartments in Glendale
- 481 room
- 152 rooms
- 173 rooms
- 424 rooms
- 505 rooms
- 276 rooms
- 257 rooms
- 38 rooms
- 69+ rooms
Owner-occupied
Renter-occupied
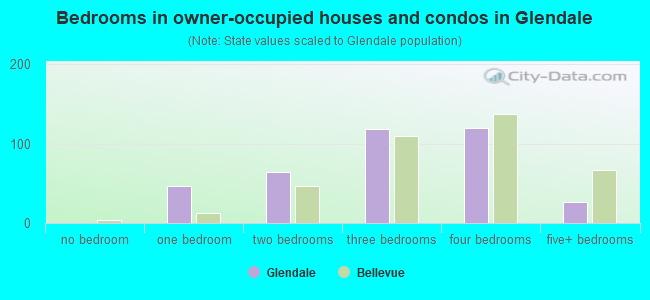
- Bedrooms in owner-occupied houses and condos in Glendale
- 0no bedroom
- 471 bedroom
- 642 bedrooms
- 1193 bedrooms
- 1204 bedrooms
- 265+ bedrooms
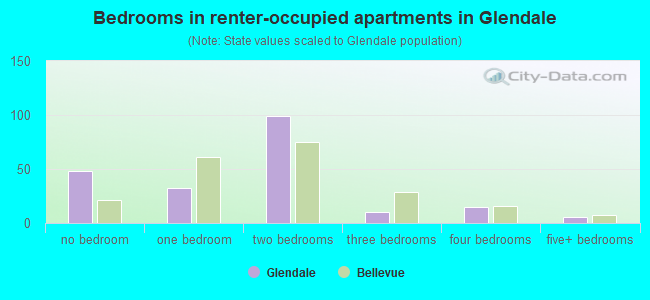
- Bedrooms in renter-occupied apartments in Glendale
- 48no bedroom
- 321 bedroom
- 992 bedrooms
- 103 bedrooms
- 154 bedrooms
- 65+ bedrooms
Average number of cars or other vehicles available in houses/condos:
Average number of cars or other vehicles available in apartments:
| This neighborhood: | |
| Bellevue: |
Average number of cars or other vehicles available in apartments:
| Here: | 1.2 |
| city: | 1.3 |
Percentage of units with a mortgage:
| Glendale: | 46.0% |
| Bellevue: | 62.8% |
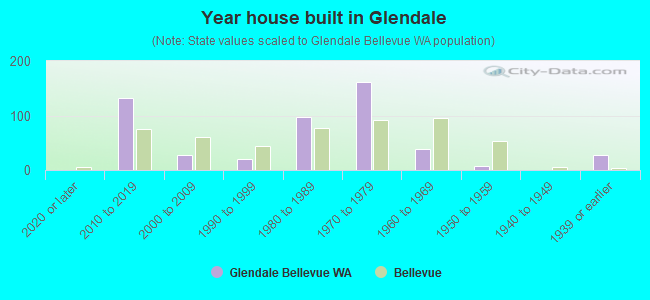
- Year house built in Glendale
- 02020 or later
- 1332010 to 2019
- 272000 to 2009
- 211990 to 1999
- 971980 to 1989
- 1621970 to 1979
- 381960 to 1969
- 81950 to 1959
- 01940 to 1949
- 271939 or earlier
City-data.com crime index for city in 2020 (higher means more crime):
| City: | 179.9 |
| U.S. average: | 219.5 |
Travel time to work (commute)
![Travel time to work (commute)]()
- 535 to 9 minutes
- 7410 to 14 minutes
- 8615 to 19 minutes
- 6420 to 24 minutes
- 3625 to 29 minutes
- 8630 to 34 minutes
- 835 to 39 minutes
- 3640 to 44 minutes
- 945 to 59 minutes
- 1960 to 89 minutes

Means of transportation to work
![Means of transportation to work]()
- 43.0%233Drove a car alone
- 29.7%161Carpooled
- 13.7%74Bus
- 1.5%8Bicycle
- 6.3%34Walked
- 20.3%110Worked at home

Time leaving home to go to work
![Time leaving home to go to work]()
- 1812:00 a.m. to 4:59 a.m.
- 45:00 a.m. to 5:29 a.m.
- 115:30 a.m. to 5:59 a.m.
- 226:00 a.m. to 6:29 a.m.
- 196:30 a.m. to 6:59 a.m.
- 657:00 a.m. to 7:29 a.m.
- 627:30 a.m. to 7:59 a.m.
- 788:00 a.m. to 8:29 a.m.
- 648:30 a.m. to 8:59 a.m.
- 939:00 a.m. to 9:59 a.m.
- 2110:00 a.m. to 10:59 a.m.
- 211:00 a.m. to 11:59 a.m.
- 1312:00 p.m. to 3:59 p.m.
- 54:00 p.m. to 11:59 p.m.

Occupations of males:
- Percentage of males in management occupations (except farmers):
Here: 2.9% city: 18.0%
- Percentage of males in business and financial operations occupations:
Here: 2.8% city: 6.4%
- Percentage of males in computer and mathematical occupations:
Here: 9.7% city: 32.5%
- Percentage of males in architecture and engineering occupations:
Here: 5.6% city: 4.9%
- Percentage of males in legal occupations:
Here: 2.4% city: 1.2%
- Percentage of males in arts, design, entertainment, sports, and media occupations:
Here: 1.2% city: 1.8%
- Percentage of males in healthcare practitioners and technical occupations:
Here: 9.2% city: 3.9%
- Percentage of males in service occupations:
Here: 42.5% city: 6.2%
- Percentage of males in sales and office occupations:
Here: 17.4% city: 11.6%
- Percentage of males in construction, extraction, and maintenance occupations:
Here: 6.4% city: 2.2%
- Percentage of males in material moving occupations:
Here: 6.7% city: 2.3%
Occupations of females:
- Percentage of females in management occupations (except farmers):
Here: 3.7% city: 16.1%
- Percentage of females in business and financial operations occupations:
Here: 54.2% city: 10.5%
- Percentage of females in computer and mathematical occupations:
Here: 5.0% city: 13.9%
- Percentage of females in life, physical, and social science occupations:
Here: 1.3% city: 1.2%
- Percentage of females in arts, design, entertainment, sports, and media occupations:
Here: 9.1% city: 3.2%
- Percentage of females in healthcare practitioners and technical occupations:
Here: 13.1% city: 8.3%
- Percentage of females in sales and office occupations:
Here: 14.4% city: 17.9%
Education in this neighborhood (subdivision or community):
- Percentage of people 3 years and older in K-12 schools:
Glendale: 9.1% Bellevue: 16.8%
- Percentage of people 3 years and older in undergraduate colleges:
Glendale: 7.8% Bellevue: 3.2%
- Percentage of people 3 years and older in grad. or professional schools:
Glendale: 0.1% Bellevue: 2.0%
- Percentage of students K-12 enrolled in private schools:
Glendale: 88.9% Bellevue: 16.0%
Percentage of population below poverty level:
| Glendale: | 20.7% |
| Bellevue: | 7.4% |
Percentage of married-couple families with both working:
| Glendale: | 100.8% |
| Bellevue: | 56.4% |
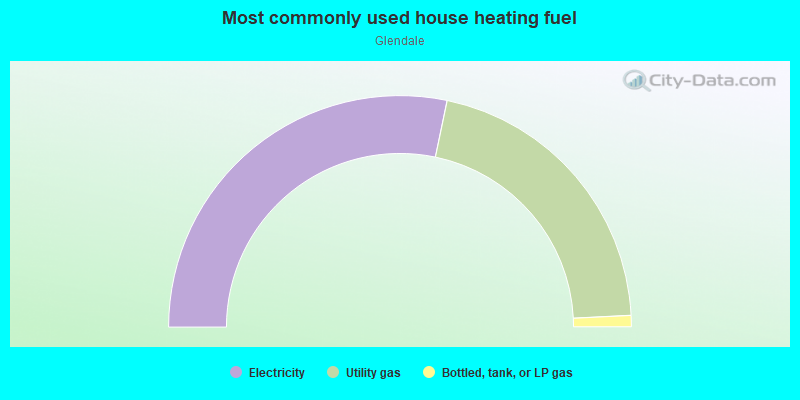
- 56.6%Electricity
- 41.9%Utility gas
- 1.6%Bottled, tank, or LP gas
Roads and streets:
140th Ave NE
Length: 0.75 miles
Directions: E-W, N-S
Address range: 1 to 639
Directions: E-W, N-S
Address range: 1 to 639
Main St
Length: 0.36 miles
Direction: E-W
Address range: 13600 to 13999
Direction: E-W
Address range: 13600 to 13999
NE 2nd Pl
Length: 0.31 miles
Direction: E-W
Direction: E-W
NE 5th St
Length: 0.30 miles
Direction: E-W
Direction: E-W
NE 1st Pl
Length: 0.17 miles
Directions: E-W, N-S, SE-NW, SW-NE
Address range: 13800 to 13999
Directions: E-W, N-S, SE-NW, SW-NE
Address range: 13800 to 13999
NE 7th St
Length: 0.10 miles
Direction: E-W
Address range: 13600 to 13698
Direction: E-W
Address range: 13600 to 13698
Glendale Golf and Country Club
Length: 0.08 miles
Direction: N-S
Direction: N-S
136th Ave NE
Length: 0.03 miles
Directions: E-W, N-S, SW-NE
Directions: E-W, N-S, SW-NE